[Retracted] Classification and Visual Design Analysis of Network Expression Based on Big Data Multimodal Intelligence Technology
Abstract
The rapid development of the Internet in modern society has promoted the development of many different network platforms. In the context of big data, many types of multimodal data such as pictures, videos, and texts are generated in the platform. Through the analysis of multimodal data, we can provide better services for users. The traditional big data analysis platform cannot achieve a completely stable state for the analysis of multimodal data. The construction of multimodal intelligent platform can achieve efficient analysis of relevant data, so as to create greater economic benefits for the society. This paper mainly studies the historical development trend of big data multimodal intelligence technology and the data processing method of multimodal intelligence technology applied to network expression classification, including data acquisition, storage, and analysis. Finally, it studied the fusion algorithm between multimodal data and visual design, as well as the classification of network expression and the application result analysis of visual design in big data multimodal intelligence technology.
1. Introduction
Big data multimodal intelligence technology is widely used in many fields, and its future development potential is also very high. This technology mainly comes from the concept of mapping in mathematics, so the constituent elements of this technology are also very complex. With the rapid development of the Internet, big data multimodal intelligence technology has also undergone a variety of evolution stages (Kang Shin Hyun et al. 2021) [1], from handling a single type of data at the beginning to being able to handle text, audio, pictures, and other comprehensive data in different links. Although the multimodal related data is not perfect at present, it also provides stability for the development of the country (Kang Shin Hyuk et al. 2020) [2]. Multimodal intelligence technology is a hot field in recent years. For enterprises, it can help study and analyze the multimodal data generated by users. The obtained data can effectively provide an in-depth understanding of users and create benefits for the company (technology, imaging technology et al. 2020) [3]. Now, this technology has become the key research direction of researchers, applying it to more industries.
The big data multimodal intelligent technology was mainly based on Hadoop, a big data analysis platform. In this platform, data is not very good at processing and analyzing pictures. In the process of image analysis and processing, it is necessary to build a platform that can process multisource and multimodal data (information technology et al. 2020) [4]. In recent years, with the development of data depth learning algorithm and related technologies, the data processing ability of pictures has been greatly improved. The improvement of the algorithm also provides an important technical basis for the processing and analysis of multimodal data. The multimodal data analysis platform is also composed of a data calculation framework based on big data and a data depth learning algorithm framework. The multimodal data analysis platform can not only process and analyze massive data, but also accurately process and analyze image data (multimodal user interfaces et al. 2020) [5]. Researchers can quickly get all the data corresponding to the picture and then further process the relevant data.
This paper is mainly composed of three parts. The first part briefly introduces the application of big data multimodal intelligence technology in image processing and analysis data, and the discovery status of multimodal intelligence technology in various countries. The second part mainly studies the classification of network expression processed by big data multimodal intelligence technology, and the visual design of expression data under big data multimodal intelligence technology. The third part analyzes the classification results of network expression under big data multimodal intelligence technology, and the application results of visual design of expression data under big data multimodal intelligence technology.
2. Related Work
The concept of big data multimodal technology is not far away. The emergence of the Internet has promoted the research and application of this technology (Engineering et al. 2020) [6]. The embryonic stage of the development of big data multimodal technology is the rise stage of the Internet, which first appeared in 2006. At that time, the big data multimodal technology was not suitable for massive data processing and calculation. Subsequently, Spark, a big data platform, was successfully developed in 2009 and then developed rapidly in 2010 (technology, Information Technology et al. 2020) [7]. The big data multimodal technology inside the Spark platform can better process the data. TensorFlow 0.8, a distributed deep learning framework within the platform, is Google's distributed version of the artificial intelligence system in 2016 and is widely used in the field of image recognition. It can be seen from the above that Spark has become the current big data multimodal platform (de Aguiar Hilton B et al. 2019) [8]. It is mainly a distributed computing system, which is suitable for the needs of large-scale data computing. It also has good results in the process of image data processing and analysis, which is also the development trend of multimodal intelligent technology (Miccoli et al. 2019) [9].
The United States developed big data multimodal technology earlier, and the most far-reaching impact is to extract human fingerprint information. The fingerprint data can be saved by collecting human fingerprints. Because fingerprints are unique to individuals, the collected fingerprints are also unique (Williams Jessica et al. 2019) [10]. When this technology was first introduced, it was not widely used. Collecting everyone's fingerprints is a very huge amount of data and time-consuming process. (jasdev Bhatti et al. 2019) [11]. At that time, researchers were constantly looking for databases that could store massive data information. Later, with the development of science and technology, they naturally solved the problems related to data storage. Fingerprints also eventually became the identification of human individuals.
Germany's big data multimodal technology is widely used in the medical field (nanotechnology et al. 2019) [12]. They combined this technology with computers to obtain imaging technology. The specific data information of the scanned part can be obtained by scanning the patient with the medical instrument, and finally the corresponding data image can be obtained. At first, this technology was only used to take X-rays, the imaging was only composed of black and white, and the image was not very clear. Later, with the optimization of big data multimodal technology, more imaging methods were gradually added, and the generated images became clearer and clearer (Guobin Zhang et al. 2019) [13]. The development of this technology is also a breakthrough innovation in the history of medicine.
China applies big data multimodal technology to shopping software. It mainly depends on the users' preferences to give them targeted recommendations on products they may like (Mansukhani et al. 2019) [14]. When shopping software was just emerging, without the addition of this technology, users could only browse goods through keyword search. The shops inside the shopping software have never reached the phenomenon of hot sales, and users will not finally buy because browsing is a great waste of time. With the introduction of big data multimodal technology, users can select their favorite products through the commodity push on the home page. The addition of this technology has not only directly accelerated the development of China's economy, but also made online shopping the mainstream purchase channel in today's society.
Britain mainly combines big data multimodal technology into sports. Because big data multimodal technology can systematically analyze images, relevant researchers found this feature and applied this technology to the competition process of athletes. Specific analysis can be carried out on the captured images, such as athletes suspected of pressing the line during running (dey Neel et al. 2019) [15]. Big data multimodal technology can accurately analyze the corresponding pictures and finally accurately judge whether there are violations. The combination of sports and this technology also promotes the development of sports.
The above content is the development history of big data multimodal technology and the current development status of various countries in different fields.
3. Methodology
3.1. Research on the Classification of Network Expressions under Big Data Multimodal Intelligence Technology
In the process of big data multimodal intelligence technology classifying network expressions, it is necessary to build a multimodal platform for processing data. The multimodal data analysis platform based on big data studied in this paper is mainly divided into three aspects: basic environment, processing platform, and platform application [16]. The basic environment of the platform is mainly composed of switches, servers, memory, and CPU. The purpose of adding CPU is to ensure that the deep learning model can achieve efficient processing and maintain the stability of the whole platform system. In the processing part of the platform, it is mainly used to collect, store, and analyze multimodal data [17]. In the application of the platform, the main function is to detect whether the multimodal data analysis platform meets the design requirements.
In the process of constructing the platform environment, we first need to build the physical cluster, which is mainly composed of data nodes, management nodes, and graphics processor GPU data. As the name suggests, the management node is responsible for the management and scheduling task of the whole system. Once the node has a problem, all systems will not be able to call it. In order to solve this problem, this paper backs up the node. In case of failure, technology can replace the location of the management node. The main task of data node is data calculation and storage [18]. The data calculation ability of data node is directly reflected in the efficiency and speed of data analysis on the platform. The difference between data node and management node is that when a node fails, it will not affect the operation of other nodes. GPU data node is the most distinctive node type in the platform. It can process pictures efficiently and is also the core of the platform system [19]. The multimodal data analysis platform also needs to monitor the data of the cluster, mainly by installing node monitoring devices to systematically monitor the cluster. In terms of data security management, it mainly observes the node state in combination with the computer to ensure the normal operation of the data. This paper applies the YARN ResourceManager to manage the data as a whole. YARN can include all the above requirements for platform construction as a whole [20].
In the process of collecting expression data, the platform needs to collect network expressions from different sources. The acquisition module is mainly composed of data crawling and data collection. In the process of crawling data, the expression data is quickly obtained through the combination of distributed crawler system and multimodal data analysis platform. The data content part of crawling expression is shown in Figure 1.

It can be seen from Figure 1 that only the key data content in the expression is crawled inside the expression. On the one hand, consider the information about the specified target direction; on the other hand, adapt to the direction of big data update. It makes it more objective to find the basic information of screening objects in the network. The platform system further collects the crawled data. Flume is used to collect expression data in this paper. Flume can monitor the contents of the directory in real time without putting great pressure on the platform server.
The data storage module in the platform system mainly uses the distributed file system HDFS. HDFS is often suitable for platform systems dealing with a large amount of data and can automatically expand the database. Similarly, the fault tolerance of the overall performance of HDFS is also excellent. Because HDFS has automatic data backup function, data can be recovered from HDFS in case of data loss and damage. In the process of interaction with users, by adding nonrelational database HBase in HDFS, users can provide real-time read-write access to the data in the database and control the system.
The data analysis module in the platform system is mainly responsible for analyzing expression data. The data analysis module studied in this paper mainly adds the big data processing framework Spark and the computer vision machine learning software library OpenCV to analyze the data of expression images. The combination of Spark and OpenCV meets the needs of multimodal data analysis platform for massive data analysis. The main function of OpenCV is a common method for processing expression images, which is better at extracting feature information. After the combination of Spark and OpenCV, the processing ability of expression images has been greatly improved. The scheme flow chart of Spark and OpenCV is shown in Figure 2.
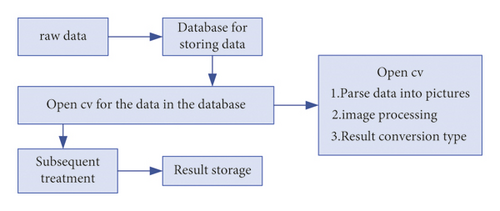
As can be seen from Figure 2, in the process of combining Spark and OpenCV, Spark is first used to read expression data. Each expression data item will be changed into a separate individual, and then OpenCV will be called. OpenCV parses the individual expression data item and finally converts it into Spark data type. Although it seems that OpenCV is optional, its addition can easily extract the feature data in the expression. After comparing all the extracted feature data, we can quickly classify the expressions, which is also in line with the research on the classification of network expressions in this paper.
Due to the expression analysis results generated by the above contents, ordinary users cannot understand it at all or cannot get the required information. Therefore, this paper also adds a visualization module to increase the interaction between the platform and users. Considering the large amount of expression data, the design of the visualization module is mainly based on the Java Spring MVC Framework combined with the data visualization chart library ECharts. The design of the front end aims mainly to allow users to manage data and login permissions. The expression data part is mainly in the display part, which allows users to more intuitively see the characteristic data inside the expression. Subsequent users can also add and delete expression data. Adding a visualization module to the big data multimodal data analysis platform can more intuitively see the classification of network expressions.
3.2. Research on Visual Design of Network Expression under Big Data Multimodal Intelligence Technology
Through the similarity function obtained by the model, the expression image is registered, and finally the optimal transformation amount of image data is obtained. According to the different modes of expression image, image registration methods can be divided into single-mode registration method and multimode image registration method. This paper mainly studies multimode image, so multimode registration method is used. The multimodal expression image registration method includes three parts: image spatial transformation, similarity measure, and optimization algorithm. In the following, this paper mainly uses these three aspects for multimodal image registration of expression data and then carries out visual design research.
By substituting the displacement, velocity, and force, the registration data are obtained by calculation. Although the viscous fluid model is suitable for the transformation of expression images, it also has some limitations. It cannot be used for expression images with violent displacement.
All unknown coefficients are obtained through the above function formula. The smaller the coefficient, the higher the accuracy and stability of the calculation. In order to avoid data folding, a large deformation differential homeomorphism metric mapping registration method is added to the above design operation of expression data reorganization. Two kinds of picture data information conversion data trends are shown in Figure 3.
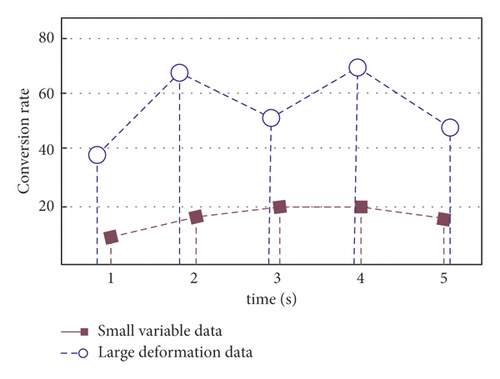
Finally, a new expression is designed through the optimized expression data fusion method, and the final screening can be carried out from the designed new expression, which not only improves the work efficiency, but also creates benefits.
4. Result Analysis and Discussion
4.1. Analysis of Research Results of Network Expression Classification under Big Data Multimodal Intelligence Technology
In order to further verify the expression image classification by big data multimodal intelligent data analysis platform, we recognize the expression images with different complexity and compare the performance of the algorithms by using different algorithms in the process of expression image recognition. The main expression image content recognition mainly adopts deep learning algorithm and image analysis algorithm. In the process of exploring the test results, four groups of expression images with different types and complexity were used to study the results. Firstly, each group of expression data is analyzed, and then the characteristic data are extracted. Finally, after all the data are extracted, the expression data is classified. In the above operation process of expression data, the main algorithm is still the deep learning algorithm inside the CPU. The data processing rate of multimodal data analysis system for expressions with different complexity is shown in Figure 4.
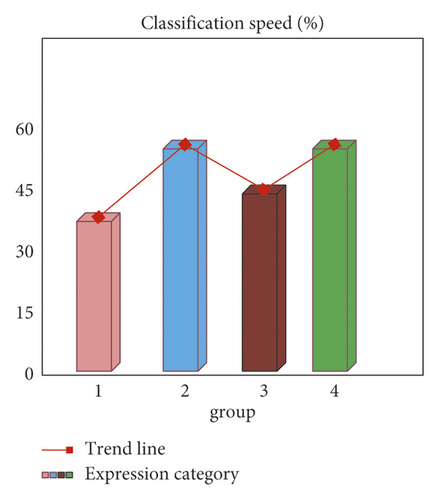
As can be seen from Figure 4, when the platform system using the deep learning algorithm performs data analysis and classification processing on expression images, the image processing rate with higher complexity is lower. The processing rate of complex expression image is more than 30%, and the processing rate of simple expression image is as high as 50%. Therefore, the data processing performance of deep learning algorithm is very suitable for the network expression to be analyzed in this paper. At the same time, the obtained result data can also let users intuitively see the data analysis and processing process, which further verifies the practical application ability of the big data multimodal technology studied in this paper, as well as the good system performance that can be widely used by the society.
4.2. Analysis of Research Results of Visual Design of Network Expression under Big Data Multimodal Intelligence Technology
In the visual design of network expression under big data multimodal intelligence technology, it is mainly through data reorganization and shape to new expression. In order to further verify the function of data fusion, a visual data expression is designed. 400 groups of expression image data are selected in this experiment, including multimodal expression data and traditional single-mode expression data. Compared with multimode expression data, traditional single-mode expression data are usually very simple picture types. At the same time, the four methods cited above to calculate the registration amount of different models will also be used in the process of expression data fusion and reorganization. Firstly, the model identification of the sample expression data is carried out, then the registration amount is calculated, and then the reorganization design is carried out. Finally, the designed new expression is compared with the original data to obtain the data utilization rate for further analysis. The utilization of multimodal data and traditional data in the visual design process is shown in Figure 5.
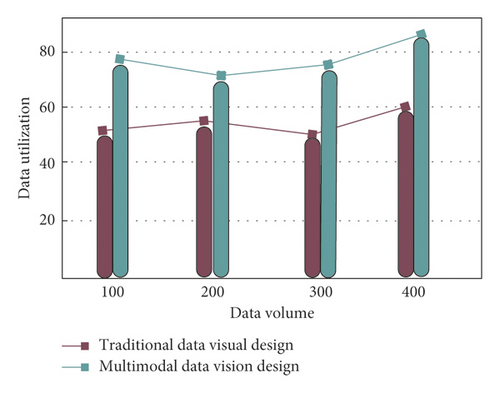
As can be seen from Figure 5, the application rate of traditional single-mode expression data is much lower than that of multimodal expression data. It also proves that the single-mode expression data is too single to be used in multimodal intelligence technology. There are many unusable expressions in the new expressions obtained from single-mode expression data. Most of the expressions obtained from multimode expression data can be put into the market. Through the above research results of network expression visual design under big data multimodal intelligence technology, it is verified that the platform studied in this paper has a very strong data fusion and reorganization ability, and the verification of this ability also improves the ease of use and social practicability of the platform. It can also be seen that the future development potential of big data multimodal intelligent technology is unfathomable.
5. Conclusion
Through the application of big data multimodal intelligence technology, we can better classify and visually design network expressions. In the current big data, multimodal data analysis platform cannot guarantee the effective support of multisource multimodal data. Under this environment, an optimization platform for multimodal data analysis is constructed. This paper mainly introduces the development trend and future social application value of big data multimodal intelligence technology. It mainly analyzes and processes the data efficiently according to the deep learning algorithm; that is, it collects, stores, and analyzes the expression image information, so as to achieve the rapid classification of network expressions. Finally, according to the multimodal expression data, the corresponding model is added for data registration, and finally the new expression after fusion transformation is obtained, so as to achieve the design of the data. The application rate of traditional single-mode expression data is much lower than that of multimode expression data. The algorithm innovation of this paper has strong data fusion and reorganization ability and improves the ease of use and social practicability of the platform.
Conflicts of Interest
The authors declare that they have no conflicts of interest.
Acknowledgments
This work was supported by Qingdao Huanghai College.
Open Research
Data Availability
The data used to support the findings of this study are available from the corresponding author upon request.


