Road Performance and Ice-Melting Characteristics of Steel Wool Asphalt Mixture
Abstract
Elastic pavements, low-freezing point pavements, and energy exchange pavements meet the function of road ice and snow melting but may damage the pavement performance. To solve the above problems, this study intends to develop a noncontact snow-melting pavement by using induction heating technology. The steel wool asphalt mixture was prepared, and the effects of steel wool on road performances including the high-temperature performance, low-temperature performance, water stability, and fatigue performance were studied. The influence of the asphalt mixture’s factors, environmental factors, and human factors on the ice-melting characteristics of steel wool asphalt mixture was analyzed. A prediction model of the ice-melting rate of steel wool asphalt mixture based on a double-hidden layer backpropagation (BP) neural network was established. The results show that the road performance of the asphalt mixture mixed with steel wool mostly meets the requirements of the specification. The increase in steel wool content and length can improve the road performance to a certain extent. In terms of ice-melting performance, the content and length of steel wool have a beneficial effect on the ice-melting rate. The lower the ambient temperature or the thicker the ice layer, the slower the ice-melting rate. The greater the heating intensity, the faster the ice-melting rate. The average absolute error of the melting ice prediction model is 0.016, so the melting ice effect can be well predicted by this model.
1. Introduction
Road icing is easy to induce traffic accidents. According to statistics, 35% of traffic accidents in winter are related to road ice and snow weather [1–3]. In China, more than 70% of roads will be affected by snow and ice in winter [4, 5]. The ice layer weakens the coefficient of friction between the rubber tire and the road surface and reduces the tire adhesion by 60–75% [6, 7]. Melting ice and snow have been widely studied. Traditional ice and snow removal measures include mechanical methods and snow-melting agents, which are also the most widely used. However, the mechanical method of snow removal is effective, but the deicing effect is limited and is prone to damage to the road surface. The snow-melting agent method consumes a large amount of industrial salt, and China uses about 30 million tons of snow-melting salt every year in winter [8, 9]. With the continuous increase in highway mileage, the use of snow-melting salt will continue to increase. Excessive use of snow-melting salt affects the surrounding environment. Given this, researchers have developed new pavements such as elastic pavement, low-freezing point pavement, and energy exchange pavement to cope with ice and snow weather.
Elastic pavement uses rubber particles to replace some fine aggregates, so that asphalt concrete has a large deformation capacity. After the pavement is frozen, under the action of vehicle load, the uncooperative deformation of the ice layer and the asphalt pavement promotes the ice layer rupture. After the ice layer fracture, the residual ice on the road can be quickly removed with the help of the road sweeper. Shang et al. studied the ability of rubber asphalt mixture to inhibit icing through repeated water spraying and rolling tests on the surface of asphalt pavement under a negative temperature environment [10]. Tan et al. found that increasing the thickness of rubber particle asphalt mixture pavement and using a flexible base can significantly improve the pavement deicing effect [11].
Low-freezing point pavement is to add low-freezing point additives replacing filler into the asphalt mixture. Low-freezing point additives such as sodium chloride, calcium chloride, magnesium chloride, and other chloride salts will dissolve in the presence of water on the road surface, thereby reducing the freezing point of water on the road surface. Meng et al. analyzed the ice-melting and snow-melting performance of low-freezing point emulsified asphalt fog seal pavement under different temperature conditions through indoor and outdoor tests [12]. Tan et al. developed a slow-release low-freezing point additive with a hydrophobic effect, which can reduce the road icing temperature to −25°C and at the same time significantly improve the long-term performance of low-freezing point pavement [13].
Energy exchange pavement uses various forms of heat energy to melt ice and snow. The sources of heat energy include the heat pipe method, heating wire method, and conductive asphalt concrete method. Xu et al. studied the temperature distribution characteristics and snow-melting characteristics of the static snow-melting process and dynamic snow-melting process of fluid heated pavement and preheating and nonpreheating snow-melting process [14, 15]. Zhang et al. studied the effect of the distance between heating cables on the efficiency of deicing and snow melting of cement concrete bridge deck [16]. Hai et al. studied the distribution of graphite in asphalt concrete through microscopic imaging and carried out an actual heating test on asphalt mixtures [17]. Notani et al. studied the effects of different carbon fiber sources and lengths on the volume, resistivity, and heat generation efficiency of conductive asphalt concrete [18].
Although the above methods solve the problem of melting ice and snow, it also induces some new problems. Rubber particles in elastic pavement increase the difficulty of pavement compaction, and elastic pavement may also increase vehicle fuel consumption [19]. The low-freezing point additives in pavement slowly dissolve, and this solution is under the condition of osmotic pressure, which means that it will also be slowly released in the rainy season. The valid period for melting snow and ice on the low-freezing pavement is the key problem. In addition, after the dissolving of low-freezing point additives, the internal micropores of the asphalt pavement will affect its road performance [20]. The heating pipe and heating wire methods are more expensive and more cumbersome than traditional construction. The important point is to change the internal structure of the pavement, laying hidden dangers to the durability of the pavement structure [21]. Conductive asphalt concrete uses graphite, carbon fiber, and other materials to increase the conductivity of the mixture and takes the whole pavement structure as a heating resistance. The theory is feasible, but the efficiency is low, and there is also a risk of leakage [17, 22].
To ensure the function of snow and ice melting and reduce the impact of the introduction of new technology on the pavement structure, this paper proposes to use electromagnetic heating for pavement ice melting. The electromagnetic heating method is to add the excitation material into the asphalt mixture and then heat the asphalt mixture by electromagnetic induction heating to produce an eddy current effect in the excitation material. Electromagnetic heating technology was originally applied in the field of self-healing of asphalt pavement [23]. However, there are few reports on its application in the study of pavement melting ice and snow.
In this paper, steel wool was used as electromagnetic heating material to study the ice-melting effect of steel wool asphalt mixture under electromagnetic induction heating. The research ideas and objectives were as follows. Firstly, different types of asphalt mixture specimens were prepared with the content of steel wool and the length of steel wool as variables, and the effect of steel wool on the road performance of the asphalt mixture was preliminarily studied. Secondly, the ice-melting law of steel wool asphalt mixture under different ice-melting conditions was explored through an induction heating test. Finally, according to the ice-melting law, the ice-melting rate model was established to estimate the snow-melting efficiency under different conditions, to provide a reference for using electromagnetic heating technology to carry out ice-melting.
2. Materials and Methods
2.1. Raw Materials
- (1)
Asphalt: to enhance the water stability of the asphalt mixture, the asphalt used in the test was SBS (I-D) polymer-modified. The specific performance indexes of modified asphalt are shown in Table 1.
- (2)
Aggregates and fillers: both course and fine aggregates were basalts. The filler was ground limestone mineral powder. The basic indexes are shown in Tables 2 and 3.
- (3)
Steel wool: the density of steel wool is 7.5 g/cm3. And its diameter is 70–130 μm. The average lengths are 2 mm, 4 mm, and 6 mm respectively, and their resistivity is 7 × 10⁻⁷ Ω cm.
- (4)
Gradation: with reference to the Technical Specification for Construction of Highway Asphalt Pavement (JTG F40-2004) of China, the asphalt mixture gradation is shown in Table 4.
- (5)
Preparation method of steel wool asphalt mixture: the steel wool is light and easy to agglomerate, so the dry mixing method was used to add the steel wool to the mixture. First, mix the aggregates with a mixer for 30 s. The steel wool is divided into three parts by weight. The steel wool is added to the mixed aggregate in three batches. After adding steel wool each time, mix for 10 s. Then, add the asphalt with a dosage of 4.8% to mixed aggregates and mix for 60 s. Finally, add the filler and mix for 60 s. The total mixing time was 180 s, and the mixing temperature was 165°C.
| Technical index | Unit | Requirement | Test value | Testing standard | |
|---|---|---|---|---|---|
| Penetration (25°C, 5 s, 100 g) | 0.1 mm | 40–60 | 58 | T0604-2011 | |
| Penetration index | — | ≥0 | 0.035 | T0604-2011 | |
| Softening point | °C | ≥60 | 68 | T0606-2011 | |
| Ductility (5oC) | cm | ≥20 | 31 | T0605-2011 | |
| Brookfield viscosity (60oC) | Pa·s | ≤3.0 | 2.13 | T0625-2011 | |
| Elastic recovery (25oC) | cm | ≥75 | 78.0 | T0662-2000 | |
| Flash point | °C | ≥230 | 296.8 | T0611-2011 | |
| Storage stability | °C | ≤2.5 | 2.0 | T0611-2011 | |
| Rolling thin film oven test | Quality change | % | ±1.0 | −0.150 | T0609-2011 |
| Penetration ratio | % | ≥65 | 77.2 | T0604-2011 | |
| Ductility (5 cm/min, 10°C) | cm | ≥15 | 16 | T0605-2011 | |
| Technical index | Unit | Requirement | Test value | Testing standard | |
|---|---|---|---|---|---|
| Course aggregates | Crushing value | % | ≤26 | 20 | T0316-2005 |
| Wear loss of Losangeles | % | ≤28 | 21 | T0317-2005 | |
| Water absorption | % | ≤2.0 | 0.81 | T0304-2005 | |
| Polishing value | % | ≥42 | 45 | T0314-2000 | |
| Fine aggregates | Apparent density | t/m3 | ≥2.50 | 2.675 | T0330-2005 |
| Sand equivalent | % | ≥60 | 65.2 | T0334-2005 | |
| Methylene blue value | g/kg | ≤2.5 | 2.0 | T0349-2005 | |
| Technical index | Unit | Requirement | Test value | Testing standard | |
|---|---|---|---|---|---|
| Apparent density | t/m3 | ≥2.50 | 2.758 | T0352-2000 | |
| Water content | % | ≤1 | 0.3 | T0103-1993 | |
| Hydrophilic coefficient | — | <1 | 0.7 | T0353-2000 | |
| Plasticity index | % | <4 | 2.4 | T0118-2007 | |
| Heating stability | — | Measured record | No obvious discoloration | T0355-2000 | |
| Particle size range | <0.6 mm | % | 100 | 100 | T0351-2000 |
| <0.15 mm | 90–100 | 95.9 | |||
| <0.075 mm | 75–100 | 87.8 | |||
| Gradation types | Mass percentage passing the following sieve holes (square sieve, mm) | ||||||||||
|---|---|---|---|---|---|---|---|---|---|---|---|
| 16 | 13.2 | 9.5 | 4.75 | 2.36 | 1.18 | 0.6 | 0.3 | 0.15 | 0.075 | ||
| AC-13C | 100 | 98.3 | 70.2 | 44.9 | 32.9 | 21.6 | 16.8 | 12.3 | 8.2 | 5.3 | |
| Technical requirement | Upper limit | 100 | 100 | 85 | 68 | 50 | 38 | 28 | 20 | 15 | 8 |
| Lower limit | 100 | 90 | 68 | 38 | 24 | 15 | 10 | 7 | 5 | 4 | |
There are two forming methods involved in this paper, one is the compaction method to prepare the Marshall specimens, and the other is the wheel rolling method to prepare the rut plate specimens. The molding temperature for both methods was 165°C. The Marshall specimens were formed by compacting the front and back sides of the asphalt mixture 50 times, respectively. The rutting plate specimens were formed by rolling 24 times with a wheel roller. For detailed molding processes, refer to the “Standard Test Methods of Bitumen and Bituminous Mixtures for Highway Engineering“ (JTG E20-2011).
2.2. Test Method
2.2.1. Basic Road Performance Test
- (1)
High-temperature performance test: fifteen kinds of rutting plate specimens were prepared with steel wool fiber content and length as variables. The specimen of 300 × 300 × 50 mm3 was formed by a wheel roller. The high-temperature performance of steel wool asphalt mixtures was studied through the rutting test. The dynamic stability is the number of rollings required to generate 1 mm of ruts on average and is used as an index to evaluate high-temperature performance.
- (2)
Low-temperature performance test: rutting plate specimens of the same type as (1) were prepared. Then prisms of 250 × 30 × 35 mm3 were cut. Under the low-temperature environment, the insufficient resistance to tensile strain at the bottom of the asphalt pavement is the main factor causing the failure of the asphalt pavement. Therefore, the low-temperature performance of steel wool asphalt mixtures was studied by taking the low-temperature failure strain as the index through the low-temperature bending test at −10°C.
- (3)
Water stability test: fifteen kinds of Marshall specimens were prepared with steel wool fiber content and length as variables. The Marshall specimens were obtained by compaction test. There are 8 Marshall specimens of each type, of which 4 specimens are subjected to a splitting test after 1 freeze-thaw cycle. The other 4 were directly subjected to the splitting test without freezing and thawing. The ratio of the splitting strength of the freeze-thawed and unfrozen-thawed specimens is an indicator of the water stability of the steel wool asphalt mixture.
- (4)
Fatigue performance test: fifteen kinds of asphalt concrete slabs with a size of 400 × 300 × 75 mm3 were prepared with steel wool fiber content and length as variables. Prisms with a size of 380 × 50 × 63 mm3 were cut. Through a four-point bending fatigue testing machine, under the conditions of an ambient temperature of 15°C and a loading frequency of 10 Hz, the fatigue life of the steel wool asphalt mixture was used as an index to study the fatigue performance of the steel wool asphalt mixture. The prism in the four-point bending test has 4 load points, the distance between the upper two pressure points is 119 mm, and the distance between the lower two support points is 357 mm.
| Test | Specimen size (mm3) | Fiber content (%) | Fiber length (mm) | Sample type | Quality of each sample type | Total samples |
|---|---|---|---|---|---|---|
| (1) | 300 × 300 × 50 | 1, 2, 3, 4, 5 | 2, 4, 6 | 15 | 4 | 60 |
| (2) | 250 × 30 × 35 | 1, 2, 3, 4, 5 | 2, 4, 6 | 15 | 3 | 45 |
| (3) | Φ101.6 × 63.5 | 1, 2, 3, 4, 5 | 2, 4, 6 | 15 | 8 | 120 |
| (4) | 380 × 50 × 63 | 1, 2, 3, 4, 5 | 2, 4, 6 | 15 | 3 | 45 |
2.2.2. Ice-Melting Test
The ice-melting characteristics of steel wool asphalt mixtures were studied by electromagnetic induction heating tests. The electromagnetic induction heating equipment was an LHG-6 KW induction heating machine. The temperature of ice layers was recorded by an infrared image, and 0°C was used as the sign of the complete melting of ice layers. In ice-melting tests, the production process of the ice layer was made by first vacuuming the Marshall specimens in the water. This is because when the road is icy, there is generally also water inside the pavement structure. The vacuum treatment of the specimens in water is to simulate the situation where the pavement structure is saturated with water and then seal the Marshall specimens around with tape. The edge of the tape is raised above the Marshall specimens to facilitate the preparation of an ice layer on top of the specimens. The water demand of the ice layer is determined by calibration. Finally, the sealing tape was removed and the ice-melting test was carried out.
Multiparameter cross tests were used to study the ice-melting characteristics of mixtures. The content of steel wool was 1, 2, 3, 4, and 5%, the fiber length was 2, 4, and 6 mm, the ice thickness was 3, 6, and 9 mm, the ambient temperature was −5, −10, −15°C, and the heating intensity was expressed by the output current, including 300, 400, 500, and 600 A. Unless otherwise specified, the content of steel wool was 3%, the length of steel wool was 4 mm, the ambient temperature was −15°C, the thickness of the ice layer was 3 mm, and the heating intensity of the electromagnetic induction heater was 600 A. The test parameters are shown in Table 6.
| Variables | Test conditions | |||||||
|---|---|---|---|---|---|---|---|---|
| Content (%) | Length (mm) | Temperature (°C) | Ice thickness (mm) | Heating intensity (A) | Sample type | Quality of each sample type | Total samples | |
| Content | 1, 2, 3, 4, 5 | 2, 4, 6 | −15 | 3 | 600 | 15 | 3 | 45 |
| Length | 1, 2, 3, 4, 5 | 2, 4, 6 | −15 | 3 | 600 | 15 | 3 | 45 |
| Temperature | 3 | 2, 4, 6 | −5, −10, −15 | 3 | 600 | 9 | 3 | 27 |
| Ice thickness | 3 | 2, 4, 6 | −15 | 3, 6, 9 | 600 | 9 | 3 | 27 |
| Heating intensity | 1, 2, 3, 4, 5 | 4 | −15 | 3 | 300, 400, 500, 600 | 20 | 3 | 60 |
2.3. Performance Prediction Method
- (1)
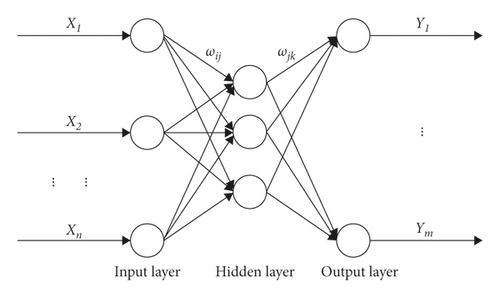
Determine the number of network input layer nodes n according to the input and output of the system, the number of hidden layer nodes l, and the number of output layer nodes m; initialize the input layer and connection weights between hidden and output neurons ωij and ωjk; initialize the hidden layer threshold value a and the output layer threshold value b, given learning rate and neuron excitation function.
- (2)
Based on the input variable X, connection weights ωij between the input layer and implied layer and implied layer threshold value a, calculate hidden layer output H.
(1) -
In equation (1), l is the number of hidden layer nodes, f is the hidden layer activation function, and the function expression is
(2) - (3)
According to the hidden layer output H, connection weight ωjk, and threshold value b, calculate the predictive output O of the BP neural network.
(3) - (4)
The network forecast error e is calculated according to the network forecast output O and expected output Y.
(4) - (5)
The network connection weights ωij and ωjk are updated according to the network prediction error e.
(5) -
In equation (6), η is the learning rate.
- (6)
Update network node threshold values a and b according to network prediction error e.
(6) - (7)
Judge whether the algorithm iteration is over; if it is not over, return to (2).
3. Results and Discussion
3.1. Basic Road Performance
3.1.1. High-Temperature Performance
Figure 2 is the dynamic stability of asphalt mixtures in rutting tests. When the steel wool length was 2 mm, the dynamic stability increased with steel wool content. When the lengths of steel wool were 4 mm and 6 mm, the dynamic stability first increases and then decreases with the content and reaches the peak when the content was 4%. When the content was the same, the dynamic stability increases with the fiber length. However, there was an exception; when the content was 5%, the dynamic stability reaches the maximum when the fiber length is 4 mm. An appropriate amount of steel wool can improve the high-temperature performance of the mixture. When the steel wool content is less than 5%, the high-temperature performance increases with the content of steel wool because steel wool was intricately distributed in asphalt mixture and plays a role in reinforcement. When the steel wool content is not less than 5%, steel wool may agglomerate in the mixture, and the addition of steel wool has an uncertain effect on high-temperature performance.
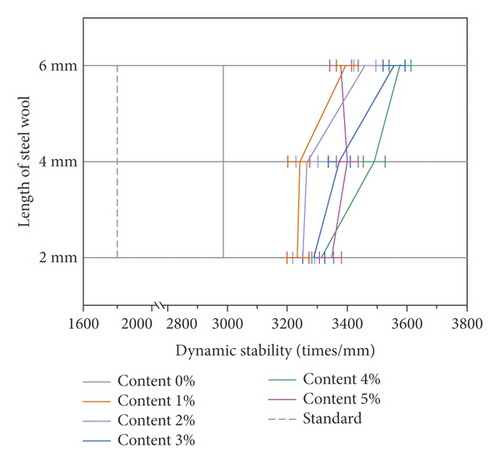
The dynamic stability of the fifteen kinds of asphalt mixtures was in the range of 3232–3577 times/mm. Technical Specification for Construction of Highway Asphalt Pavement (JTG F40-2004) requires that the minimum dynamic stability of the mixture using modified asphalt shall not be less than 1800 times/mm. Therefore, the high-temperature performance of the fifteen kinds of asphalt mixtures meets the requirements.
3.1.2. Low-Temperature Performance
Figure 3 shows the low-temperature failure strain of the mixture in low-temperature bending tests, which reflects the low-temperature crack resistance of the asphalt mixture. When the fiber length was 2 mm, the failure strain increases with the content of steel wool, but the increase gradually slows down. When the fiber length was 4 mm and 6 mm, the failure strains reached their peaks when the steel wool content was 4% and 3%, respectively. Long fiber can improve the low-temperature performance of the mixture to a certain extent. In particular, when the steel wool content is between 1 and 3%, the longer the length, the more obvious the improvement effect. But when the steel wool content is between 4 and 5%, the low-temperature performance decreases with the length of the steel wool. There seems to be a balance between steel wool content and length. The failure strain of the fifteen kinds of asphalt mixtures was 2651–3193 με, which meets the minimum specification requirement of 2500 με.

3.1.3. Water Stability Performance
Figure 4 shows the freeze-thaw splitting residual strength ratio of asphalt mixture in freeze-thaw splitting tests, which reflects the water stability of asphalt mixtures. On the whole, the high content of steel wool and long fiber has a certain gain effect on the water stability of asphalt mixtures. This gain effect was obvious when the fiber length was 2 mm. When the fiber length was 4 mm and 6 mm, the residual strength ratio reaches the maximum when the content was 4% and 3%, respectively.
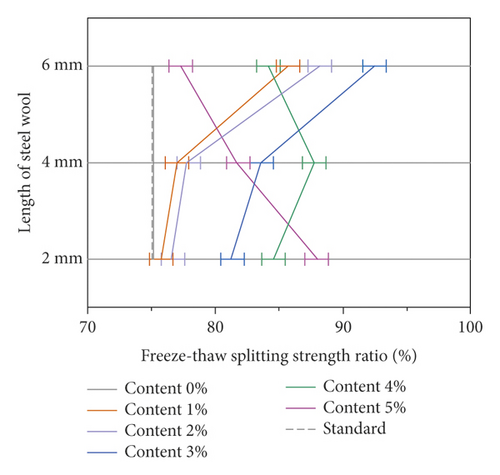
The freeze-thaw splitting residual strength ratio of the fifteen kinds of mixtures was in the range of 75.2–92.5% and the minimum residual strength ratio required by the specification was 75%. Therefore, except that the water stability performance of some asphalt mixture mixed with steel wool content of 1% and length of 2 mm does not meet the requirements, the performance of other specimens meets the road performance requirements.
3.1.4. Fatigue Performance
Figure 5 shows the fatigue life of the asphalt mixture in the four-point bending fatigue test, which reflects the durability of the asphalt mixture under long-term bending loads. When the stress ratio is 0.3 and the steel wool fiber length is 2 mm, the fatigue life increases with the fiber content. When the fiber length is 4 mm, the fatigue life of the specimens with a fiber content of 5% is not much different from that of the specimens with a fiber content of 4%. When the fiber length is 6 mm, the fatigue life has a decreasing trend at the content of 4% and 5%. In general, the increase in fiber content increases the fatigue life of asphalt mixtures, because the connection of fibers in the structure slows down the rate of decrease in the flexural modulus of the specimens.
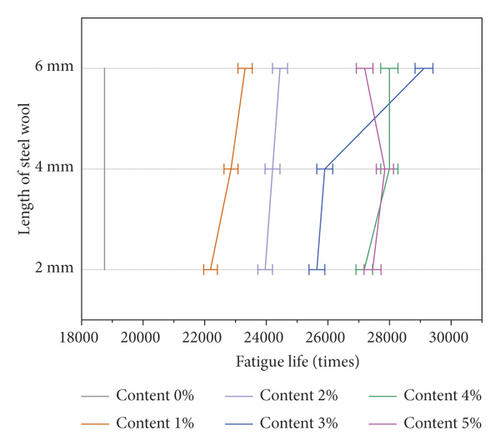
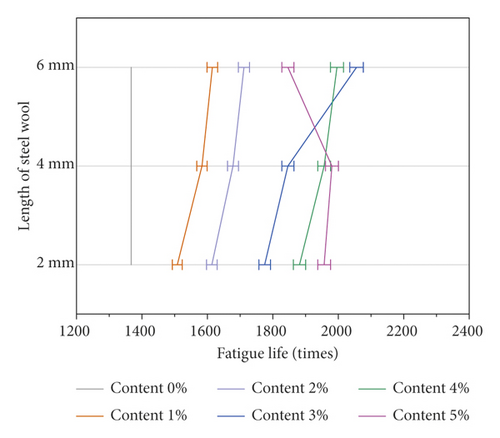
When the stress ratio is 0.5, the fatigue life is similar to that when the stress ratio is 0.3. Under the two stress environments, the fatigue times were the highest when the 6 mm fiber content is 3%. The maximum fatigue life under low-stress and high-stress conditions is 29118 and 2056, respectively. Fatigue life reflects the long-term mechanical properties of mixtures, but current specifications do not strictly limit fatigue life. Therefore, the fatigue life is only used as an auxiliary indicator here.
3.2. Ice-Melting Performance
From the three quantitative indicators of high-temperature performance, low-temperature performance, and water stability performance, it can be seen that the road performance of asphalt mixture with steel wool mostly meets the design requirements and has a certain gain effect. After the basic performance meets the requirements, the ice-melting test is carried out below. The factors affecting the ice-melting effect include the steel wool asphalt mixture itself (steel wool content, length), environmental factors (temperature, ice thickness), and anthropic factors (heating intensity). In the following, through the ice-melting test, the effects of steel wool content, steel wool length, ambient temperature, ice thickness, and heating intensity on the ice-melting characteristics were studied.
3.2.1. Steel Wool Content
Figure 6(a) shows the time required for ice melting under different steel wool content. With the increase of steel wool content, the melting time of the ice layer decreases gradually. When the fiber length is 2 mm and the content is increased from 1% to 5%, the ice-melting time is reduced from 126 s to 69 s. The ice-melting time of the mixture with 4 mm steel wool was shortened from 84 s to 46 s. The ice-melting time of the mixture with 6 mm steel wool was reduced from 77 s to 35 s. With the increase in steel wool content, the ice-melting time of 2 mm, 4 mm, and 6 mm was shortened by 45.2%, 45.2%, and 54.5% respectively. The increase of steel wool content leads to the increase of excitation material in Marshall specimens, the enhancement of overall magnetic conductivity of Marshall specimens, and the shortening of ice-melting time.
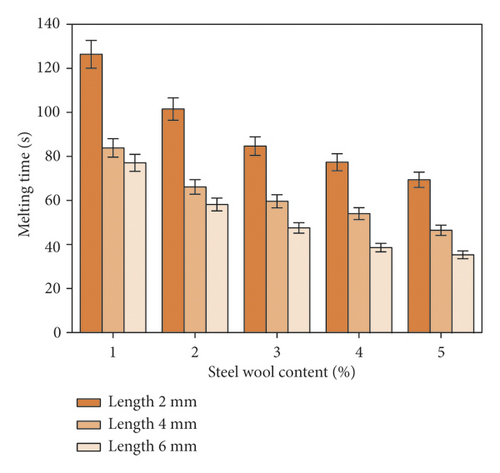
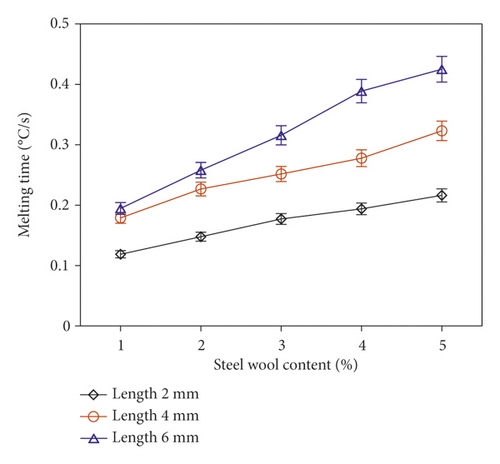
Figure 6(b) shows the heating rate under different steel wool content. The heating rate was related to the melting time. The melting time decreases with the content of steel wool, so the heating rate increases with the content of steel wool. The ice-melting rate of 2 mm, 4 mm, and 6 mm increased from 0.119, 0.179, and 0.195°C/s to 0.216, 0.323, and 0.425°C/s, respectively. The heating rates increased by 81.5%, 80.4%, and 117.9%, respectively. The heating rate of the mixture with 6 mm steel wool was significantly higher than that of the other two asphalt mixtures. The reason may be that the length of steel wool increases, resulting in the connection between steel wool distributed in Marshall specimens, which improves the thermal conductivity. Although the 4 mm long fiber was longer than the 2 mm fiber, it may still be in an independent distribution state under the test content, so the two heating rate curves have similar slopes.
3.2.2. Steel Wool Length
Figure 6(a) shows the ice-melting time for specimens containing fibers of different lengths. As the fiber length increases, the ice-melting time decreases. With 1% content, as the fiber length increases, the ice-melting time decreases from 126.4 s to 77.1 s. When the steel wool content is 2, 3, 4, and 5%, the ice-melting time was shortened from 101.5 s, 84.7 s, 77.3 s, and 69.4 s to 58.2 s, 47.5 s, 38.6 s, and 35.3 s, respectively. With the increase in the length of steel wool, the ice-melting time of the five contents (from less to more) was shortened by 39.0%, 42.7%, 43.9%, 50.1%, and 49.1%, respectively.
As the melting time decreases with the fiber length, the heating rate of the ice layer in Figure 6(b) increases with the length of steel wool. When the content is 1%, with the increase of fiber length, the heating rate increases from 0.119°C/s to 0.195°C/s, and the heating rate increases by 63.9%. The larger the content, the faster the heating rate. When the steel wool content is 5%, the heating rate increases from 0.216°C/s to 0.425°C/s, and the heating rate increases by 96.8%.
3.2.3. Ambient Temperature
To simulate the ice-melting effect of pavement electromagnetic heating under different environments, three different ambient temperatures were set, namely, −15, −10, and −5°C. The temperature of the environment was different, and the degree of heat loss was different, so the ice-melting time was also different. Studying the influence of ambient temperature on the effect of melting ice is convenient for setting different heating times for different ambient temperatures. Thereby, the electric energy can be reasonably utilized while ensuring ice-melting efficiency.
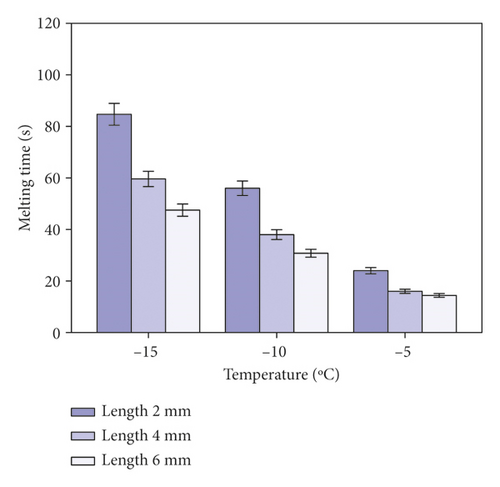
In Figure 7(a), under the environment of −15°C, the longest melting time of asphalt mixture with 2 mm steel wool was 84.7 s, followed by 59.6 s for mixture with 4 mm steel wool. The fastest ice-melting of mixture with 6 mm steel wool was 47.5 s. After the ambient temperature was raised to −5°C, the melting time of steel wool mixtures with 2, 4, and 6 mm fiber was 24.0, 16.0, and 14.4 s, respectively. When the ambient temperature increases by 1°C, the average heating time of steel wool asphalt mixture with the steel wool length of 2, 4, and 6 mm decreases by 6.1, 4.4, and 3.3 s, respectively.
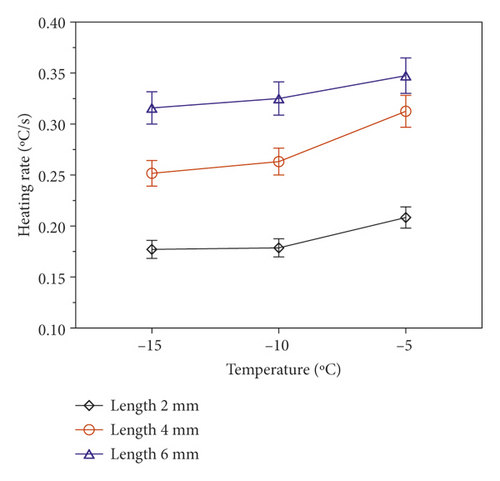
In Figure 7(b), with the increase in ambient temperature, the heating rate gradually increases. The heating rates of asphalt mixture with 2, 4, and 6 mm steel wool increase from 0.177, 0.252, and 0.316°C/s to 0.208, 0.313, and 0.347°C/s, respectively. The ambient temperature affects the heating rate, but the lifting range was less than that of the steel wool content and length.
3.2.4. Ice Thickness
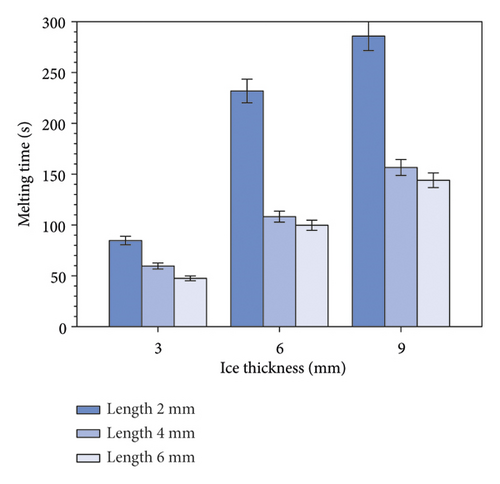
In practice, the weather conditions, road sections, and ice thickness may be different. For different ice thicknesses, it is reasonable to apply the corresponding heating time. Therefore, the ice layers with different thicknesses of 3, 6, and 9 mm were used to simulate the ice conditions in the actual environment.
In Figure 8(a), the thicker the ice, the longer it takes to completely melt. With the increase in ice thickness, the melting time of asphalt mixtures containing 2, 4, and 6 mm steel wool increased from 84.7, 59.6, and 47.5 s to 285.8, 156.6, and 144.0 s, respectively.
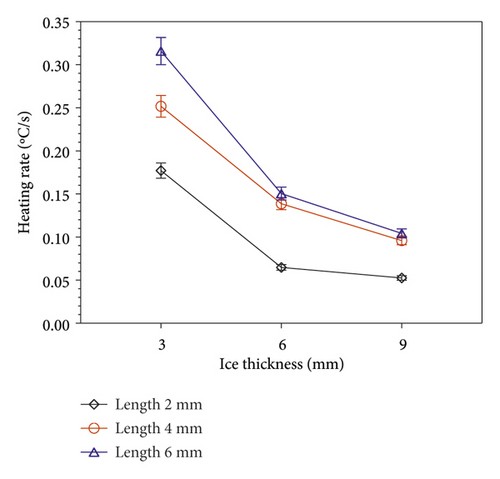
In Figure 8(b), the heating rate gradually decreases with the ice thickness. Taking the specimen with 6 mm steel wool as an example, the thickness of the ice layer was changed from 3 mm to 9 mm, and the heating rate was reduced from 0.316°C/s to 0.104°C/s. The reasons for the heating rate decreases with the ice thickness were as follows. First, the heat required for complete ice-melting increases with the ice thickness. Second, the increased thickness of the ice layer increases the distance between the induction heating coil and the steel wool inside the mixture, which may weaken the rate of change of the magnetic flux and thus reduce the effect of electromagnetic induction heating.
3.2.5. Heating Intensity
The electric energy output of the electromagnetic induction heating equipment was mainly controlled by the output current. According to the law of electromagnetic induction heating, the greater the current, the greater the change of magnetic flux around it. Therefore, the high current can promote the effect of electromagnetic induction heating and reduce the ice-melting time.
Figure 9(a) shows the time required for ice melting under different heating intensities. Regardless of the amount of steel wool, the ice-melting time decreases with the heating current, but the reduction was different with different content. The heating current was from 300 A to 600 A, and the heating time of the specimen with 1% steel wool was reduced by 51.4 s. Similarly, the Marshall specimens ice-melting time with 2, 3, 4, and 5% steel wool decreased by 33.0, 29.1, 26.1, and 20.4 s respectively. The more the content, the less the ice-melting time.
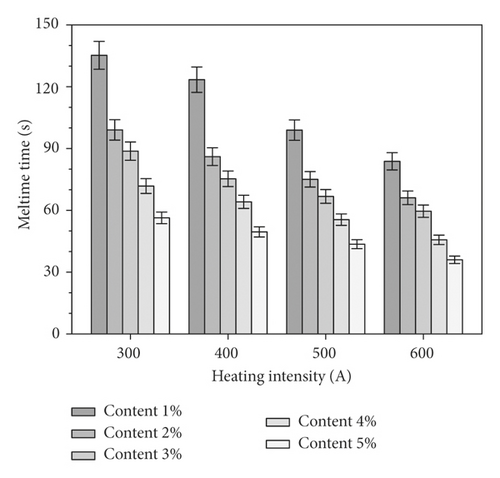
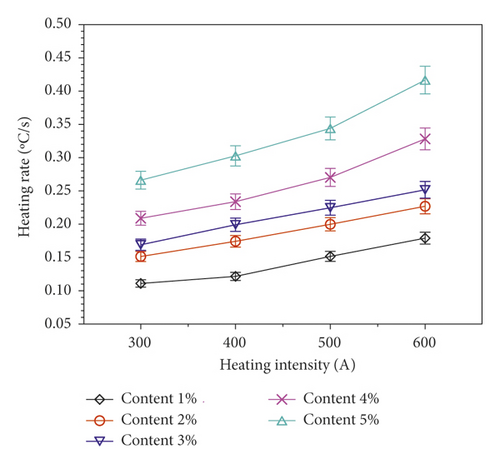
Figure 9(b) shows the heating rate of ice melting under different heating currents. The smaller the amount of steel wool and the smaller the heating current, the slower the temperature rise of the ice layer. Simply increasing the heating current can increase the heating rate of the mixture with 1% steel wool from 0.111°C/s to 0.179°C/s, with an increasing range of 61.3%. On this basis, increasing the content of steel wool can increase the heating rate to a max of 0.417°C/s, which is 275.7% higher than the initial 0.111°C/s.
3.3. Ice-Melting Performance Prediction
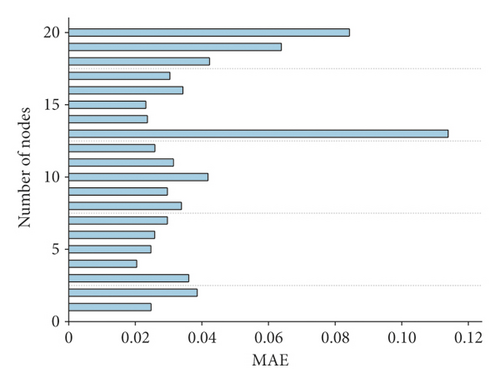
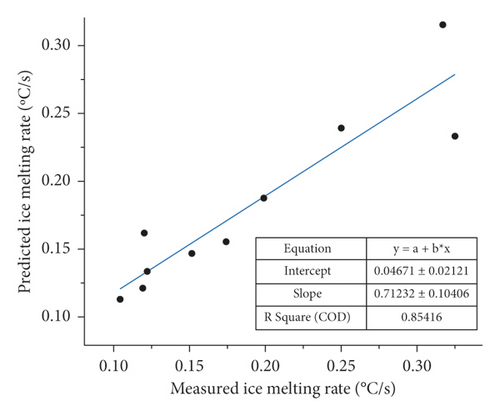
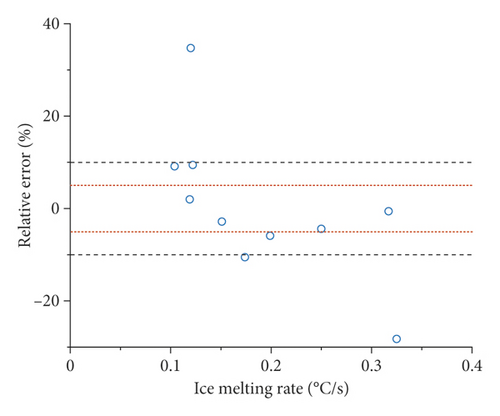

In equation (7), P is the actual value, P′ is the predicted value, and n is the number of test samples.
Figure 10 shows that when the number of neural nodes in a single-hidden layer was 4, the MAE was the smallest, which was 0.02. Therefore, a 5 × 4 × 1 single-hidden layer BP neural network prediction model was built. It can be seen from Figure 11 that the prediction effect of the single-hidden layer BP neural network model was remarkable, the relative error of 80% of the data was within 10%, and the relative error of 40% of the data was within 5%.
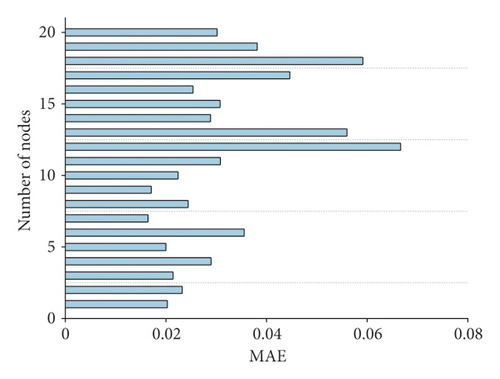
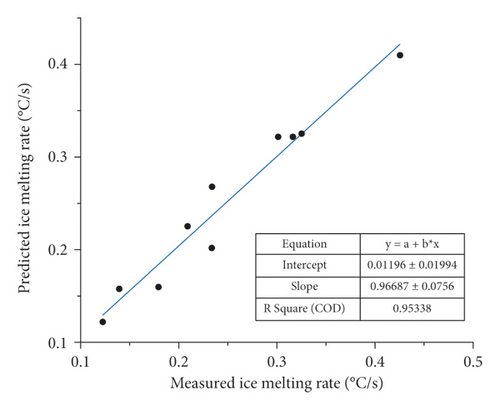
In Figure 12, when the number of double-hidden layer nerve nodes was 7, the MAE was the smallest, which was 0.016. A 5 × 7 × 7 × 1 double-hidden layer BP neural network prediction model was built. It can be seen from Figure 13 that the data with relative errors within 10% and 5% predicted by the double-hidden layer BP neural network model account for 60% and 40% of the test set, respectively, and the distribution was relatively scattered. The reliability of the double-hidden layer BP neural network model was slightly lower than that of the single-hidden layer BP neural network model, but the goodness of fit of the single-hidden layer BP neural network model was lower than that of the double-hidden layer BP neural network model. In summary, a 5 × 7 × 7 × 1 double-hidden layer BP neural network prediction model was recommended.
4. Conclusions
- (1)
The pavement performance of asphalt mixture mixed with steel wool meets the requirements of current specifications. With the increase in steel wool content and length, the low-temperature performance, high-temperature performance, and water stability of asphalt mixture have an increasing trend, but the growth space was limited. Steel wool can improve the fatigue properties of asphalt mixtures.
- (2)
The increase in steel wool content or length in the asphalt mixture will improve the ice-melting efficiency. The melting rate of asphalt mixture with a steel wool length of 6 mm when the content is 5% is 3.58 times that with a steel wool length of 2 mm when the content is 1%. The lower the ambient temperature and the thicker the ice layer, the more difficult it is for the mixture to heat up. At −5°C ambient temperature, the melting rate of the 9 mm thick ice layer is 29.6% of that of the 3 mm ice layer. In terms of manual intervention, the higher the heating intensity, the faster the ice-melting effect.
- (3)
The BP neural network (5 × 7 × 7 × 1) with double-hidden layers was recommended as the prediction model for steel wool asphalt mixture. The relative error was less than 10%, and the MAE was 0.016.
In this study, steel wool was incorporated into asphalt mixtures to study the basic road performance and ice-melting effect of steel wool asphalt mixtures. Steel wool as an excitation material increases the ice-melting rate of the mixture but may also accelerate the aging of the asphalt. In addition, the prediction model in this paper is only for the laboratory environment at this stage. Therefore, in the future, research will be carried out on the long-term performance of steel wool asphalt mixture and the optimization model based on field tests.
Conflicts of Interest
The authors declare that there are no conflicts of interest regarding the publication of this paper.
Acknowledgments
This study was supported by the Natural Science Foundation of Heilongjiang Province (No. QC2014C043) and the Fundamental Research Funds for the Central Universities (No. 2572015CB31). In addition, this study is grateful for the help provided by reference [2].
Open Research
Data Availability
The data used to support the findings of this study are available from the corresponding author upon request.


