A Novel AI-Based Approach for Better Segmentation of the Fungal and Bacterial Leaf Diseases of Rice Plant
Abstract
Rice is the most consumed food for more than half the world. All over the world, approximately 15% of the rice get wasted because of leaf diseases. A computer-aided system needs a clear segmented lesion to detect such diseases, but blurriness, bad contrast, and dust particles on leaves are the challenge in proper segmentation and, further, for better feature extraction. In this work, first, SegNet deep learning model was trained to separate the weed from the images captured from the field; then, in the next step, a novel automated segmentation technique named RPK-means proposed combining random path (RP) and K-means clustering to separate lesion spots from the leaf images. The work of the model is multifold. First, the SegNet model is trained for weed separation; then, two clusters of the image are generated by K-means clustering to find out pixel coordinates lying on the lesion spot and healthy part of the leaves. Thereafter, to separate the lesion part from the background, automatic segmentation is performed by the novel random path K-means (RPK-means) method using coordinate positions obtained at the last stage. Fungal and bacterial diseases like brown spot, rice blast, sheath blight, leaf scaled, and bacterial blight have been collected from the field to perform the experiments. Experimental result shows that the performance of the deep learning classifier increased by approximately 2-6% while applying to RPK-means preprocessed images, rather than the traditional K-means segmentation technique.
1. Introduction
Agriculture is the backbone of the economy of any country, and rice is among the most cultivated plants in all over the world. But farmer losses his 37% rice every year because of bad weather conditions and weed and leaf diseases in which 5 to 10% losses in rice occur due to rates, whereas bacterial and fungal disease causes approximately 15% of loss. Diseases that occur in leaves completely destroy the leaves, due to which the fruit does not grow in the plant. To detect these diseases with the help of computer, clear pictures of leaves are required, but when a farmer takes a picture of infected leaves from the field, there may be some more leaves visible in background. To separate these background leaves, we always need an automated system which can segment the region of interest accurately which may lead to better feature extraction in future. Recently, color-based segmentation techniques are used in many research to segment the disease portion from a leaf of crop, most of such approaches first convert the RGB inputs into gray color then segmented by thresholding technique [1]. Weed separation from the crop is another most challenging task because images directly taken from the field contain three classes of rice, weed, and background thereafter; also, we need ground truth image dataset, to evaluate the quality of segmentation [2]. So, segmentation of plant disease is a multifold approach, i.e., separation of weed, separation of background, and finally preparation of ground truth dataset for evaluation. Many research has been done recently to focus on proper segmentation of boundaries of the object rather than concentrating on central pixels. Also, the use of supervised machine learning algorithms [3] like support vector machine, decision tree, and neural network models and many unsupervised learning approaches like K-means clustering and fuzzy means clustering [4] has been proposed for better segmentation. All these techniques provide better segmentation of leaf diseases but need more data and time for training. In the same manner, some authors proposed the use of deep learning model in their research for segmentations, which uses pooling layer to reduce the feature by reducing background information, but at the same time, some part of the region of interest also reduces. To overcome this issue, some authors presented the use of SegNet model [5]; in the SegNet, before performing the max pooling operation, it keeps the record of index of each pixel so that it can be used later for upsampling.
Segmentation of images for the extraction of the accurate region of interest (ROI) plays a crucial role that drastically reduces the data size to be analysed as well as performs better for feature extraction. Hence, it is desirable to extract only ROI for effectively analysing the required problem. Fuzzy logic and K-means clustering-based techniques have been used by many researchers to segment the ROI from plant images [6]. Due to irregular texture, presence of dust particles on the leaf, the effect of sunlight, presence of shadow, and presence of bacterial and fungal diseases make the boundary of leaves irregular and thus leads to inaccurate segmentation while using traditional image processing approaches [7]. In the real-time images, there may be lots of leaves in the background which need to separate for better segmentation of lesion portion and has a major challenge in this area.
For the excessive green index (EXG), vegetative index (VEG), and color index of vegetative extraction (CIVE), the idea was based on that in RGB images of plant, and green channel information is more useful for segmentation and can be treated as foreground object [8]. The color-based segmentation suffers from oversegmentation due overlapping leaves and similar background. Other techniques like mean shift segmentation [9], K-means segmentation [10], and random walk segmentation [11] are used by many authors to detect region of interest from plant leaves. But clustering and mean shift techniques have limitations in finding accurate boundary of lesions and suffer from oversegmentation or undersegmentation, whereas random walk method needed more human intervention to select the coordinates of foreground and background pixels. Deep learning models, like SegNet [5] and UNet [12], became more popular these days to segment lesions from plant leaves as these models are artificial intelligence-based models, and their prediction is more near to a human being unlike other conventional image processing-based models [13]. Similarly, feature extraction uses conventional image processing techniques limited to texture features [14], color features [15], local features, and global features [16], but as the plant disease has versatile nature, so some additional features like angle of pixel shifting after disease, change in shape of leaf, time to time change in color of leaf needed to predict the disease in early stage. So deep learning models have been used in many researches to extract minute features of the input image. In most of the research, we found that signet model outperforms the fully connected neural network model because it extracts the low features using encoders and converts them to high-resolution features using decoders [17, 18].
Automated K-means clustering method [10] and some authors have also used soft computing techniques to get the threshold value for segmentation [19]. Most of these techniques mainly faced the problem of under- and oversegmentation. So, for the betterment of segmentation result, various researchers proposed the fusion of two or more techniques. Fusion of color space transformation and clustering applied on leaves of crops and vegetables [20] faced the problem of low accuracy in classification. In another work [21], a fusion of super pixel segmentation with K-means clustering got better accuracy, but study is limited to 2 types of disease only. Another study said that the combination of color features and region-based segmentation shows better results over other traditional methods [22]. Segmentation of images for the extraction of the accurate region of interest (ROI) plays a crucial role that drastically reduces the data size to be analysed as well as performs better for feature extraction. Hence, it is desirable to extract only ROI for effectively analysing the required problem. Segmentation is an approach that can be used to extract ROI, and it is always a challenging task for extracting ROI. Fuzzy logic and K-means clustering-based techniques have been used by many researchers to segment the ROI from plant images [23]. Due to irregular texture, presence of dust particles on the leaf, the effect of sunlight, presence of shadow, and presence of bacterial and fungal diseases make the boundary of leaves irregular and thus lead to inaccurate segmentation while using traditional image processing approaches [24]. Background also plays very important role in the segmentation, because taking images of leaves from a farmer’s land may have many leaves in the background and generate the irregular shape.
Various automated systems have been proposed using image segmentation techniques to extract the lesion part from the rice leaf, as hue part separation, then mapping with base image after RGB to HIS color space conversion [25], and K-means clustering method to highlight the diseased portion in the leaf of rice plant [26]. Recently, deep learning methods have been applied in various fields for image enhancement [27] and local feature extraction [28] and to implement ensemble learning [29]. Now, it is also been applied in agriculture to identify leaf disease and to separate the diseased portion from the plant images [30] and video frames [31] which are more accurate but have an overhead of maintaining a large amount of data to process.
On increasing epochs further, the problem of the overfitting has been encountered and the performance of the system starts decreasing because our model tries to reach zero error and started to get trained from the noisy data. Through the literature, we observed that segmentation of leaf disease is the biggest challenge due to dust particles present on the leaf, the angle of the camera, and due to similar background information. So, it is a very tough task to detect the diseased part using conventional image processing methods.
The motivation behind this work is to resolve the problem of misclassification by training a deep neural network model to separate the weed from the crop. Another motivation was to develop an automated system to increase the productivity of crops by early detection of leaf disease, which needs better segmentation followed by feature extraction.
1.1. Main Contributions
- (i)
Here, we have focused to develop a novel “multilevel deep segmentation model (MDSM)” to reduce the effect of multiple objects available in background by applying SegNet at first stage and novel RPK-means segmentation algorithm to overcome the problem of over- and undersegmentation without any human intervention
- (ii)
A new “RPK-means” algorithm is proposed, which is a combination of K-means clustering (K-means) and random path algorithm; later on, the findings of the model are compared with other similar models
- (iii)
A new algorithm named “ground truth algorithm” is proposed to create ground truth image to analyse the performance of any segmentation technique
2. Materials and Methods
2.1. Database
We have recorded videos from farmer’s land of Chhattisgarh state of India. The recording is done by using Nikon COOLPIX 20.1 megapixels, 3.0 LCD camera, having 5x zooming facility to capture the desired space from distance. We have captured the video at day time between 8 AM to 2 PM, so that we could get sufficient light from the environment for better video quality. Each video is recorded for 10 to 30 seconds for a particular disease. Video to frame conversion is performed by 2019a version MATLAB of software; to perform semantic segmentation, we installed deep learning toolbox and embedded toolbox computer vision used for further processing. Finally, dataset of 1500 images is prepared for further process. The image dataset contains 6 classes of leaves, rice blast (RB) 250 image frames, leaf scaled (LS) 300 image frames, sheath blight (SL) 200 image frames, brown spot (BS) 250 image frames, healthy leaves (HL) 250 image frames, and bacterial leaf blight (BLB) 250 image frames shown in Figure 1.
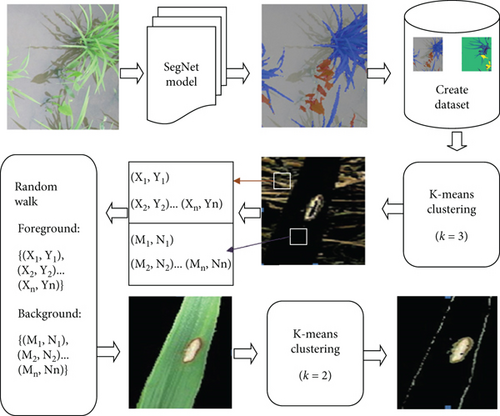
Here, (Xi, Yi) represents the coordinates of the background, and (Mi, Ni) represents the pixels on the leaf. At the upper part, k = 3 choose to generate 3 clusters of foreground, background, and lesion part of the leaf, whereas at the lower part, k = 2 choose to generate only two clusters of diseased portion and normal portion.
2.2. Weed Separation
SegNet model [17, 32] is used in many ways for segmentation; the model contains encoder layer to compress the features, decoder layer to decompress the features, and a classifier layer to classify the particular segment in the image. In this model, we have kept similar architecture for encoder and decoder layer to make sure that the size of input and output images must be same; after decoding process, output is fed to classifier to produce the probability that a particular pixel belongs to ROI (region of interest) or belongs to background class. The design of the encoder and decoder consists of a convolutional layer of window size 3 × 3 to produce the feature map, a batch normalization layer to reduce the cost of calculation, and rectified linear unit (ReLU) layer to filter out the negative values in each section. In addition, max pooling layer of size 2 × 2 window is used with encoders to perform downsampling of data. The architecture of working model is shown in Figure 2.
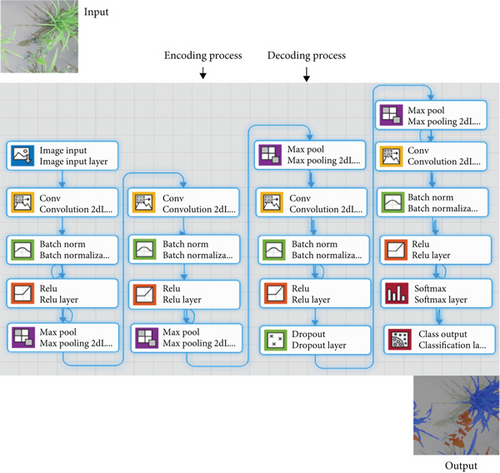
We have trained the SegNet model with the labeled data having 3 classes, i.e., rice seedling, weed, and background. The model shows significant output in terms of separation of weed form rice seedlings. Testing has been performed on our dataset and output image of SegNet model stored in another dataset for further processing. We used 2,000 images taken from different agriculture land to train the SegNet and U-Net models. The model is trained to label each pixel of the particular class, so that we can get perfect boundary box with label after segmentation.
2.3. Lesion Segmentation
The segmentation of real-time input images is a big challenge, as real-time images contain multiple overlapping leaves in the background. First, we need to perform background subtraction to separate infected leaves; at the same time, we need to extract the region of interest from the infected leaves as well. When we apply K-means clustering to segment the image into 2 clusters of foreground and background, we observed that it cannot separate the background completely, as some pixels in the background contain similar information as foreground pixels. At the same time, the random path method for segmentation removes the background portion very effectively but cannot segment the diseased portion on a leaf. Also, is has one major limitation of need of human intervention to provide coordinates of the foreground and background pixels. The proposed RPK-means algorithm is a fusion of these two algorithms which is able to not only segment the lesion properly but also needs no human intervention. We have selected images randomly from dataset to perform next level segmentation. This technique will also be able to reduce the problem of over- and undersegmentation as it selects the seed pixel more accurately because after K-means clustering foreground and background pixels, coordinates are stored in datasets d1 and d2 given by the equations in Algorithm 2. Thereafter, it is supplied to random path method to generate the final segmented image.
The task of lesion separation is performed by applying RPK-means algorithm explained below.
-
Algorithm 1: RPK-means algorithm.
-
Step 1. Initialize K=n // n = no f clusters, taking n=3 initially
-
Step 2. Select Ci for each Ki, // Ci is a center for each cluster Ki, say (x0, y0)
-
Step 3. Calculate distance D using the below equation, for each pixel (xi, yi) form Ci, such that Ci Ɛ Ki
-
-
Step 4. Merge all the (xi, yi) to cluster where D = Dmin (Where, Dmin is the minimum distance)
-
Step 5. Store (xi, yi) of each Ci for further operation.
-
Step 6. Ai=Area (Ci), // {i=1, 2,…n} A1, A2…..An represents the area of cluster C1, C2,..Cn
-
Step 7. Sort (Ascending (Ai)) // {A1, A2,.An}
-
Step 8. Select C1 and C2 such that, C1, C2 Ɛ An, An-1, Respectively,
-
For random walk we assumed that user provided coordinate positions (xi, yi) of cluster C1 and (xj, yj) of cluster C2 (Stored in step 5) as seed pixels to connect the path of foreground and background object
-
Step 9. If intensity of pixel (xi, yi) is represented by Inti , Intensity of (xj, yj) is represented by Intj, and distance between theses intensities denoted by Di, j then we can calculate the weight Wi, j of edge connecting theses two vertices as:
-
Di, j = Inti − Intj
-
-
Step 10. Finally, pixels with similar weights Wi, j can be connect to generate random path for foreground and background objects
Segmented image obtained after Algorithm 1 needs to be checked for its accuracy, so a dataset of ground truth image has been made by using the ground truth algorithm (explained below); in this algorithm, we have randomly selected 100 pixels from image to create a dataset of coordinates of pixels whose intensities are similar. The same process is applied for background also. Later on, we can use these coordinate positions to match with the coordinates of the foreground and background image obtained with different segmentation algorithms.
-
Algorithm 2: Ground truth algorithm.
-
To create Ground truth image dataset, we applied following steps:
-
1. Read Image Img(x, y)
-
2. For i = 1 to 100
-
Manually select pixels Img(x, y)and Img(p, q)such that,
-
if
-
I(x, y) = ±10 I(p, q.)
-
Where intensity of Img(x, y) is I(x, y), and intensity of Img(p, q)is I(p, q) and (x,y)and (p,q)are randomly selected pixel coordinates on image Img. Here we are taking a random value ±10 because intensity having nearby gray values has similar color, so they can be part of foreground or background.
-
Store coordinates (x, y) and (p, q) in dataset d1
-
else
-
Store coordinates (x, y) and (p, q) in dataset d2
-
end
-
end
-
Here, d1 and d2 are two datasets contains the coordinates of the pixels found in foreground and background of the output of k-means clustering.
-
3. Remove entries from d2 if any(x, y) or (p, q) ∈ d1
-
4. Now coordinates of dataset d1 and dataset d2 may use as coordinates of foreground objects and coordinates of background object.
-
5. Exit
2.4. Classification Based on Deep Learning Model
We have created a deep learning model for feature extraction and classification; we used all the convolution filters of 3 × 3 × 3 with stride [1] and “same” padding; at first stage, the number of such filters is 8; then, at second stage, it is 16, and at third stage, it is 32. For feature reduction, max pooling used 2 × 2 filter size with stride [2] and “same” padding. Fully connected layer has 6 neurons to classify 5 possible diseases along with healthy leaves, and at the end, softmax layer is used to classify bacterial blight, brown spot, leaf scaled, rice blast, and sheath blight. The arrangement of layers changed many times to analyse the effect on classification accuracy; finally, after the experiments, the model shown in Figure 3 has been selected for further processing.
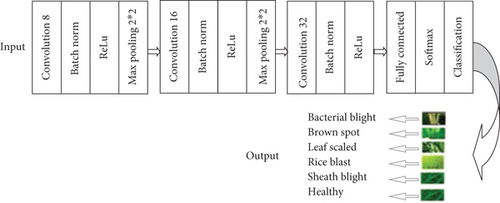
Here, we created the handmade lightweight model to classify the disease; the model has 15 layers (including the input layer) and is capable of classifying the diseases with remarkable accuracy. Other similar models like VGG-16, VGG-19, ResNet-50, and GoogleNet may produce similar accuracy of the classification but will need more time as they have more layers in their architecture.
We have trained the model with 416, 3472, and 13856 training parameters at the 1st, 2nd, and 3rd levels of convolution layer, respectively. Calculation of number of training parameters at each convolution layer is tabulated in Table 1.
| S. no. | Input layer | Filter size | No. of filters in current layer | No. of filters in previous layer | No. of parameters |
|---|---|---|---|---|---|
| 1 | Input (227,227,3) | — | — | — | — |
| 2 | Convolution 8 | (3∗3∗3) | 8 | 3 | [(3∗3∗3)∗3 + 1]∗8 = 416 |
| 3 | Convolution 16 | (3∗3∗3) | 16 | 8 | [(3∗3∗3)∗8 + 1]∗16 = 3472 |
| 4 | Convolution 32 | (3∗3∗3) | 32 | 16 | [(3∗3∗3)∗16 + 1]∗32 = 13856 |
3. Result and Discussion
In this section, the result and their analysis work are performed to check the system validation.
3.1. Performance Analysis of SegNet Model Used for Weed Separation
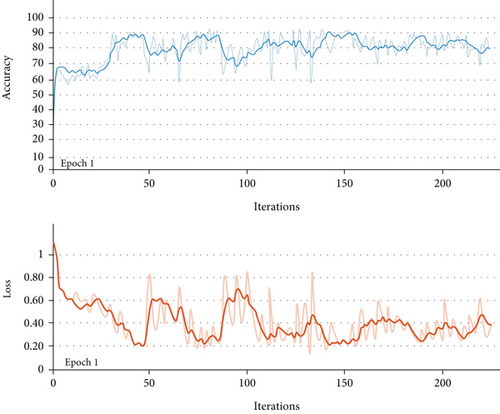
SegNet model has been used to segment the rice seedlings from the weeds; we have trained the SegNet model (architecture shown in Figure 2) for 10 epochs of 224 iterations each. The training accuracy and loss graph are shown in Figure 3. To compare the performance of the model, the same dataset is also trained for standard U-Net model [5], which is a similar model as SegNet with small changes in encoder and decoder layers.
We consider parameters no of epoch, execution time, batch accuracy, and learning rate during our experiments. We got the best results at learning rate 0.0010, number of epochs 10 with 224 iterations each, on increasing more iterations, accuracy graph get saturated after this limit, and further increase of epoch leads in problem of memory overflow and oversegmentation.
The graphical representation of output is shown in Figure 4, and the results obtained after varying parameters are tabulated in Table 2. We observed the best accuracy of 92.07% after 13th epoch; thereafter, the accuracy gets saturated.
| Epoch | Iteration | Execution elapsed (hh:mm:ss) | Accuracy | Loss |
|---|---|---|---|---|
| 1 | 1 | 00 : 00 : 01 | 38.42% | 0.7711 |
| 20 | 00 : 00 : 15 | 49.03% | 0.7142 | |
| 100 | 00 : 01:21 | 73.26% | 0.5856 | |
| 200 | 00 : 02 : 44 | 77.66% | 0.5009 | |
| 220 | 00 : 02 : 44 | 77.66% | 0.5009 | |
| 5 | 1 | 00 : 02 : 56 | 78.26% | 0.5002 |
| 20 | 00 : 28 : 17 | 91.12% | 0.2163 | |
| 100 | 00 : 29 : 26 | 91.42% | 0.2106 | |
| 200 | 00 : 31 : 04 | 91.75% | 0.2039 | |
| 220 | 00 : 31 : 25 | 91.83% | 0.2026 | |
| 10 | 1 | 01 : 10 : 47 | 91.89% | 0.2013 |
| 20 | 01 : 11 : 02 | 91.96% | 0.2001 | |
| 100 | 01 : 13 : 19 | 92.02% | 0.1987 | |
| 200 | 01 : 14 : 35 | 92.07% | 0.1976 | |
| 220 | 01 : 15 : 45 | 92.07% | 0.1976 | |
U-Net is another widely used architecture for image segmentation which has a series of convolution layers without padding to perform downsampling. There is one max pooling layer applied between the two sets of convolution filters to extract better features; the whole process is known as the encoding of data. The decoder process regenerates the original shape of the image by applying upsampling using upconvolution. The highest accuracy of standard U-Net model was observed as 87.5% with the same number of epoch as SegNet as shown in Table 3.
| S. no. | Model applied | Accuracy (in %) |
|---|---|---|
| 1 | SegNet | 92.07 |
| 2 | U-Net | 87.51 |
3.2. Performance Analysis of K-Means and RPK-Means Models Used for Segmentation
To analyse the performance of the segmentation, we have created ground truth image dataset by selecting total 100 pixels, 65 from background, and 35 from diseased portion of image (using Algorithm 2 described in Section 3.2). The performance of K-means and RPK-means algorithm is shown in Figure 5, where blue pixels represent the pixels recognized as pixel at diseased portion and red pixels represents the pixels detected as background of the image.
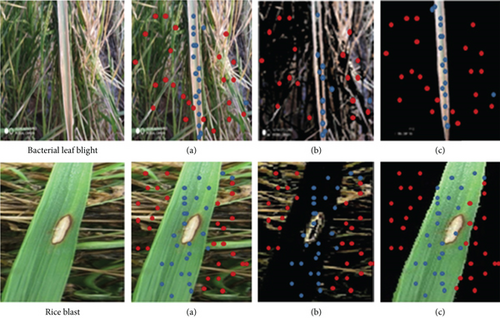
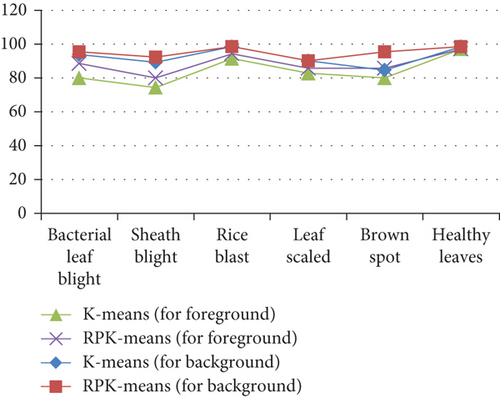
Form Tables 4 and 5, we observed that segmentation accuracy of RPK-means algorithm is 2%-6% more than the traditional K-means clustering. That is because of in case of centroid in outliers makes their own cluster instead of get avoided. RPK-means clustering resolves this problem by selecting automated centroid based on similarity of pixel intensities. Yue et al. [32] proposed similar SegNet method for segmentation of plant disease, but their accuracy is limited up to 79.12%. Also, misclassification error of our model is relatively lower than the model proposed by Liao et al. [1].
| Type of disease | K-means clustering | RPK-means clustering | Accuracy | |||
|---|---|---|---|---|---|---|
| No. of pixels matched in foreground | No. of pixels matched in background | No. of pixels matched in foreground | No. of pixels matched in background | K-means | RPK-means | |
| Bacterial leaf blight | 28 | 61 | 31 | 62 | 89 | 93 |
| Sheath blight | 26 | 58 | 28 | 60 | 84 | 88 |
| Rice blast | 32 | 64 | 33 | 65 | 96 | 98 |
| Leaf scaled | 29 | 59 | 30 | 59 | 88 | 89 |
| Brown spot | 28 | 55 | 30 | 62 | 83 | 92 |
| Healthy leaves | 34 | 65 | 34 | 65 | 99 | 99 |
| Type of disease | K-means clustering | RPK-means clustering | ||
|---|---|---|---|---|
| Pixels matched with foreground (in %) | Pixels matched with background (in %) | Pixels matched with foreground (in %) | Pixels matched with background (in %) | |
| Bacterial leaf blight | 80.000 | 93.800 | 88.500 | 95.402 |
| Sheath blight | 74.300 | 89.201 | 80.000 | 92.301 |
| Rice blast | 91.400 | 98.500 | 94.312 | 98.512 |
| Leaf scaled | 82.802 | 90.100 | 85.701 | 90.102 |
| Brown spot | 80.210 | 84.600 | 85.701 | 95.401 |
| Healthy leaves | 97.102 | 98.460 | 97.101 | 98.460 |
The accuracy achieved by different classifiers is presented in Figure 6. Here, we observed that RPK-means algorithm is able to identify the background of the diseased leaf with accuracy in the range of 80% to 97% and also able to detect the lesion portion with accuracy more than 90% to 98.5%, as shown in Figure 6. At the same time for convention K-means clustering, the ability for background separation ranges from 84% to 97%, and for lesion portion detection, its range is 89%-98.5%.
3.3. Performance Analysis of CNN Models
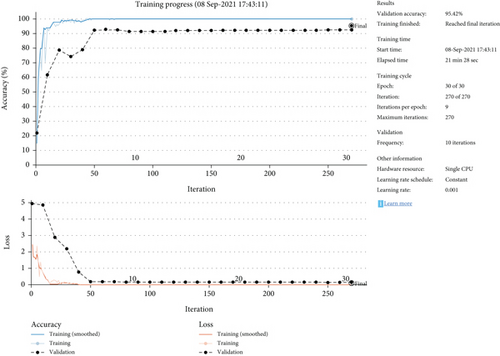
To analyse the effect of segmentation on classification, we have created different CNN models starting from 11 layers. First, training and validation (90-10 ratio) are performed on 11 layers model for 15,20,25 and 30 epochs; the validation accuracy of 90.1%, 91.94%, 93.6%, and 94.58% is obtained, respectively, as shown in above graph. Furthermore, if we increase the number of epochs, then we found the problem of overfitting. To build this 11-layer model, after input layer, we used two sets of convolutions, batch normalization, ReLU, and max pooling layer along with fully connected, softmax, and classification layers at the end. Further, 8 convolution filters are used at first layer to extract the outer features and number of filters doubled in subsequent layers to extract deeper features. Sampling is performed after each convolution layer to reduce the features.
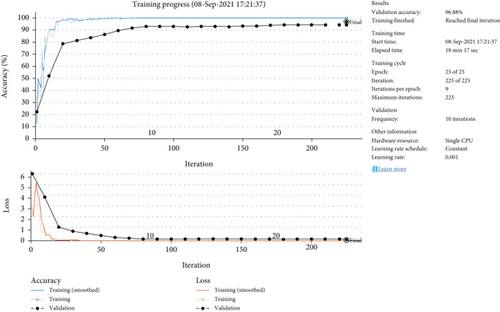
In order to increase the accuracy of classification, the number of layers increased to 15, by adding one more set of convolutions, batch normalization, ReLU, and max pooling layers in the above 11-layer model. On this new model, experiments are performed by varying the epochs from 15, 20, 25 and observed the accuracy of 92.5%, 93.54%, and 96.88%, respectively; on increasing epochs further, the problem of overfitting has been encountered and performance of system starts decreasing as increasing the number of epochs of our model tries to reach towards zero error and started get trained from the noisy data.
From Table 6, we observed that classification accuracy of the handmade CNN (HCNN) outperforms well the RPK-means clustering and increases the accuracy to 1-2% rather than with K-means clustering. At the same time, as RPK-means clustering has an additional step of random path selection; it needs slightly more time than the traditional K-means clustering. The experiment performs on fixed learning of 0.001 for different epochs ranging from 15 to 30. We used slow learning to achieve more training accuracy and to avoid the problem of overfitting.
| Layers | Epochs | Accuracy | Execution time | ||
|---|---|---|---|---|---|
| K-means | RPK-means | K-means | RPK-means | ||
| 11 | 15 | 90.01% | 90.02% | 9 minutes, 20 seconds | 9 minutes, 42 seconds |
| 11 | 20 | 91.94% | 92.30% | 12 minutes,55 seconds | 13 minutes,10 seconds |
| 11 | 25 | 93.60% | 94.34% | 16 minutes,10 seconds | 16 minutes, 50 seconds |
| 11 | 30 | 94.58% | 95.24% | 19 minutes, 15 seconds | 20 minutes,05 seconds |
| 15 | 15 | 92.50% | 93.20% | 9 minutes, 20 seconds | 9 minutes, 45 seconds |
| 15 | 20 | 93.54% | 94.25% | 12 minutes, 55 seconds | 13 minutes, 34 seconds |
| 15 | 25 | 95.42% | 96.88% | 16 minutes, 10 seconds | 16 minutes, 52 seconds |
| 15 | 30 | 94.80% | 95.35% | 19 minutes, 15 seconds | 19 minutes, 58 seconds |
In Figures 7 and 8, upper half shows the increase in training accuracy (blue color line) after each iteration and validation accuracy (black color line) following the boundary of the training curve. The lower half of the Figure 7 shows the decrease in training loss (red color line) and validation loss merging with training loss after 225 iterations. From Figures 7 and 8, we observed that accuracy of HCNN model is slightly better when being applied on output obtained from RPK-means algorithm, the highest accuracy obtained by classifier is 95.42% for K-means processed image, and it increases by 1-2% while being processed on RPK-means processed images.
4. Conclusions
To solve the problem of misleading treatments that arise due to the wrong identification of disease that further leads to huge losses in crop production, a novel RPK-means clustering has been proposed along with SegNet segmentation at preprocessing. Through extensive experiments, it has been observed that the proposed approach obtains a decent performance in terms of standard evaluation measures and is proficient to solve the current problem of crop disease which can also be opted to make a better vegetable disease identification system. To analyse the effect of segmentation techniques, we used a handmade CNN model (HCNN) quantitatively; accuracy of the model is 96.88%, for RPK-means preprocessed images; and it is 95.42% for K-means processed image. While compiling models used for weed separation, SegNet model outperforms the UNet model by leading about 3-4% better accuracy. Further, it has been assured that the proposed approach outperforms the recent state-of-the-art techniques in the presented domain. In future directions, the behavior of the approach will be experimented with and undergone through evolutionary techniques.
Conflicts of Interest
The authors declares that they have no known competing financial or personal relationships that could be viewed as influencing the work reported in this paper.
Open Research
Data Availability
The data used to support the findings of this study are available from the corresponding author upon request.


