A Dynamic Source Tracing Method for Food Supply Chain Quality and Safety Based on Big Data
Abstract
The data of food quality tracing information have a few features, such as wide coverage range, many circulation links, complex data sources, low authenticity, and difficult information sharing. The continuous development of big data technology provides infinite possibilities for the construction of food quality source tracing systems. Currently, there are many studies on the application of food quality source tracing systems; however, most of them are in the field of food quality databases, and few have concerned about its application in the field of big data. Therefore, to fill in this research gap, this paper aimed to study a dynamic source tracing method for food supply chain quality and safety based on big data. At first, this paper summarized the variables of food supply chain quality and safety, constructed a Petri net model and a Bayesian network model for food quality prediction and source tracing, and realized the prediction of food quality features. Then, this paper applied two data analysis and processing methods—the density-based clustering algorithm and the cosine similarity algorithm—to preliminarily process the collected quality tracing information of each link in the food supply chain and analyzed the influencing factors of food quality. Finally, experimental results proved the effectiveness of the constructed model. Relying on the real-timeliness and authenticity of big data, this paper guarantees the credibility of the traceable information in the tracking process and improves the accuracy through real-time stream processing of the updated data, providing unlimited possibilities for the comprehensive tracking of food sources.
1. Introduction
On average, about 62.3 food quality and safety incidents occur in China per day, the overall situation is very serious, and more than 3/4 of the incidents occurring in the production and processing links are caused by human factors [1–10]. In view of the frequent food quality and safety problems and for the purpose of improving food quality and safety, it is necessary to build a food quality and safety source tracing regulatory system to track the information of all circulation links in the food industry, including production, processing, transportation, and sales [11–15]. Since the collection of food quality source tracing information requires the cooperation of all participants in the food supply chain, it has the characteristics of a wide coverage range, many circulation links, complex data sources, low authenticity, and difficult information sharing [15–22]. Today's smart energy manufacturing relies on big data, cloud computing, and the Internet of things. By combining big data with food, it is possible to grasp the basic laws of food production and improve the resource utilization efficiency and production efficiency of food production. Through data analysis, processing, data mining, and decision-making, the combination between big data and food would lower the trial-and-error cost in the development of the modern food industry, making the final decision more accurate. In this way, it is possible to reduce the costs and enhance the profits. The continuous development of big data technology provides infinite possibilities for the construction of food quality source tracing systems.
As intelligent technologies such as the Internet of Things (IoT) and big data have emerged and been widely applied, many researchers have done jobs to combine these emerging technologies with food quality source tracing systems. For example, Hao et al. [23] proposed a traceability scheme combining reverse search and recursive algorithm based on the theory of blockchain technology and designed and implemented a food safety tracing system. Then, they used experimental results to prove that the proposed scheme is more effective than the traditional source tracing models. In terms of epidemic prevention and control, food safety monitoring, data analysis, and food safety traceability are even more important. Studies on food safety source tracing systems based on big data, artificial intelligence (AI), and IoT provide ideas and methods for solving the problems of low reliability and difficult data storage during the application of traditional source tracing systems. For example, Zheng et al. [24] took rice as an example and proposed a food safety source tracing system based on RFID + QR code technology and IoT big data storage technology; by analyzing system requirements, the proposed system uses RFID and big data storage functions to obtain information in the food production process and then realizes the whole-process tracking of food production information through the designed dynamic query platform and mobile terminals. Balamurugan et al. [25] proposed an efficient food traceability management technology that makes use of the IoT. Then, they deduced a solution for data transmission and used the improved cycle data and the improved Petri network model to perform food source tracing. Singh and Jenamani [26] proposed a Casandra-based NoSQL database suitable for storing traceability data. Then, in order to test the performance of the database, they designed a test platform in the laboratory and simulated the operation of the supply chain of the Indian public distribution system to generate data. Food is one of the most important elements in international trade. Bordel et al. [27] proposed a food traceability system for international food trade based on the blockchain network and RFID tags, the system adopts a REST interface, NoSQL database, and JavaScript code. It realizes a distributed solution that collects, tags, and stores reliable information about food flows.
The review of the above literature shows that many scholars at home and abroad have studied food quality tracking methods. However, there are problems with the consistency and universality of the data storage for the tracking system. Besides, few scholars have studied food quality tracing in the field of big data. Therefore, this paper attempts to research a dynamic source tracing method for food supply chain quality and safety based on big data. The purpose is to explore the key technologies of the product quality tracing system in the food supply chain, establish a quality tracing system suitable for various types of foods, and improve consumer satisfaction and the core competitiveness of enterprises.
The main contents of this paper (1) summarize the variables of food quality and safety source tracing; (2) introduce the food quality source tracing mode; (3) model the food production process based on Petri net; (4) build a Bayesian network model for food quality prediction and source tracing to realize the prediction of food quality features; (5) give the framework of the food quality source tracing system; (6) adopt two data analysis and processing methods, the density-based clustering algorithm and the cosine similarity algorithm, to preliminarily process the collected quality tracing information of each link in the food supply chain; (7) give the technical route map of food quality source tracing, and analyze the influencing factors of food quality; (8) use experimental results to prove the effectiveness of the constructed model. Relying on the real-timeliness and authenticity of big data, this paper guarantees the credibility of the traceable information in the tracking process and improves the accuracy through real-time stream processing of the updated data, providing unlimited possibilities for the comprehensive tracking of food sources.
2. Construction of the Food Quality Source Tracing Model
Food production has many processing procedures, and there are many reasons for the causing quality and safety problems; therefore, the quality tracing information generated during the production and circulation process has many types and is transmitted and accumulated between the various supply chain links.
In the developed world, food safety tracing systems have been established to supervise the whole process of food production, from the planting and breeding of animals and plants (sources of food production) to the detailed records of production, processing, and sales. The purpose is to monitor and manage all the links for the food from the source to consumers, such as to ensure the safety and quality of the food on the tables. Any food in the market must carry a label of the required information. Besides, the production and processing records of the food must be traceable. Overall, countries around the world are very concerned with the safe development of agricultural products.
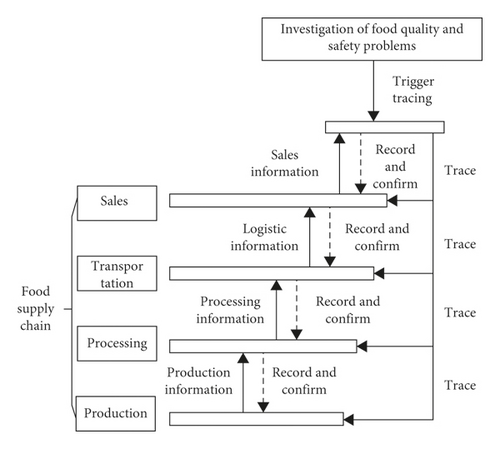
Figure 1 shows a diagram of the food quality source tracing mode. According to the figure, when food of a certain batch output from the supply chain has quality problems and its quality needs to be analyzed, the data of actual production workshop information, food quality feature information, and production process information collected from the production process of this food batch, are analyzed to find the reasons that cause the quality problems of this food batch.
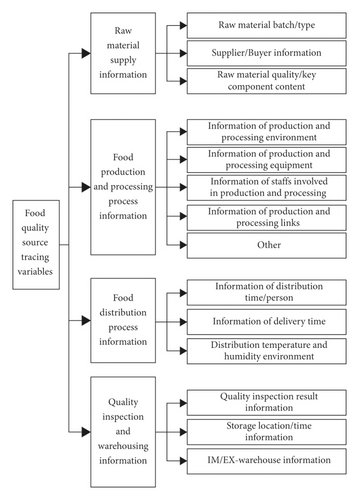
During the multistage food processing, the three key links that are most closely related to quality are: raw material supply, production, and circulation. Common problems include chemical contamination, shelf-life problem, excessive harmful ingredients, and poor production sanitation conditions, etc. Figure 2 gives a summary of food quality and safety source tracing variables.
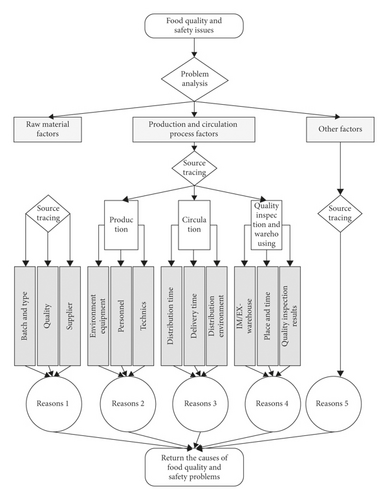
Starting from the perspectives of food production process and food quality source tracing, at first, this paper constructed a model of the food production process based on Petri net. Figure 3 shows the flow of food quality source tracing. A Petri net was used to describe the relationship between quality tracing activities and activity links in the above figure, and it can be expressed as: M=(O, D, G), O = {o1, o2, o3, o4, o5, o6, o7, o8, o9, o10, o11, o12}, D = {d1, d2, d3, d4, d5, d6, d7}, and G = {(o0, d0), (d0, o1), (d0, o3), (d0, o10), (o1, d1), (o3, d2), (o10, d6), (d1, o2), (d2, o4), (d2, o6), (d2, o8), (d5, o9), (o5, d7), (o7, d7), (o9, d7), (d7, o12), (o2, d7), (o4, d3), (o6, d4), (o8, d5), (o11, d7), (d3, o5), (d4, o7), (o4, d4)}.
The Petri net can be expressed rigorously in math and described visually with graphs. With rich system description means and system behavior analysis technologies, the Petri net provides a solid conceptual foundation for computer science.
For the food quality source tracing model based on Petri net, its food quality evaluation index system has the characteristics of bounded and accessible;, therefore, aiming at the accessibility of specific food source tracing information, this paper verified the effectiveness of the constructed model.
After training the constructed network model and completing the calculation of conditional probability, the tabular expression form of the model could be obtained.
3. The Processing of Food Quality Source Tracing Information Based on Big Data
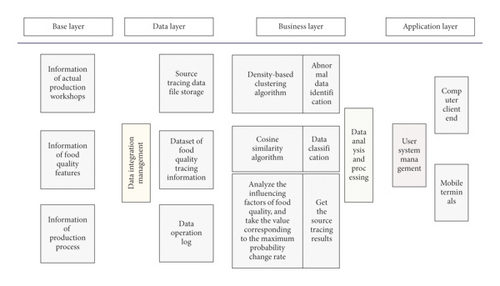
Figure 4 shows the framework of food quality source tracing system, which is consisted of base layer, data layer, business layer, and application layer. The base layer includes the information of the actual production workshops, the information of food quality features, and the information of production process. The data layer supports data integration management, including source tracing data file storage, dataset of food quality tracing information, and data operation log. The business layer is mainly responsible for data analysis and processing, i.e., identifying abnormal data by density-based clustering algorithm, classifying data by cosine similarity algorithm, getting the source tracing results by analyzing the influencing factors of food quality, and taking the value corresponding to the maximum probability change rate.
Because the quality tracing information generated during production and circulation process has various types and is transmitted and accumulated between various supply chain links, the quality description variables have multiple correlations. In order to analyze the influencing factors of food quality, it is necessary to preliminarily process the collected quality tracing information of each link in the food supply chain, this paper mainly adopted two data processing methods: the density-based clustering algorithm and the cosine similarity algorithm.
3.1. Data Processing
If core variables ai and aj belong to the same neighborhood, then, it is said that aj is directly density-reachable from ai.
If there is variable al, and it satisfies that variables ai and aj are both directly density-reachable from al, then, their called that ai and aj are density-connected.
3.2. Obtaining the Source Tracing Results
The source tracing of food quality is actually to determine which type of quality and safety problem within the range of causes [a1, a2,…, al,…, am] when wl occurs.
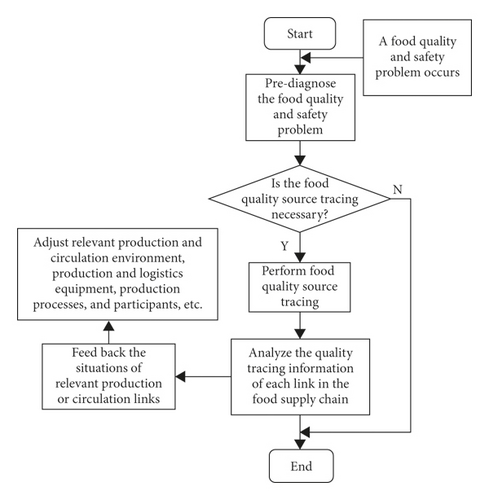
Figure 5 shows the technical route of food quality source tracing. The analysis of the influencing factors of food quality includes the following steps:
Step 1. Analyze food quality information
Separately, quantify each quality description variable, determine the main quality evaluation indicators of the food production or distribution process, and count the quality evaluation parameters wl of each link in the production or distribution process. Assuming W represents the total quality evaluation parameter of food quality source tracing and θl represents the coefficient of influence of the quality information of each link on the total quality information, then, there is:
According to the above formula, the total quality evaluation indicator of food quality source tracing is equal to the weighted sum of the quality indexes of each production and circulation link.
Step 2. Perform hierarchical index analysis on each production and circulation link
Assuming Ewl=(e1l, e2l, e3l, e4l,…, ell) represents the set of food quality information flow of link l, l= (1,2,3,…, m) and βl represents the weight of each quality information flow ell to the quality evaluation index wl of link l, then there is:
According to above formula, the food quality evaluation index of the independent production or circulation link is equal to the weighted sum of each quality index of this link.
Step 3. Analyze the direct influence relationship of adjacent production or circulation links
Assuming μi,i+1 represents the correlation coefficient of the influence of a previous link on the latter link, if two adjacent links are correlated, then, there is 0<μi, i+1≤1, if two adjacent links are not correlated, then, there is μi, i+1 = 0. The following formula gives the expression of the food quality evaluation index when two adjacent links have an influence relationship:
According to above formula, when there’s an influence relationship between two adjacent production and circulation links, the food quality evaluation index is equal to the quantitative value of the influence of the link and its coupling link plus the weighted sum of each quality index of the link. According to the data features of quality description variables, discretize the continuous variable ai to generate several state variables ZT+, ZT−, etc. The data involved in the process of food production and distribution have two types of variables: the discrete type, and the continuous type. The following formula gives the conversion formulas for continuous variables and discrete variables:
Food quality source tracing is to find out the cause according to the features of the quality and safety problem when a batch of food has a quality and safety problem. Under the condition that the state variable probabilities related to the features of the quality and safety problem were known, this paper sorted the state variable probabilities, obtained the reason of the food quality and safety problem corresponding to the maximum probability change rate after the constructed network was updated, and then took the reason as the cause of the current food quality and safety problem.
In this paper, the state probability of quality authenticity of node variables in the output layer of the network was studied as the feature of the quality and safety problem changed from high = 100% to low = 100%, and the following formula gives the calculation of probability change:
4. Analysis of Experimental Results
Figure 6 and 7, respectively, show the execution time distribution of the map phase and the reduce phase of big data analysis. According to Figure 6, with the increase of the scale of quality tracing information data generated in the production and circulation process, the execution time of the map phase increased accordingly, but the increment was limited, which is mainly because the source tracing information was not stored in this phase. By comparing Figures 6 and 7, we can find that with the increase of the scale of quality tracing information data generated in the production and circulation process, the execution time of the reduce phase increased with it, and the generation time of source tracing results was relatively long, which is because the source tracing information had been stored in this phase; that is, the source tracing information was written into the HDFS file. Figure 8 shows the percentage of source tracing results generation time in the entire execution time. According to the figure, with the increase of the scale of a quality tracing information data generated in the production and circulation process, the percentage of the generation time of source tracing results in the entire execution time was controlled between 28% and 51%. Therefore, according to the analysis of the above experimental results, the food quality source tracing method adopted in modeling had little impact on the performance of the bottom execution framework of big data analysis.
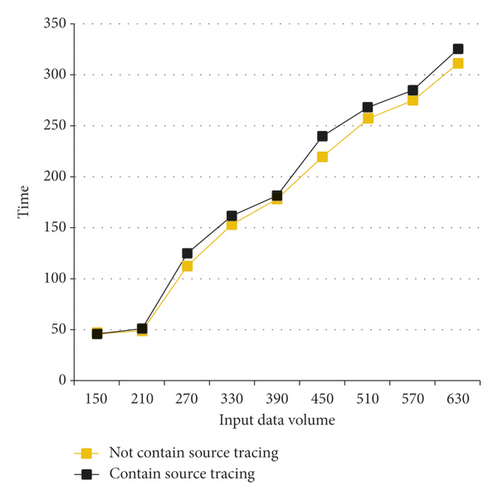
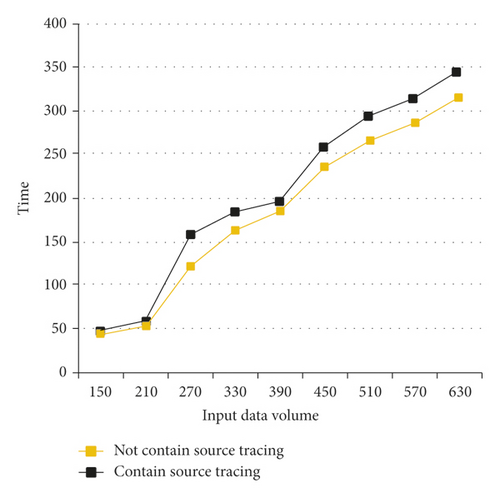
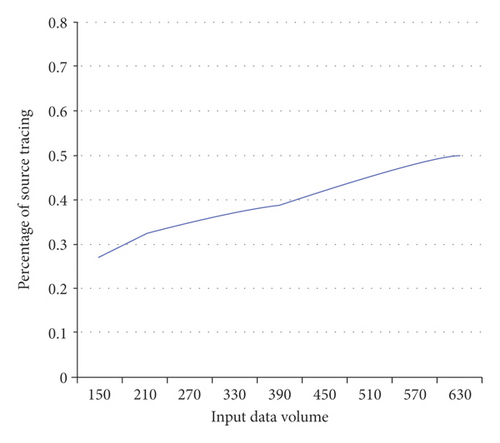
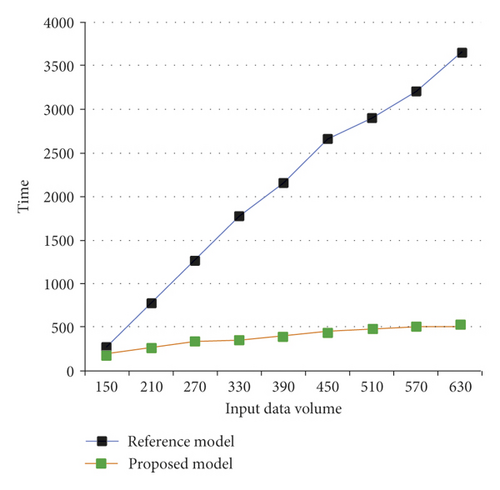
Figure 9 shows the comparison results of the distribution of source tracing results generation time of different models, and the reference model is a fine-grained source tracing model, the word count model. According to Figure 9, with the increase of the scale of quality tracing information data, the generation time of source tracing results of the two models grew continuously, but there’s a big difference in the growth rate. Based on these results, it can be seen that the source tracing efficiency of the proposed model was better than that of the reference model, and its performance was even better as the input data volume increased.
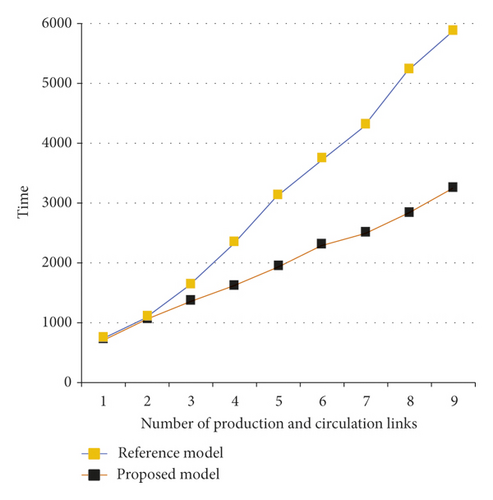
According to Figure 10, when the scale of quality tracing information data generated in the production and circulation process is fixed, with the increase in the number of production and circulation links, the source tracing results generation time of the reference model and the proposed model grew continuously, but at different rates. According to the figure, the generation time of source tracing result of the proposed model grew approximately linearly. This is because the proposed model’s retrieval scales of the source tracing information of each link were basically the same, so the source tracing results generation time grew linearly with the number of production and circulation links. However, for the reference model, with the increase of the number of production and circulation links, the source tracing results generation time grew rapidly. The model is a many-to-one model, and its retrieval scales multiplied, resulting in the source tracing results generation time grew faster and the performance was lower.
In this paper, the quality tracing information data were first processed into Netica software format data, then, a Bayesian network model was constructed, and the structure and parameter learning was carried out. After that, the probability of the proposed model was reasoned to evaluate the effectiveness of the constructed network in food quality and safety source tracing. After completing the analysis as the feature of quality and safety problems changed from high = 100% to low = 100%, the calculation results of the state probability of quality authenticity of node variables in the output layer of the network after the automatic update are shown in Table 1. Through observation, it was found that when the food safety and quality feature changed from high = 100% to low = 100%, the state probabilities corresponding to the four variables of raw material supply information, production and processing process information, circulation process information, and quality inspection and storage information all changed; wherein the change of the probability of production and processing process information was the largest. Therefore, this paper judged that the reason for this type of food quality change was due to the processing environment and the processing technique.
| Raw material supply information (%) | Production and processing process information (%) | Circulation process information (%) | Quality inspection and warehousing information (%) | |
|---|---|---|---|---|
| Δo = ΔoINC + ΔoDEC/2 | 15.2 | 27.2 | 8.5 | 6.8 |
Next, for the four variables of raw material supply information, production and processing process information, circulation process information, and quality inspection and storage information, the probability changes of the corresponding quality evaluation criteria were calculated, and the results are shown in Table 2. The specific variables include raw material batch/type 1, supplier/buyer information 2, raw material quality/key component content 3, production and processing environment information 4, production and processing equipment information 5, production and processing personnel information 6, production and processing link information 7, distribution time/person and other information 8, delivery time information 9, distribution temperature and humidity environment 10, quality inspection result information 11, storage location/time information 12, IM/EX-warehouse information 13, and other information 14.
| Serial number of variables | 1 | 2 | 3 | 4 | 5 | 6 | 7 |
|---|---|---|---|---|---|---|---|
| Δo = ΔoINC + ΔoDEC/2 | 6.8% | 6.3% | 6.9% | 3.5% | 4.6% | 4.8% | 6.2% |
| Serial number of variables | 8 | 9 | 10 | 11 | 12 | 13 | 14 |
| Δo = ΔoINC + ΔoDEC/2 | 6.4% | 0.2% | 6.7% | 5.3% | 5.9% | 5.5% | 3.6% |
According to the table, when the food safety quality changed from high = 100% to low = 100%, the probability change of the raw material quality/key component content was the largest, so this paper judged that this food quality change was caused by the raw material quality/key component content variable in the raw material supply information. Therefore, the link in which the food quality and safety problems occurred could be preliminarily located, and the problem-tracing personnel can verify the accuracy of the judgements made by the model by checking the value of raw material quality/key component content in the raw material supply information.
The probability change of the delivery time information in the table is 0.2, which means that the delivery time information has little impact on food quality features. Because in the food production and distribution process, the delivery time information is checked repeatedly before distribution and the food quality has a relatively long shelf life, a short-time delivery delay will not cause food quality defects, which is consistent with the actual production situations of enterprises.
5. Conclusion
This paper researched a dynamic source tracing method of food supply chain quality and safety based on big data. At first, it summarized the variables of food quality and safety source tracing, constructed a Petri net model and a Bayesian network model for food quality prediction and source tracing, and realized the prediction of food quality features. Then, this paper applied two data analysis and processing methods—the density-based clustering algorithm and the cosine similarity algorithm—to preliminarily process the collected quality tracing information of each link in the food supply chain and analyzed the influencing factors of food quality. The experimental results showed the distribution of the execution time of the map phase and reduce phase in big data analysis and the percentage of source tracing results generation time in the entire execution time, which verified that the food quality source tracing method adopted by the proposed model has little impact on the performance of the bottom execution framework of big data analysis. Moreover, this paper also gave the distribution of source tracing results generation time and the distribution of tracing time under different numbers of production and circulation links, and the results proved that the proposed model was more efficient in generating source tracing results and its performance was higher. At last, the paper also gave the probability changes of the variables of food quality and safety source tracing, the calculation results listed in the table were in line with the actual production situations of enterprises, which verified the accuracy of the judgment made by the model.
Conflicts of Interest
The authors declare that they have no conflicts of interest.
Acknowledgments
This research was supported by the Project of Philosophy and Social Science Research in Heilongjiang Province (Grant no. 19JYE268).
Open Research
Data Availability
The data used to support the findings of this study are available from the corresponding author upon request.


