[Retracted] Multiparty Coordinated Logistics Distribution Route Optimization Based on Data Analysis and Intelligent Algorithm
Abstract
Aiming at the shortcomings of traditional genetic algorithms such as premature and insufficient local search ability, a hybrid genetic algorithm combining k-means algorithm and cluster analysis to improve genetic algorithm is proposed. Among them, the selection operation adopts the tournament selection strategy of the elite retention model, the crossover operation adopts the double cut-point crossover, and the variation operator introduces the k-exchange variation operation to ensure the evolution of individuals from generation to generation. Through the selection, crossover, and variation operations, the objective function is minimized, the vehicle travel distance is greatly reduced, and the distribution route is optimized.
1. Introduction
Vehicle path optimization is the central aspect of logistics distribution, which is essential [1]. The traveling salesman problem (TSP) problem is a classical problem of finding the optimal solution from the set of feasible solutions to a combinatorial problem and is an easy to describe but difficult to handle NP problem [2, 3]. With the increase of the number of towns n, the number of paths may grow exponentially, and it is difficult to find the optimal solution to satisfy the condition using the existing conditions [4, 5].
The socialized division of labor is increasingly refined, making supply and production, production and consumption in time and space contradictions, promote logistics in social production and life play a more and more important role, logistics operation level is related to the level of a country’s economic development, governments are vigorously developing their own logistics. In modern logistics, transportation and distribution are an important link directly connected with consumers, which reflects the core competitiveness of enterprises. How to optimize transportation routes has always been a hot issue for scholars, consulting institutions, and enterprises. By optimizing the transportation path, we can improve the operation efficiency of the enterprise, reduce the transportation cost, and realize the scientific logistics. Based on the relevant logistics theory, this paper takes Hainan Xinwei Logistics Company as an example to analyze the problems encountered by enterprises in the transportation path and puts forward the optimal solutions.
At present, the optimization method is mainly used to solve the path problem for logistics distribution center links, and the construction method is the first one proposed to solve the logistics distribution path problem, which is efficient, but the deviation of the solution from the optimal solution is too far [6, 7]. Xie et al., Katoch et al., Vidal et al., Pizzuti, and Arabali et al. proposed to add the points that are not on the current path at minimum cost to form a relatively good initial path and then finally use an improved algorithm to process the initial path to improve the quality of the solution as much as possible [8–12].
2. Mathematical Model of Logistics Distribution Path Optimization
2.1. Problem Description
The scheduling problem of logistics distribution vehicles is described as follows: there is one and only one vehicle to make one delivery and return to the distribution center after completing the delivery task [13–16]. Therefore, the key to the logistics distribution path problem is optimizing the distribution route and allocating the driving route of vehicles so that the total transportation distance is the shortest [17].
2.2. Modeling
Hybrid genetic algorithm is to mix genetic algorithm with other algorithms to take advantage of each other and complement each other’s shortcomings. For example, the combination of genetic algorithm and simulated annealing algorithm is to combine the global search ability of genetic algorithm with the local search ability of simulated annealing algorithm to form a powerful algorithm.
From the above problem description and assumptions, a mathematical model of logistics distribution route optimization is established. The model takes the minimum transportation distance as the objective function and determines the optimal vehicle distribution route to solve the mathematical model, whose objective function and constraints are shown below:
Constraints:
The D indicates the objective function to calculate the shortest travelable path; k indicates that the number of reserved vehicles is calculated; and indicate that each customer is visited once and only once; L indicates that the distance of a vehicle in the distribution process cannot exceed its specified distance L; xij is the decision variable of the model.
3. Hybrid Genetic Algorithm for Optimizing Logistics Distribution Path
Since the traditional genetic algorithm has the shortcomings of insufficient local search ability and premature maturity, the K-means algorithm is firstly used to cluster the location coordinates of customers to obtain the local distribution center and the customer points within its distribution range, and then the logistics path is optimized by using the selection, crossover, and variation operations of the improved genetic algorithm.
3.1. K-Means Algorithm
The criterion function attempts to make the generated result clusters as compact and independent as possible.
- (1)
Select k objects arbitrarily and then take each data object as the cluster center
- (2)
Divide the remaining data objects into the cluster center closest to each data object itself, according to the following equation:
(8)where Ca, Cb are two clusters which contain m and h elements, respectively. Let element x ∈ Ca, y ∈ Cb, the distance between these two elements is denoted by the intercluster distance and is noted as D(Ca, Cb). - (3)
Recalculate the mean value of the data objects in each cluster center to get a new cluster center, and the mean value is calculated by the formula:
(9)where Ci is a cluster and x is a data object within Ci, i.e., x ∈ C; nk is the data object in the kth cluster.
Repeat steps (2) to (3) until the end when the data objects in each cluster no longer change or the objective function converges.
3.2. Improved Genetic Algorithm
The sequential number encoding is used here. Suppose a sequence (1, 2, 3, 4, 7, 6, 5, 9, 8) is randomly generated and let the generated breakpoint matrix be (2, 5, 7), then first add “0” to the 2nd, 5th, and 7th position of the sequence, the sequence becomes (1, 2, 0, 3, 4, 7, 0, 6, 5, 0, 9, 8), and then add “0” to the first and last position of the new sequence, the chromosome becomes (0, 1, 2, 0, 3, 4, 0, 6, 5, 0, 9, 8). Then add “0” at the end of the new sequence, the chromosome will be (0, 1, 2, 0, 3, 4, 7, 0, 6, 5, 0, 9, 8, 0). Where 0 denotes the distribution center and the serial number denotes the customer number, this sequence indicates that the distribution scheme consists of 4 routes. The route of vehicle 1 is (0, 1, 2, 0), which returns to the distribution center after passing the customer, and is subpath 1; similarly, the route of vehicle 2 is (0, 3, 4, 7, 0) and is subpath 2; the route of vehicle 3 is (0, 6, 5, 0) and is subpath 3; the route of vehicle 4 is (0, 9, 8, 0) and is subpath 4, as shown in Figure 1. Figure 1 gives a visual representation of the sub-paths and the order of clients. This chromosome structure can express the solution space of the vehicle path problem very clearly.

The population size M, i.e., the initial population, is reached all the way through the process of coded repetition chromosome generation.
The new population resulting from the selection operation, in addition to the first chromosome, the other N-1 chromosomes have to be cross-paired according to the crossover probability pc (pc taking values between 0 and 1). In traditional genetic algorithms, single-point crossover is used, which makes many chromosomes exchange between the two parents and sometimes destroys the good chromosomes in the population during the exchange process; compared with single-point crossover, few chromosomes are exchanged between the two parents, which helps to retain the good chromosomes. For example, the following two individuals were crossed using the double cut point method, with the cut point at position 2 and position 5, respectively (Table 1).
| ↓Cut point 1 | ↓Cut point 2 | ||
|---|---|---|---|
| Chromosomes 1 : 1 | 0 | 7 6 9 | 8 3 2 |
| Chromosomes 2 : 0 | 1 | 9 8 7 | 4 2 3 |
| Then, after the multipoint crossover, the two chromosome individuals become: | |||
| Chromosomes 1 : 1 | 0 | 9 6 7 | 8 3 2 |
| Chromosomes 2 : 0 | 1 | 7 8 9 | 4 2 3 |
| That is, only the part between the two cut points is exchanged. | |||
4. Optimization Scheme of Logistics Distribution Path
4.1. Basic Process of Hybrid Genetic Algorithm
Figure 2 shows the flow of the combination of clustering technique and genetic algorithm, because it is important to consider the path optimization problem characteristics comprehensively and also to ensure the feasibility of the compiled code of the solution and chromosome, so how to realize the encoding is its important factor in the process of distribution path optimization. And because the commonly used binary compiled code method has long strings and cannot provide a comprehensive description of the problem properties, this paper uses the natural number encoding method to implement [18–20].
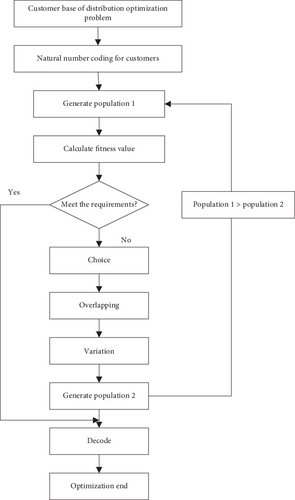
In addition, whether the population size selection is reasonable is the concept of reasonable use of genetic algorithm, if the size of the population is large, then the search time will be longer, if the size of the population is small, then it will fall into the local optimal solution. So, first of all, we have to realize the sorting of distribution vehicles and customers and the statistics of customer demand.
4.2. Optimization of Logistics Distribution Path
First, the coding in the logistics distribution path is determined. In order to achieve a simple description of the most problematic logistics distribution path, this paper uses a direct ordering coding method. For example, if N customers are represented using natural numbers from 1 to n without repetition, then, these arrangements belong to individuals, and individuals are incorporated in the vehicle distribution path according to the constraints of the mathematical model of logistics distribution path optimization [21–24].
Second, the determination of the initial group of logistics distribution path is realized. The arrangement of nonrepeating natural numbers from 1 to n can be generated according to a random way. Assuming that the size of such a logistics distribution path population is denoted k, then k individuals are generated, which is the initial population of the logistics distribution path.
The selection of the best individual for the distribution path of the logistics system is realized. The K individuals of the group can be ranked according to their fitness, and the first individual is extracted according to the method from the largest to the smallest, so that it can be the best individual, it is copied to the next one, the sum of the fitness of the individuals of the previous generation group is calculated, and the ratio of the fitness of each individual to the total fitness is used as the probability of being selected, so that the best individual of the logistics distribution path can be effectively determined [23–27].
5. Simulation of the Algorithm
5.1. Arrangement of the Algorithm Simulation
In order to be able to improve the results, it is necessary to realize the settings of different values of the parameters in it. Table 1 shows the levels and factors of the economical genetic algorithm.
According to the situation in Table 2, ten simulation experiments are implemented to realize the simulation of the average shortest path, and Table 3 shows the average shortest path results of ten simulation experiments.
| Level | Population size | Crossover probability | Compilation probability |
|---|---|---|---|
| 1 | 50 | 0.5 | 0.02 |
| 2 | 100 | 0.6 | 0.04 |
| 3 | 200 | 0.8 | 0.1 |
| Experimental number | Factors | Experimental results | ||
|---|---|---|---|---|
| 1 | 50 | 0.02 | 0.02 | 2650.02 |
| 2 | 100 | 0.04 | 0.06 | 2499.35 |
| 3 | 200 | 0.1 | 0.1 | 2448.11 |
| 4 | 50 | 0.02 | 0.1 | 2485.77 |
| 5 | 100 | 0.04 | 0.02 | 2559.22 |
| 6 | 200 | 0.1 | 0.06 | 2552.22 |
| 7 | 50 | 0.02 | 0.06 | 2492.09 |
| 8 | 100 | 0.04 | 0.1 | 2507.33 |
| 9 | 200 | 0.1 | 0.02 | 2533.49 |
5.2. Effect of the Two Algorithms on the Experimental Results
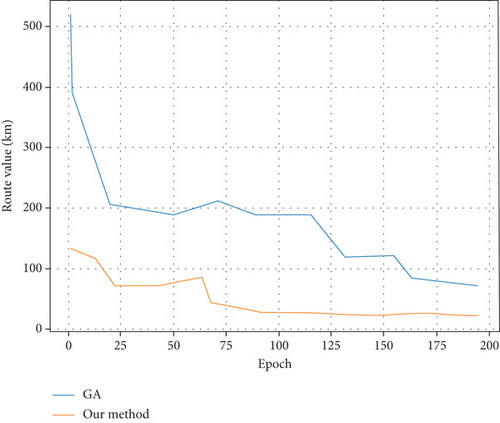
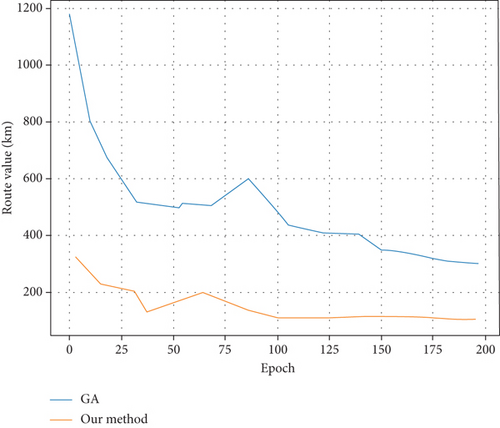
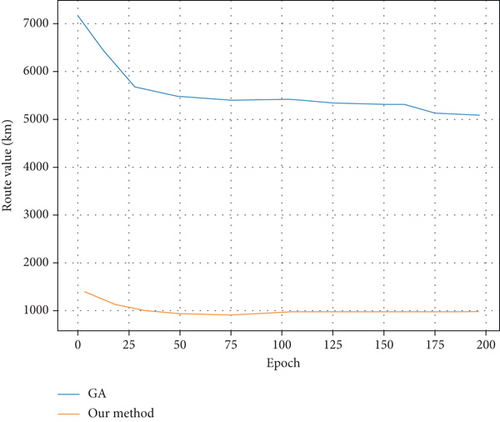
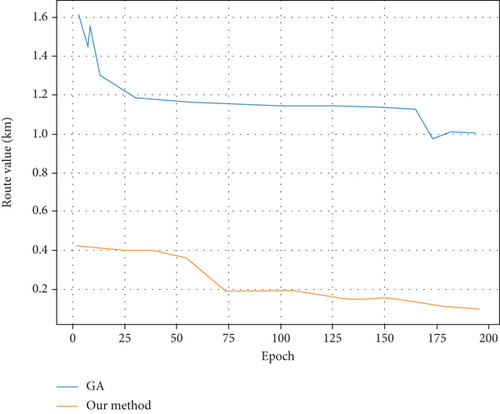
In order to be able to conduct a comprehensive analysis of the performance of the algorithm designed in this paper and the traditional algorithm, it is necessary to use the visual image method to analyze the advantages of the algorithm in the process of setting different parameters, and the optimization process of the path is detailed in Figures 3–6.
5.3. Effect of the Two Algorithms
In order to be able to study the effectiveness of the algorithm when the number of customers is large, a hundred customers are randomly selected in the interval range when the vertical and horizontal coordinates are (-8, 8), and the maximum distance of the vehicle is set to achieve the optimal vehicle driving route, Figure 7 is the graph of no distance limitation for the number of customers of 100, and Figure 8 is the graph with distance limitation for the number of customers of 100.
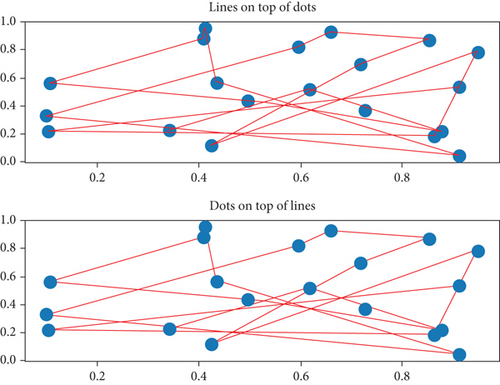
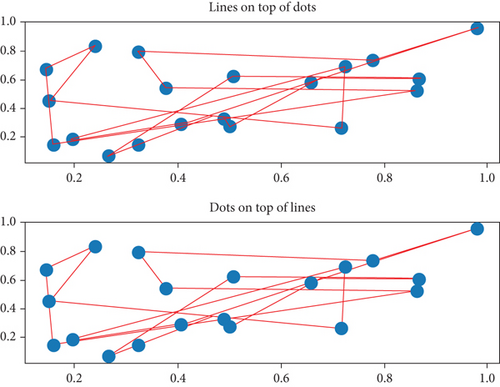
By comparison, the genetic algorithm designed in this paper is more time-saving and convenient, and it has global optimality than the traditional algorithm, which has important practical significance.
6. Conclusion
In this paper, a hybrid algorithm combining clustering technique and genetic hybrid algorithm with each other is used to achieve the optimization of modern logistics distribution paths. Through the research of this paper, it is indicated that the hybrid genetic algorithm’s can realize the optimization of logistics distribution paths, and it can not only realize the global optimal solution but also shorten the search time and improve the efficiency of the algorithm.
Conflicts of Interest
The author declared no conflicts of interest regarding this work.
Open Research
Data Availability
The raw data supporting the conclusions of this article will be made available by the authors, without undue reservation.


