Design and Research of Low-Cost and Self-Adaptive Terrestrial Laser Scanning for Indoor Measurement Based on Adaptive Indoor Measurement Scanning Strategy and Structural Characteristics Point Cloud Segmentation
Abstract
Nowadays, TLS (terrestrial laser scanning) has been a relatively mature measuring equipment categorized to indoor measuring robots, but it is not widely adopted in indoor construction measurement at present. What accounts for its limited application are as follows: (1) the high cost of high-accuracy laser LIDAR and (2) existing TLS equipment does not possess self-adaptation scanning planning and takes no account of efficiency of point cloud processing and consumption of computing power. This paper proposes a novel TLS equipment and a high-efficiency point cloud processing method customized for the novel equipment, with purpose to achieve self-adaption measurement on the basis of indoor characteristics of construction during civil engineering at low cost. This paper mainly presents two parts of innovations: (1) for planning of scanning, the novel TLS features planning sampling density of scanning according to room size and converting scanning data from poses to point clouds, and (2) for processing of point clouds, this paper proposes two novel segmentation algorithms, namely, “on-boundary segmentation algorithm” and “on-angular-distance segmentation algorithm,” based on indoor spatial structure features and characteristics of TLS. Besides, this paper presents modified RANSAC-TLS (random sample consensus-total least squares) plane fitting algorithm, on basis of TLS point cloud distribution characteristics and spatial transformation. Through actual measurement test, it is concluded that the “on-boundary segmentation algorithm” and “on-angular-distance segmentation algorithm” are suitable for point cloud segmentation in different types of scenes. The modified RANSAC-TLS have made a great improvement on accuracy of fitting versus LS (least squares), TLS (total least squares), and RANSAC-LS. Finally, this paper conducts an experiment by executing an actual measurement and then preliminarily testifies the potential and future application of the proposed novel TLS (terrestrial laser scanning) equipment, with measurement parameters from it being changed in the experiment, by comparing with one existing TLS equipment—FARO. The test thus proves the relatively high feasibility and potential of the novel TLS presented in the paper (terrestrial laser scanning) in actual indoor measurement.
1. Introduction
1.1. Background and Meaning
As robot technology and computer technology are advancing speedily, recent years have seen a certain degree of development in construction robot industry [1, 2]. At construction sites, construction robot replacing manual labour to finish complex work has already become a trending [3–5] such as construction fabrication robot [6], climbing robot [7], floor-tiling robot [8], collaborative robots [9], and measurement robot [10]. For example, floor-tiling robot [8] completes the automatic floor tiling with high-accuracy robot through control strategy based on visual measurement feedback and finite-state machine. Collaborative robot [9] controlled continuously by a BCI-based system robot to capture workers’ brainwaves acquired from a wearable electroencephalogram (EEG) device and interpret them into robotic commands with 90% accuracy. As the feasibility of setting construction robot into practical use in construction process has been enhancing by artificial intelligence and robot technology, the adaptation of computer algorithm and robotics in civil engineering is drawing wider and wider attention among relative science researchers [10–12].
At present, indoor measurement robot is typical of construction robots, and mainstreaming indoor measurement robot is an automatic machine featuring TLS [13, 14]. Differing from traditional manual measurement possesses low-efficiency, high human cost, and high health risk since it needs workers to be exposed to construction environment and to finish work with many tools like guiding rule and feeler gauge [15, 16]. The machine with TLS, which quickly collects 3D information of a room with LIDAR scanning, may be more efficient and be able to attain more comprehensive information of a 3D room.
However, existing equipment with TLS might lead to a waste of work, time, and finance because it is high cost and inevitably produces a tremendous size of point cloud data that usually consumes a large amount of time to process, while the house types and indoor structures of most constructions are actually not complicated and diversified, which means that, in most cases, indoor measurement may not need the possibly excessive collection and processing of information of an indoor room from robot with traditional TLS. Therefore, this paper proposes a self-adaptation TLS system that targets indoor measurement of quantity by combining relevant computer technology and robot technology.
1.2. Related Work
1.2.1. Terrestrial Laser Scanning for Measurement
Terrestrial laser scanning (TLS) is an efficient and reliable method for collecting point clouds, which have a range of applications in the construction. Because of efficient laser scanning data needed in construction, a prior planning optimization process, which can be called planning for scanning (P4S), was used in actual construction project. The key points of the P4S include the type of inputs they assume (model and possible scanning locations), the constraints in measurement, and the algorithm they utilize to solve the optimization problem [17–19]. In terms of algorithm, many researchers have proposed many algorithms to apply in measurement. Nisha Puri [20] presented a compliance-checking algorithm for detecting elements where dimensions exceed specified tolerance, using the synergy of terrestrial laser scanning (TLS) and continuous wavelet transform (CWT). The results enabled the localization of surface undulations during different characteristic periods. This case displays that the integration of TLS and appropriate algorithm may ensure measurement accuracy. As for indoor measurement and quality assessment, Bosché and Guenet [21] presented an approach that demonstrates the value of this integration for surface flatness control, which employs the Scan-vs-BIM principle of Bosché and e et al. [22] to segment TLS point clouds acquired on-site, by matching each point to the corresponding object in the BIM model. Although it achieves complete and even data analysis during the calculation of flatness of ground, it seems to be of low practicality in real usage because of the requirement for additional processing. Besides, Guo et al. [23] proposed that renting TLS or fractional ownership TLS is more economic for geometric QA, but TLS may be still a high-cost measurement technique.
1.2.2. Advances in Indoor Point Cloud Processing
TLS is mainly used as a data collector, and the data processor is point cloud processing [24–26]. The objective of point cloud processing is to convert 3D information into index for actual measurement, and specific processing technologies include point cloud filtering, point cloud segmentation, and point cloud fitting, among which point cloud segmentation is one research hotspot. In this area, Yin et al. [27] proposed a novel deep learning-based approach, ResPointNet++, by integrating deep residual learning with conventional PointNet++ network. ResPointNet++ shows a high generalizability and remarkable performance, which outperforms conventional PointNet++ by 42% and 23%. Nevertheless, this method for segmentation still requires a relatively large size of dataset for labelling and training. In addition, Park et al. [28] presented a high-performance algorithm to detect discrepancies between an as-planned BIM and the as-is point cloud automatically. The results of experiments showed a significant computation performance improvement: 25.3 and 12.1 times faster than the baseline method for a complex plant facility and a simple indoor building. Although the algorithm shows a relatively large decline in time complexity, a large space complexity sourcing from its fair-sized data determines that it is still difficult for users to remove its dependence on computing power of GPU. Pertinent literature reveals that [29, 30] the key point is to find the proper algorithm of point cloud filtering and point cloud fitting.
1.3. Innovation of This Article
- (1)
We propose a 3D laser scanning structure with two degrees of freedom to realize the self-adaptive scanning with a planning model proposed in this paper, and we realize the conversion of poses from all laser scanning points into point clouds by the “modified D-H model” in robotics.
- (2)
We propose an indoor point cloud process based on scanning data from this TLS, including conditional filtering, two novel point cloud segmentation algorithms, and RANSAC-TLS plane-fitting algorithm based on spatial transformation. In point cloud segmentation processing, this paper not only uses the point cloud but also uses the pose information of the 3D scanning points.
2. Low-Cost and Adaptive Indoor Measurement TLS System
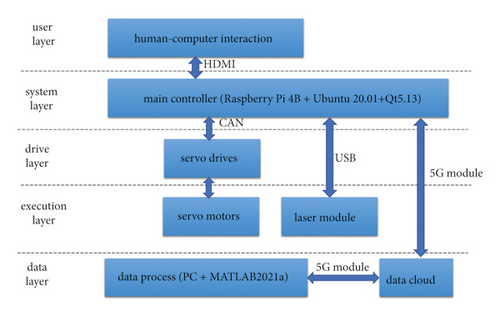
This paper proposes a low-cost and self-adaptive TLS system blending robot technology and computer software technology (see Figure 1). It contains 5 links that integrated well: user level, system layer, drive layer, execution layer, and data layer. The user layer, where user operates the whole machine and reads measuring results, manages human-machine interaction; the system layer performs the master control of motion control, data reading, and transfer of the TLS system; the drive layer is where the system implements servo control; the execution layer regulates motion of servo motor and reads laser ranging data and pose of laser module during a specific task; in data layer, measurement data are transferred from the TLS system to data cloud through a 5G module, by which it is also downloaded to a computer to implement following data processing; and finally, the processed data, transferred to the system layer through the 5G module, turns to be displayed on the user layer at the end.
3. Adaptive Indoor Measurement Scanning Strategy
3.1. Indoor Quantity Measurement Process Analysis
- (1)
Obtaining the comprehensive three-dimensional information of a room with the indoor scanning equipment.
- (2)
Classifying the data.
- (3)
Processing the classified data and categorizing them into indexes of quantities.
3.2. Adaptive Measurement Scanning Strategy
3.2.1. Scanning Motion Mechanism of Novel TLS in This Paper
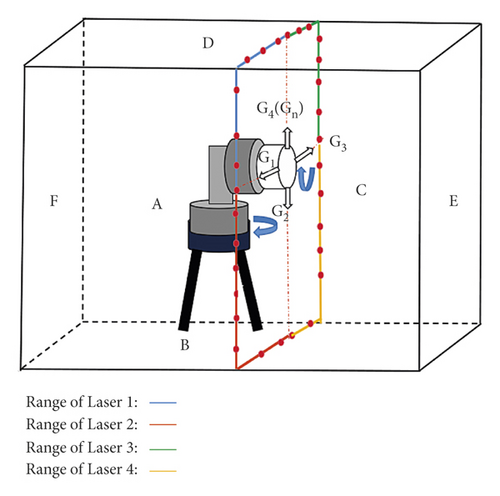
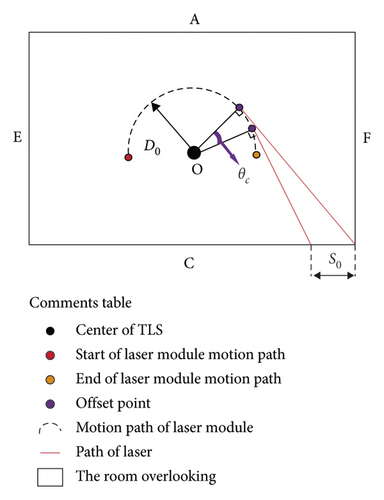
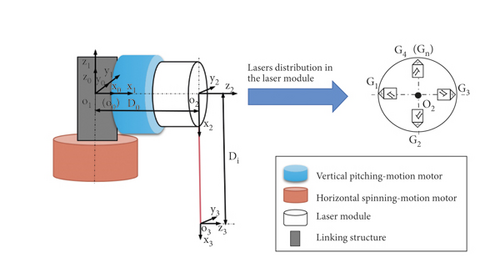
The whole laser scanning process is generated by the motion of a two-degree-of-freedom motor platform. In this paper, a motion mode of “equal angle” is proposed: in a fixed range of motion, we rotate according to the equal angle interval and stay at this position for distance measurement with laser module. The novel TLS will automatically scan the entire room by repeating the motion mode of “equal-angle” several times. The scanning motion of the novel TLS is based on a two-degree-of-freedom motor platform, with a “horizontal-motion motor” and a “vertical-motion motor.” In order to complete the indoor laser scanning more efficiently, the laser module has multilasers in the equal angle distribution (see Figure 2) (more details about the novel TLS equipment can be watched in a video by clicking on the link https://youtu.be/h7SavWCaPvc).
The entire scanning process comprises many such motor-motion cycles (see Figure 3). The “vertical pitching-motion motor” finishes one “equal-angle” (not greater than 360 degree) rotation, with the “horizontal spinning-motion motor” keeping static and repeating rotations in the same pattern many times, and the laser scanning will have a whole-room coverage.
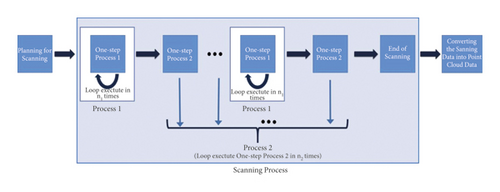
In order to achieve self-adaptation planning for scanning, namely, self-P4S (planning for scanning), with a certain scanning density preset by operators in specific measuring projects for different-size rooms, the novel TLS fulfils to finish scanning in shortest time.
3.2.2. Maximum Distance Interval Scanning in Planning Model
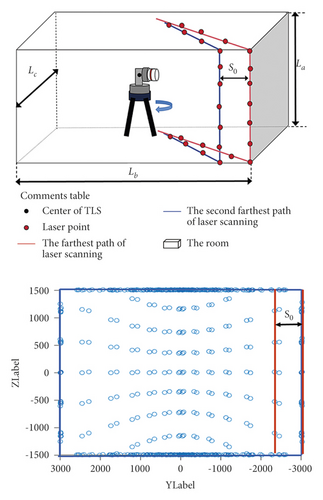
3.2.3. Minimum Time Cost Programming Model
In actual measurement, not only the density of point cloud but also the efficiency of measurement should be considered. Therefore, this paper proposes the “minimum time cost programming model.”
In the above formula, La, Lb, and Lc, respectively, represent interior net story height, length of longer wall, and length of shorter wall.
3.3. Converting from Scanning Data to Point Cloud Data
Some parameters may be obtained from the novel absolute angles of the “horizontal spinning-motion motor” and the “vertical pitching-motion motor.” The poses of laser scanning points (the TLS machine as the origin in the coordinate system) can be attained on these parameters. In order to convert poses of laser scanning points into point clouds, this paper makes use of “modified DH modelling” in robotics and realizes it in this way.
The following is an illustration of the converting process of the data from one single laser scanning point. Based on the novel TLS equipment and “modified DH modelling,” this paper builds four coordinate systems marked as {0}, {1}, {2}, and {3}. The origin of {0} system is the intersection point of medial axis of the horizontal motor and the medial axis of the vertical motor; the origin of {1}, with the horizontal spinning-motion motor as its origin, represents a coordinate system overlapped with {0}; {2} is the coordinate system with the vertical pitching-motion motor as its origin; and {3} is established with the single laser scanning point as its origin. In modified D-H method, the coordinate frame i is attached to the near (proximal) end of link i as shown in Figure 6. The link and joint parameters are defined as D-H parameters and are summarized in Table 1.
| Aix | Link length a(i − 1) | Link twist α(i − 1) | Joint offsitebi | Joint angleθi |
|---|---|---|---|---|
| {1} | 0 | 0∘ | 0 | θ1 |
| {2} | 0 | 90∘ | D0 | θ1 + θi |
| {3} | Di | 0∘ | 0 | 0∘ |
In practice, because measuring with single-laser laser module is not efficient enough, this paper presents a laser module with four lasers. The four lasers array around the centre of the laser module, which is coaxial with the vertical pitching-motion motor, with an angular distance of 90 degree between every two of them. Such laser module may be referred as multi-laser-ranging module.
As for all lasers in the laser module, the link and joint parameters are defined as D-H parameters and are summarize in Table 1. In the table, θi represents the angular separation of laser i from the initial laser. Li represents the measured value of laser i.
4. Indoor Point Cloud Process
4.1. Overview of Point Cloud Processing Procedures
According to text above, 3D point clouds and poses of 3D point clouds are presented by converting laser scanning data through modified DH modelling. Next, the novel TLS will enter phase of point cloud processing. As shown in the flow chart (see Figure 7), the data obtained from previous scanning activity will go through point cloud processing, including point cloud filtering, point cloud segmentation, and point cloud fitting. Experiencing the three procedures of processing, the processed point cloud data can be directly used to calculate quantities of the measured construction since every interior surface of the construction can be represented by a mathematical equation.

4.2. Indoor Conditional Point Cloud Filtering
Because refraction occurs when laser beam hits on glasses and it will cause the laser ranging value to be greater than the actual value, point clouds extracted around door and window may usually present abnormality in practical measuring. Abnormal point clouds need to be eliminated during point cloud processing.
This paper utilizes conditional point cloud filter and distributing characteristics of indoor point clouds to identify abnormal point clouds. Indoor point clouds roughly distribute in form similar to hexahedron, and the centre of TLS equipment is basically located at the centre of measuring room. This paper defines the distance between the centre of the TLS equipment and the farthest point relative to the centre of the TLS equipment as “maximum polar radius”; in this situation, distance from every point cloud to the centre of the equipment is not supposed to surpass the “maximum polar radius”; and any point cloud not in conformity with the criterion above should be identified as an abnormal point cloud.
In the formula above, β1, β2, and β3 are correction factors within the range (1,1.5). The correction factor is of significance since only under ideal condition, the centre of the novel TLS equipment may be located just at the centre of a room.
4.3. Segmentation of Indoor Point Clouds Based on Structural Characteristic
Segmentation of point clouds is a core procedure of data processing, and this paper proposes two algorithms for segmenting point clouds based on structural characteristics. Namely, this paper makes full use of point clouds and poses of them and spatial geometric features of room to create two novel algorithms.
4.3.1. On-Boundary Segmentation Algorithm for Indoor Point Cloud
In this paper, point clouds extracted from the novel self-adaptive TLS equipment present following features: 1. in each “process one,” the angle distance between the original point cloud and the final point cloud from the same single laser will present 90 degree. 2. Similarly, in one “process two,” the angle separation between the original point cloud and the final point cloud from a single laser is sure to be 180 degree. 3. Point clouds distribute in a form similar to a hexahedron. 4. Original state of the novel TLS equipment is with four lasers in the laser module separately vertical to four different interior surfaces, and the centre of the equipment is put close to the centre of the room.
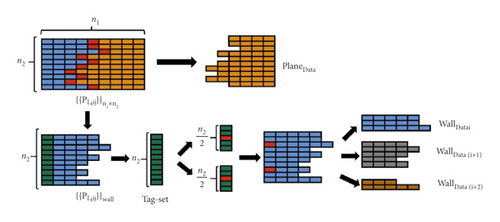
This paper names this novel segmentation algorithm as “on-boundary segmentation for indoor point cloud,” and the whole process is consisted of two rounds of segmentation. The first round is segmenting out the ceiling and floor, and the second round is segmenting out four interior walls of measured room (see Figure 8).
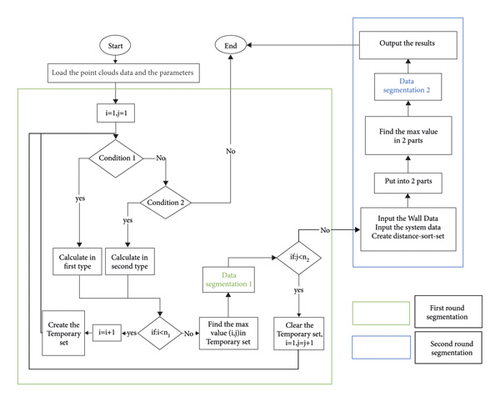
(1) First Round of Segmentation. Here, only one laser Li is taken to illustrate distributing characteristics and dataset of point clouds from one single laser after the whole scanning process. When the entire scanning phase of measurement is over, it is manifested that all point clouds extracted from laser Li are placed on WallDatai, WallData(i + 1), WallData(i + 2), and a plane (ceiling or floor). All point clouds from laser Liform a point cloud dataset , in which the “Li” represents point clouds from the laser, and “i” and “j” represent, respectively, the first-conducted “one-step process one” in first “process one” and first-conducted “one-step process two” in first “process two.” In addition, it is known that single “process one” contains n1 times of “one-step process one” and single “process two” contains n2 times of “one-step process two.”
The end of the entire set of procedures in the first round of segmentation signifies that the segmentation of point clouds from laser Li in a “one-step process one” is over. When the set of procedures is repeatedly executed n2 times with n2 sets of point clouds to be put into the algorithm, all point clouds of laser Li that are obtained from the entire scanning process and that are also distributed on ceiling or floor surfaces will be segmented out from other point cloud clusters.

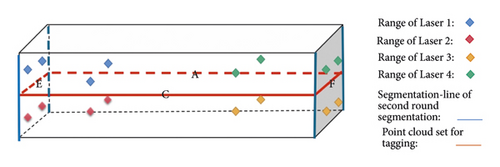
After implementing the first and second rounds, the segmentation processing for all points clouds extracted from entire scanning of laser Li comes to its end and all point cloud data are segmented into four datasets PlaneData, WallDatai, WallData(i + 1), and WallData(i + 2).
When point clouds collected from all the four laser modules have finished the first and second rounds of segmentation algorithm processing, the results of segmentation of point clouds on all interior surfaces will be attained.
4.3.2. On-Angular-Distance Segmentation Algorithm for Indoor Point Cloud
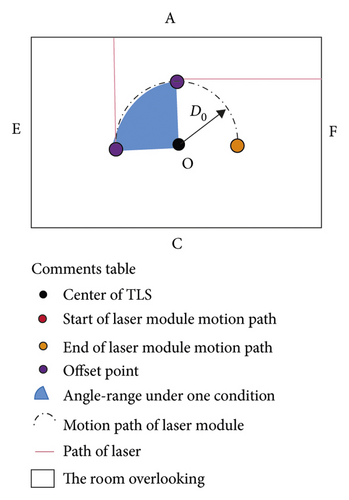
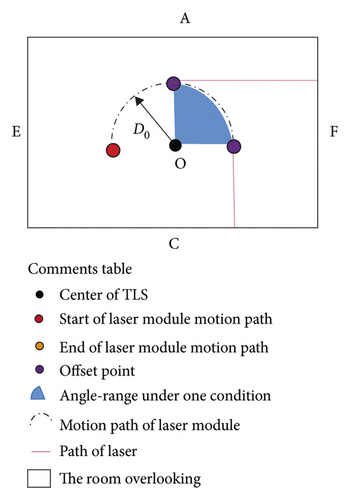
Apart from the novel segmentation algorithm introduced above, this paper proposes a novel segmentation algorithm for indoor point clouds based on angular distance emerging during scanning process (Figure 11). The laser beam from laser Li will hit on some points in the intersection line of two wall surfaces when the laser module on vertical pitching-motion motor moves in circle along with the horizontal spinning-motion motor. At the moment, an angular distance presents between two lines, one from current position of laser module to the centre of the equipment and another from original position of laser module to the centre. This angular distance is marked as , which is called “wall-to-wall angular distance” in this paper, and is another “wall-to-wall angular distance.” (Figures 12(a) and 12(d)). represents an angular separation occurs when the laser beam from Li hits on the intersection line of wall and ceiling or floor, and one line starts from the intersection line to the spatial position of the laser module and another line from it to the centre of the TLS machine. is named to be “wall-to-plane angle” (Figure 13), and the “j” means the times of conducting “process two.” However, accompanying implementation of all times of “process two,” there are four different formulae for calculating “wall to plane angle” in correspondence to four range of angular distance.
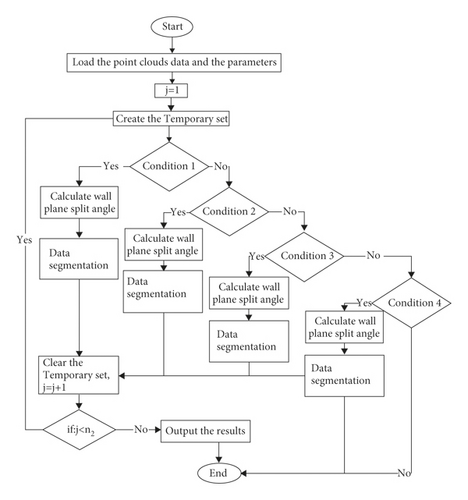
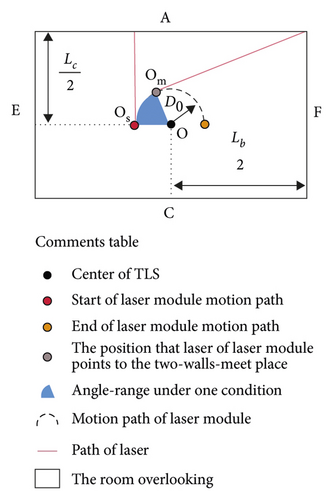
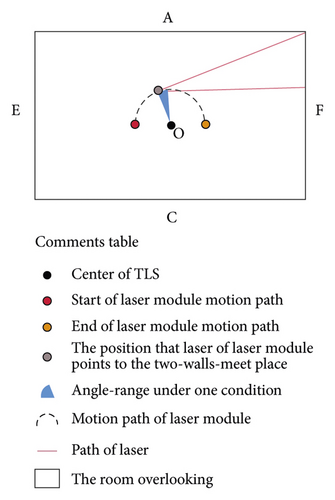
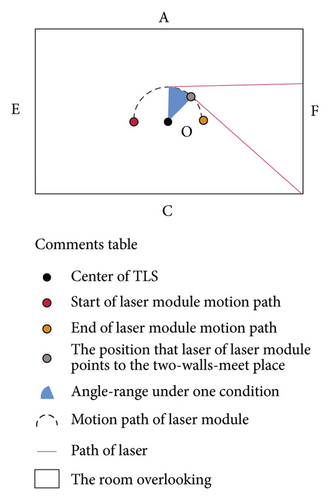
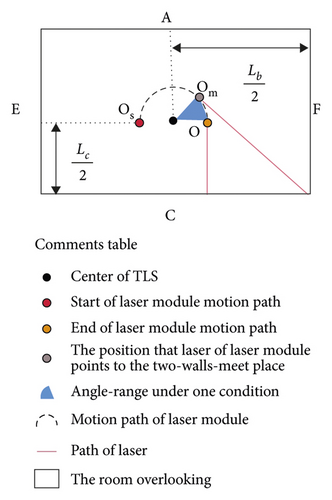
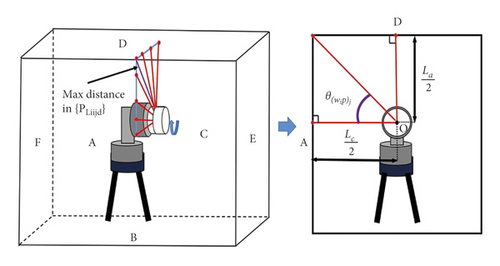
(1) Procedures of Segmentation Algorithm on Angle Characteristics. This segmentation algorithm on angle characteristics needs information, apart from point clouds, including interior net story height and the length of long and short wall of room. With this information, the procedures of segmentation algorithm on angle characteristics for point clouds collected from a single laser are demonstrated in Figure 12. As shown in Figure 12, after obtaining “wall-to-wall” or “wall-to-plane” angles, the algorithm processes point clouds in different formulae in accordance with which range the jΔθ2 is divided into.
The procedures of algorithm processing are shown in Figure 11. Firstly, the point clouds and parameters of room size are loaded and the system will calculate the “wall-to-wall angle” and “plane-to-wall angle” on the given parameters. Then, it enters the branch structure to judge which formula to be invoked based on angular ranges of jΔθ2.When the branch structure is terminated, point clouds extracted from one single laser Li during the entire scanning process will be segmented into four datasets, respectively, relative to four interior surfaces: PlaneData, WallDatai, WallData(i + 1), and WallData(i + 2).
(4) Procedures of Data Segmentation. As known above, accompanying jΔθ2 within different range, the calculation formula to get one certain degree value diverges and so does the segmentation results of relevant point clouds. Here, it comes a to help in segmenting point clouds into different datasets, and its equation is .
When the data segmentation above is finished, point clouds collected from a single laser after entire scanning process will be attached to three walls and one horizontal plane, ceiling, or floor.
4.3.3. Analysis of Point Cloud Segmentation in This Paper
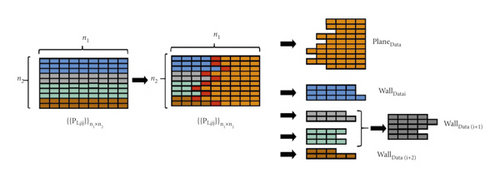
As for the point cloud measured by the four lasers in the point cloud data, each laser contains four planes, including the point cloud data of three indoor walls and one plane (ceiling or floor). And the main idea of the above two algorithms is to segment the four planes of each one laser-scanning point cloud and then combine all the segmentation results from each laser to finally realize the segmentation of the point cloud of the six planes in the whole room. Both algorithms use the different scanning path’s characteristics of TLS in the hexahedron-type room. On-boundary segmentation uses edge features of indoor space, so two rounds of segmentation are required for point cloud data segmentation of single laser measurement data. One turn is for the edge feature of the intersection line between wall and plane, and the second turn is for the edge feature of the intersection line between wall and wall. On-angular-distance segmentation algorithm uses the angle features in space to segment point clouds. On the premise of knowing the size of indoor rooms, the angle features are used to realize the presegmentation of all point clouds on the walls. Thus, point cloud segmentation of four planes can be realized only through a cycle of data traversal. Therefore, the time complexity of on-angular-distance segmentation algorithm is lower.
To better understand the data process of the two algorithms, the principle of two algorithms can be understood through figure (see Figure 14). All point cloud can be regarded as a array in n2 rows and n1 columns. Due to the execution of “one-step process 2” for n2 times, the arrays are combined with the n2son-arrays. The son-array which size of 1 × n1 represents the point cloud scanned in “Procedure 1.” In the point cloud segmentation scenario in this paper, the key of point cloud segmentation is to find the “cut-off point” for point cloud segmentation (the red areas of the picture represent the “cut-off points”). Although the on-angular-distance segmentation algorithm is better than the on-boundary segmentation in time complexity, the on-angular-distance segmentation algorithm needs to know get indoor room size, and the centre of TLS cannot be completely placed in the middle of the room during scanning, so the segmentation accuracy will be affected. On-boundary segmentation algorithm can segment point cloud without indoor house size. For regular hexahedral rooms, ideal point cloud segmentation can be achieved, but for indoor rooms with no obvious “edge features,” the segmentation accuracy will be affected. Therefore, the advantages and disadvantages of the two algorithms should be analysed through segmentation experiments in actual point cloud in reality.
4.4. Plane Fitting Algorithm for Indoor Point Clouds
4.4.1. Rotation Transformation in Point Cloud Fitting
4.4.2. Modified RANSAC-TLS Algorithm for Fitting Based on Spatial Transformation
(1) Total Least Squares. Total least squares are a kind of algorithm for fitting that does not exclude interference factors in regression matrix during calculation. The basic principle of it is as follows:
- (1)
Identifying the surface where point cloud Psi is and implementing spatial transformation on it according to Psxi = rotx × Psi or Psyi = roty × Psi, also Psi = Psxi or Psi = Psyi.
- (2)
Selecting randomly three processed point clouds that are not on any common line and solving the equation of the three points: z=aix + biy + ci.
- (3)
Calculating the distance from every point cloud to the plane z=aix + biy + ci in the following formula:
(34) - (4)
Calculating the standard deviation σ from point clouds to the plane di in the formula:
(35) -
In the formula above, , and thresholding t = 2σ. If di > t, then the point is identified as null point ready to be deleted; otherwise, the point is efficient point to be retained and the amount of efficient points will be totaled to Mi.
- (5)
Repeating the procedures above k times and identifying the model with most efficient points: Mf = max{Mi}.
- (6)
Adopting TLS to conduct point clouds fitting of surfaces and obtaining the parameters of plane equations.
5. Experimental Verification and Discussion
5.1. Experiment Preparation
5.1.1. Preparation of TLS in This Paper
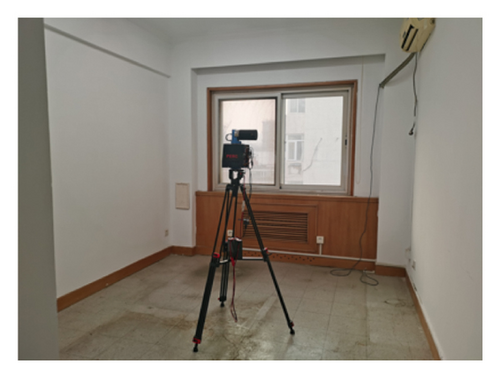
In order to verify the feasibility of the novel TLS and data processing system, we conducted scanning and processing in several rooms ready-to-move-in in a room shape that basically conforms with a hexahedron (see Figure 15(a)).
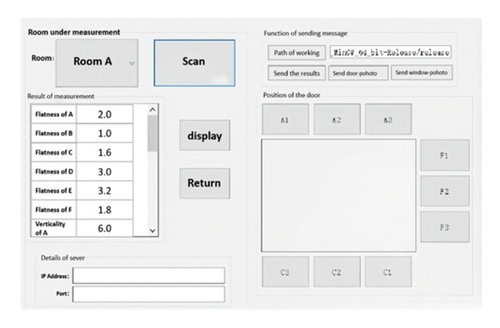
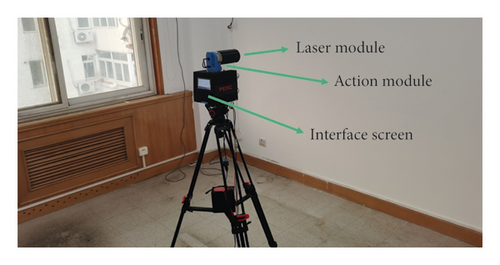
We implemented 3D scanning to collect data of the room on the novel self-adaptation TLS equipment; as for software system for laser scanning, we designed and developed two software systems: one for data collecting and the another for point cloud processing. All data collection was carried out on the equipment (see Figure 15(c)), and then, the data were transferred to a cloud server through which the scanning data were downloaded into a computer terminal to implement processing. In this paper, we temporarily adopted TCP/IP on a local area network to transfer the data for the sake of short-term experimental stage.
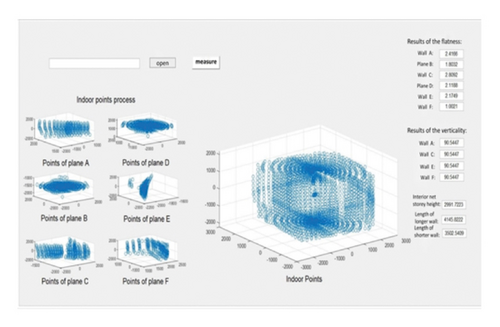
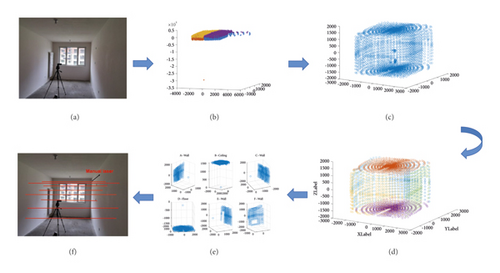
When the TLS machine was appropriately located, we clicked on the “To Scan” to start 3D scanning of the entire room. After it finished, scanning points were transferred to computer where we proposed two novel point cloud segmentation algorithms: one based on edges of interior surfaces and one based on angle range. On data-processing interface, the process of the data point processing was visualized and the interior quantities of room were obtained by data processing (see Figure 15(b)).
5.1.2. Experiment Process of Data Analysis
Afterwards, the collected data will be processed on computer and the entire processing procedures are displayed in Figure 16. We collected indoor 3D point cloud data with the multilaser module on the self-adaptation novel TLS equipment, but there was a possibility for laser beam to hit outside the room or on some light-reflecting objects causing high measuring error of data and high error of the point clouds corresponding to the measured data, which were called noisy points. Hence, we needed the filter mentioned in the paper to filter out the noisy points and retain point clouds applicable to indoor point cloud processing. Then, retained indoor point clouds were segmented by the point cloud segmentation algorithms for point clouds. The segmented clusters of point clouds were fitted into different surfaces. The equations of fitted surfaces will be used in the analysis of the measuring accuracy of this measuring system with a traditional manual laser-ranging method.
5.1.3. The Evaluation for Segmentation Algorithms for Indoor Point Clouds
The Nt, No, and Nc, respectively, represented the numbers of relatively accurately segmented point clouds, omissive-in-segmenting point clouds, and wrongly segmented point clouds.
5.1.4. The Verification for Fitting Accuracy of Indoor Point Clouds
Once the data processing was finished, we started verifying the fitting accuracy of segmented point clouds of surfaces. The verifying method was proposed by making use of calibrating method for indoor measuring and also the characteristics of measured objectives—indoor rooms.
(1) Calibration for Indoor Measurement. We calibrated the measurement in manual way and the calibrated objective is the net-length of the room. Specifically, we measured the net-length from the laser range finder in hand to the laser point hits on a relatively smooth surface and repeated the measurement on multipoints many times. Afterwards, we calculated the average value of all measuring results. Measuring value in every time was marked as Lmi(i = 1 … n).
(2) The Evaluation for the Fitting Accuracy of Point Clouds. The plane equations of two planes obtained by fitting algorithm were as follows: Asx + Bsy + Csz + Ds = 0 and Ajx + Bjy + Cjz + Dj = 0.
Comparing the LTLS with the standard value for calibration Lms, the difference value can reflect the measuring accuracy.
5.2. Experiment Result and Discussion
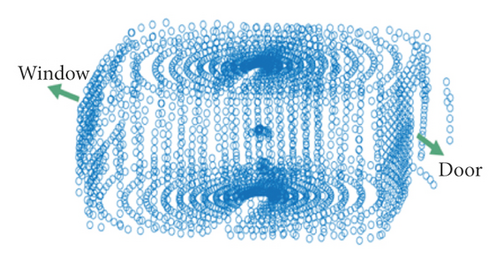
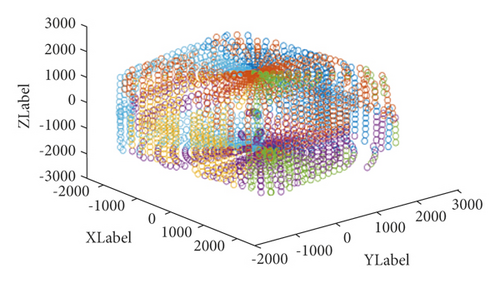
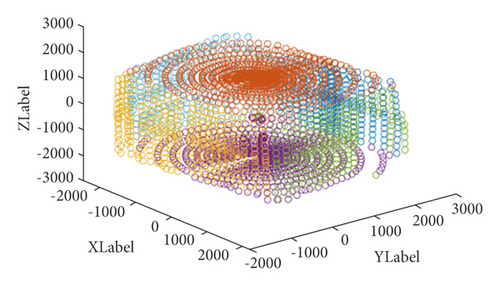
(1) The Analysis of Effectiveness of 3D Scanning. The results of actual indoor 3D scanning data collected by the novel self-adaptation TLS equipment might basically reflect indoor constructional features, and the general configuration of windows and door in the real room was presented by visualizing 3D point clouds data (see Figure 17).
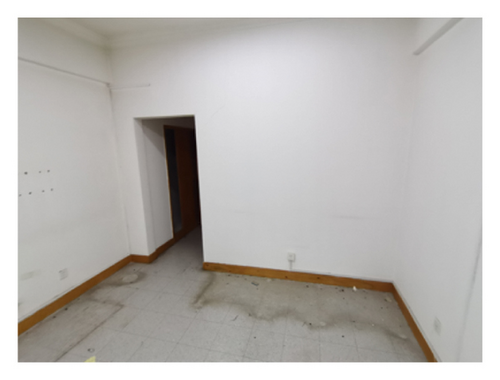
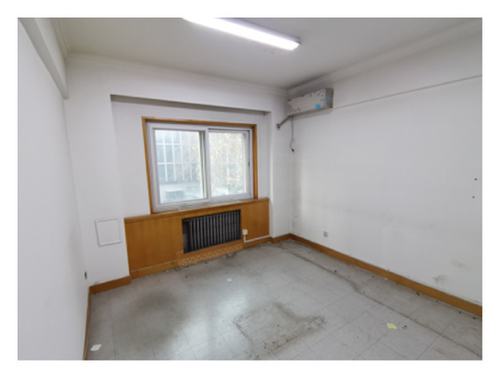
(2) The Result of Point Cloud Segmentation. As shown in Figure 18, for point clouds from hexahedral room with clear boundaries between surfaces, “on-boundary segmentation algorithm” will perform relatively effective segmentation but for that from rooms without clear boundaries of surfaces, and the segmentation results of “on-boundary segmentation algorithm” are not close to 6 indoor surfaces. The unclear boundaries of surfaces are shown in these two forms: (1) carvings made between ceiling and walls, and (2) relatively big internal and external corner existing on the edge zones of surfaces. However, “on-angular-distance segmentation algorithm” will be able to perform normal segmentation under these two kinds of conditions and it is noticeable that known room indoor sizes are the premise of performing high-accuracy segmentation.
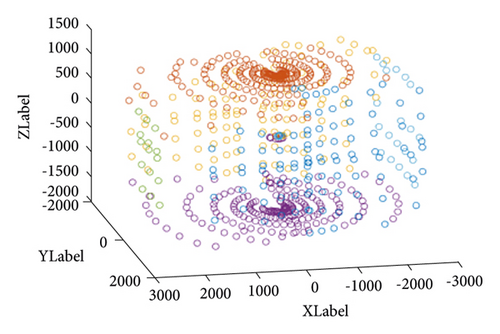
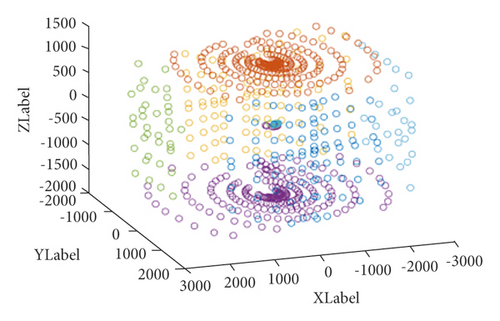
We have implemented data scanning and collecting of the two kinds of rooms in different conditions and evaluation of segmentation accuracy of two types of segmentation algorithms mentioned in this paper (shown in Table 2). On house type of room 1, the performance of two kinds of segmentation algorithms is ideal, with the F1 index of point cloud clusters from “on-boundary segmentation algorithm” up to highest value of 0.9663 and the down to 0.7692 and the F1 index from “on-angular-distance segmentation algorithm” ranging from 0.6866 to 0.9789. As for house type of room 2, the segmentation accuracy of “on-angular-distance segmentation algorithm” is higher than that in another. Highest F1 index of point cloud clusters from “on-boundary-segmentation algorithm” is 0.7713 and the lowest one is 0.2969, while the F1 index from the another segmentation algorithm has highest value of 0.9781 and lowest one of 0.7824. From the perspective of data, we can draw a conclusion that these two kinds of segmentation algorithms are both able to attain relatively high-accuracy segmentation for indoor point clouds and the accuracy of segmentation is lower when the segmented objective is a lesser order of magnitudes of point cloud clusters.
| Type of the room | Segmentation algorithm | Index | Number of point cloud cluster | |||||
|---|---|---|---|---|---|---|---|---|
| 1 | 2 | 3 | 4 | 5 | 6 | |||
| Room 1 | On-boundary segmentation | Numbers | 94 | 228 | 105 | 215 | 20 | 30 |
| Precision | 0.9362 | 0.9561 | 0.9238 | 0.9805 | 0.8824 | 0.9000 | ||
| Recall | 0.9671 | 0.9689 | 0.9604 | 0.9526 | 0.6818 | 0.7500 | ||
| F1 | 0.9514 | 0.9625 | 0.9417 | 0.9663 | 0.7692 | 0.8182 | ||
| On-angular-distance segmentation | Numbers | 88 | 227 | 105 | 214 | 27 | 31 | |
| Precision | 0.9545 | 0.9824 | 0.8762 | 0.9766 | 0.7407 | 0.7419 | ||
| Recall | 0.9333 | 0.9696 | 0.9388 | 0.9812 | 0.9091 | 0.6389 | ||
| F1 | 0.9438 | 0.9759 | 0.9064 | 0.9789 | 0.8163 | 0.6866 | ||
| Room 2 | On-boundary segmentation | Numbers | 392 | 649 | 265 | 705 | 247 | 441 |
| Precision | 0.6582 | 0.6336 | 0.8302 | 0.9062 | 0.3644 | 0.2063 | ||
| Recall | 0.9314 | 0.50141 | 0.9016 | 0.4628 | 0.4348 | 0.5291 | ||
| F1 | 0.7713 | 0.5598 | 0.8644 | 0.6127 | 0.3965 | 0.2969 | ||
| On-angular-distance segmentation | Numbers | 278 | 777 | 362 | 800 | 221 | 261 | |
| Precision | 0.9389 | 0.9781 | 0.8785 | 0.9750 | 0.9638 | 0.7510 | ||
| Recall | 0.7957 | 0.9596 | 0.9845 | 0.9811 | 0.8987 | 0.8167 | ||
| F1 | 0.8614 | 0.9688 | 0.9285 | 0.9781 | 0.9301 | 0.7824 | ||
Apart from that, viewing for the segmentation accuracy of room 2, whereas the distinction of surfaces in the house type as room 2 is less significant relative to that of room 1, the particular point clouds used for “on-boundary segmentation” are not easy to identify, and hence, the segmentation accuracy is not high. On the other hand, the accuracy of two kinds of segmentation algorithms for two rooms is basically close, attributing to the oneness of determinant for the segmentation accuracy of “on-angular-distance segmentation algorithm”—the accuracy degree of distance from equipment to every surfaces in a room.
Hence, the key to enhance the accuracy of segmentation is to ensure the room size and type as-near to a standard hexahedron as possible and also the normative location of the TLS equipment at the centre of a room.
(3) The Accuracy of Point Cloud Fitting. After finishing the point cloud segmentation, this paper selects the segmented point cloud clusters of two planes with symmetrical distribution for plane fitting and plane distance calculation. And we calculated the actual distance result through the manual measurement, which was carried out by the method proposed above. Referring to relevant literature, in the fitting process, this paper selects different plane fitting algorithms, including TLS, LS, WTLS-D, RANSAC-LS, and the improved RANSAC-TLS proposed in this paper.
In the fitting experiment, we divided the segmented point cloud clusters into three categories: class 1 point cloud clusters, class 2 point cloud clusters and class 3 point cloud clusters. Among them, class 1 point cloud clusters were mainly the point cloud clusters distributed on the two opposite walls with the largest area of the blank part on the indoor surface; class 2 point cloud clusters were the point cloud clusters on the floor and ceiling; and class 3 point cloud clusters referred to the point cloud clusters on the wall with windows and opposite to the wall. We selected five house types of rooms for data scanning and point cloud segmentation, and three kinds of point cloud clusters were extracted for fitting accuracy experiment. The experimental results are shown in the Figure 19.
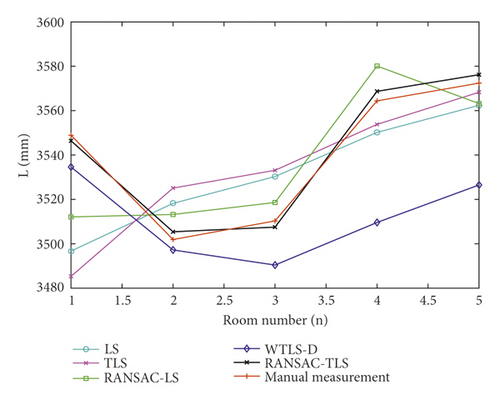
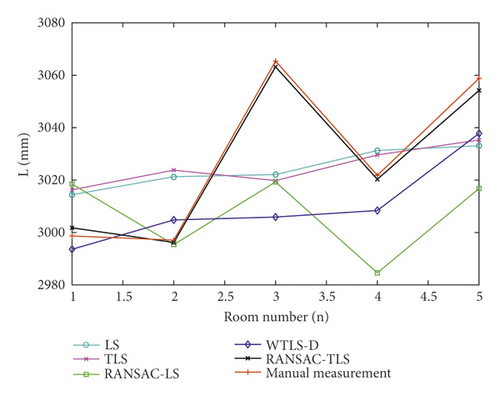
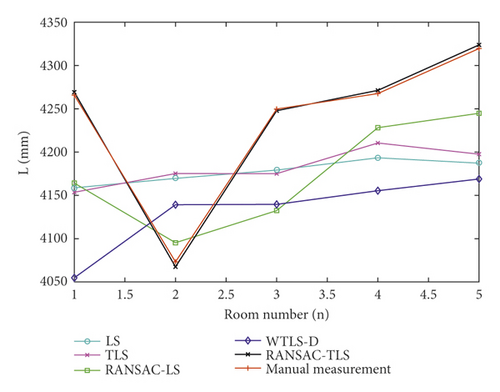
It can be seen from the figure that among class 1, class 2, and class 3 point cloud clusters, RANSAC-TLS algorithm is the closest to the results of manual measurement. The second is RANSAC-LS and WTLS-D algorithm. LS and TLS algorithm performed worst in fitting, and the changing trend of the two algorithms is similar in the calculation results of different rooms. Because there were some noise points of information in the whole segmented point cloud cluster, these noise points are composed of random error in the scanning process and systematic error of the equipment. Moreover, in the process of point cloud segmentation, because the segmented point cloud clusters are sparse point cloud clusters, and not all of the point cloud clusters are ideal point clouds in the flat wall area; on the contrary, there are often some outliers in the point cloud clusters, which become noise points in the sparse point cloud clusters and affect the fitting accuracy evaluation results.
According to the measurement results, LS and TLS do not filter all point cloud data in the fitting process, so these two algorithms are easy to introduce some noise data into the fitting process. Although WTLS-D algorithm also performed iterative fitting based on the distance to the TLS plane as the weight, its initial fitting plane was still the fitting result of TLS. Therefore, in the fitting process, although its fitting accuracy was improved, its robustness was relatively poor. Both RANSAC-LS and RANSAC-TLS belong to combined algorithms, which get the advantages of RANSAC algorithm. The ideal point cloud region of plane fitting was found by calling out a reasonable threshold. From the results, compared with RANSAC-LS, RANSAC-TLS better optimized the fitting weights of all point clouds in the filtered point cloud data, and finally performed better in the fitting results. For class 1 point cloud, it could be seen that there were relatively few noise points in its point cloud cluster, so all fitting algorithms were relatively stable in the measurement results. However, complex outliers would appear in the data scanning of class 2 and class 3 point cloud clusters. For example, the point cloud of objects such as lampshade often appeared in the ceiling data in class 2 point cloud clusters. In the three kinds of point cloud clusters, due to the measurement target of window, there would be more complex point cloud clusters. For the point cloud fitting algorithm without prescreening in the fitting process, the calculation results based on the fitting plane equation would have a large deviation from the actual measurement results.
Thus, in the fitting process, RANSAC can screen out noise and outliers and improve the fitting accuracy. From the overall fitting results, RANSAC-TLS algorithm performs best in fitting accuracy.
(4) Analysis of Scanning Parameters Threshold in Actual Measurement. To test measurement accuracy and efficiency of the proposed planning-scanning method in real indoor condition, we conducted one measurement experiment with the novel TLS equipment in a room, in shape of a hexahedron, ready to move in, in size of 4250 mm × 3510 mm × 3065 mm. According to the planning-scanning method proposed in Chapter 3, the relevant planning parameters in this house shape include D0 = 142 mm, Lb = 4250 mm, Lc = 3510 mm, smax = 330 mm, Td = 0.5 s, and Ts = 1 s.
For the planning model of indoor scanning, smax is a reference value, and value s0 determines the distributing density of the entire laser scanning point cloud data. To make TA a relatively small value, which is an expectation, smax is usually taken from s0, and k is taken as large as possible. In this experiment, for value taking, we set different s0 values for actual data collecting. Besides, we obtained segmented point cloud clusters and the point-cloud-cluster-plane equation based on the proposed point-cloud-processing algorithm.
Referring to the calculation method presented in the relevant literature [33], the flatness and verticality of four indoor walls of the measured room are calculated with different scanning parameter. In addition, we obtained the same two indexes by manual measurement with guiding rule. Based on the above operation, the mean error of flatness (mF.E) and mean error of verticality (mV.E) can be achieved by first attaining errors between manually measured values and variable values coming from the novel TLS equipment with varying scanning parameters.
Next, the calculation is executed in method proposed in this paper alike with changing scanning parameter, and the results of the actual manual measurement, respectively, find the error of the measurement value and manual measurement value of the equipment based on different scanning parameters, and calculate the mF.E of the wall and the mV.E of the wall.
Five groups of real quantities of measured indoor walls were taken from the entire experiment (see Table 3). As shown in the below table, S0 ranges from 200, 330, 400, and 630. When S0 and k are both in a relatively-low value, TA will reach an excessively large value. In this case, Δθ2 was once set at 10° by controlling the value of k. Additionally, with s0 in value of 330 and meanwhile Δθ2 at 5°, a scanning was executed for contrasting (shown in Table 4) presents the specific experiment results.
| TA (min) | S 0 (mm) | θc (°) | k | θc (°) | ∆θ2 (°) | File size (kB) | |
|---|---|---|---|---|---|---|---|
| Manual measurement | 25 | ||||||
| Scheme 1 | 13 | 330 | 4.75 | 2 | 5 | 10 | 26 |
| Scheme 2 | 26 | 330 | 4.75 | 1 | 5 | 5 | 56 |
| Scheme 3 | 10 | 400 | 5.87 | 1.67 | 6 | 10 | 20 |
| Scheme 4 | 15.25 | 200 | 2.78 | 3.33 | 3 | 10 | 30 |
| Scheme 5 | 4.75 | 630 | 9.89 | 1 | 10 | 10 | 7 |
| (mm) | Wall 1 | Wall 2 | Wall 3 | Wall 4 | mF.E | mV.E | ||||
|---|---|---|---|---|---|---|---|---|---|---|
| F.R | V.R | F.R | V.R | F.R | V.R | F.R | V.R | |||
| Manual measurement | 3.33 | 7 | 3 | 2.26 | 3 | 2 | 2.5 | 4.5 | ||
| Scheme 1 | 2.528 | 6.32 | 2.716 | 5.67 | 2.134 | 6.18 | 1.182 | 6.94 | 0.82 | 2.68 |
| Scheme 2 | 3.47 | 5.32 | 4.22 | 1.24 | 4.13 | 1.71 | 2.0 | 6.33 | 0.75 | 1.21 |
| Scheme 3 | 4.247 | 6.34 | 4.34 | 5.79 | 4.58 | 6.126 | 2.513 | 6.87 | 0.96 | 2.67 |
| Scheme 4 | 3.503 | 6.38 | 4.25 | 5.78 | 3.86 | 5.71 | 1.683 | 6.44 | 0.78 | 2.45 |
| Scheme 5 | 2.55 | 2.32 | 3.857 | 1.34 | 2.09 | 13.6 | 2.11 | 6.45 | 1.78 | 5.79 |
From the calculation results with different parameters, it should be known that although the scanning scheme 2 takes the longest time, the measurement results have the smallest mean error by being compared with manual measurement results. The scanning scheme 5 takes the shortest time, but the measurement mean error is the largest in the same comparison pattern. Walls 3 and 4 are two walls further away from the novel TLS equipment than the other two, corresponding to point cloud clusters 5 and 6. Associating with the point cloud segmentation results, it can be concluded that point clouds distributed on the two walls are less so that the wall point cloud data are less and the measurement error emerges greater, which is less, and the measurement error is greater. Because of lower mV.E value in scheme 2, it might be true that minimizing Δθ2 is more efficient in enhancing measurement accuracy. However, scheme 2 has one flaw that the time consumption of scanning in this scheme is even larger than traditional manual measurement method.
5.3. Comparison Result between the Novel TLS and the Existing TLS
(1) Comparison of the Device Parameters. Most existing TLS adopted in indoor measurement is nothing more than FARO Focus 3D laser scanner. In Table 5, the parameters of the two TLS devices are compared, and the existing TLS devices have higher efficiency and density in environment-sensing data collection. However, the existing TLS equipment and the novel TLS equipment can both achieve ranging accuracy ranging within ±1 mm. In another word, in the perspective of scanning range, the mechanical structure of the novel TLS equipment proposed in this paper has no scanning blind area.
| Device parameters | FARO focus M70 | Novel TLS |
|---|---|---|
| Measurement accuracy | ±1 mm | ±1 mm |
| Laser module type | LIDAR module | Point laser module |
| Range of distance measurement | 0.6 m–70 m | 0.3 m–10 m |
| Measurement speed | 488000 points/s | 4 points/s |
| Vertical field of scanning | 305° | 360° |
| Horizontal field of scanning | 360° | 360° |
| External dimensions (mm) | 240 ∗ 200 ∗ 100 | 350 ∗ 300 ∗ 300 |
| The characteristics of the scan | The dense point cloud is used to reconstruct the 3D space and completely simulate the measured indoor real quantity | Measure the indoor real quantity with spare point cloud of point cloud process |
(2) Comparison of the Actual Measurement Result. In order to verify the further application and practical potential of the novel TLS equipment in indoor actual measurement, we compare the measurement accuracy, efficiency, and cost of FARO focus [21] and novel TLS in similar experimental conditions, taking the mF.E results of flatness in the indoor slab measurement [21] as accuracy-evaluating standard. Next, contrasting FARO equipment and the novel TLS equipment in two aspects are presented in Table 6: scanning time and amount of point cloud data in actual measurement.
| Device name | Scanning time (min) | mF.E (mm) | File size | Equipment cost ($) |
|---|---|---|---|---|
| FARO focus M70 | 4 | 0.7[21] | 7.68 GB | 90,000 |
| Novel TLS 1 | 5 | 1.8 | 7 kB | 7,000 |
| Novel TLS 2 | 13 | 0.8 | 26 kB | 7,000 |
As seen in Table 6, in scanning time consumption, the scanning scheme 1 of the novel TLS equipment proposed in this paper is 1 minute slower than FARO. The measurement accuracy in scanning scheme 2 is 0.8 mm, near to FARO. However, the cost of novel TLS equipment is much lower than FARO. Besides, in the aspect of file size of scanning data, the novel TLS equipment features lower cost of data processing due to its smaller size of collected scanning data than existing TLS equipment.
6. Conclusion and Future Research
It can be concluded that the novel TLS presented in this paper is able to achieve self-adaptation scanning in indoor condition. As for P4S, this paper presents a “scanning method by process” to realize planning for scanning of an indoor space of a room. In view of continuous changes of point clouds poses in one-step process in “measurement by process,” the segmentation methods mentioned in this paper not only make use of point clouds extracted from TLS, which is a kind of discrete data, but also make use of the poses of every laser scanning points. Finally, the actual measurement tests display that the “on-angular-distance segmentation algorithm” is of higher robustness than “on-boundary segmentation algorithm” in actual measurement. However, if the measured room is near to a regular hexahedron, the accuracy of the two segmentation algorithm is close. In terms of fitting of point clouds, this paper presents a modified plane fitting algorithm based on the point cloud distribution characteristics in a hexahedral room and it is proved that the modified plane fitting algorithm can achieve millimetre-level accuracy. Accuracy and efficiency of the novel TLS may be tested by analysing measured quantities drawn from an actual measurement experiment with a threshold of equipment parameters. Furthermore, for testing accuracy and efficiency, this paper introduces a series of measurement results of an existing TLS equipment, FARO, attained in basically the same conditions to compare with that of the novel TLS equipment proposed in this paper, with costs of the two pieces of equipment being compared too. In this way, the accuracy, efficiency, cost and potential, and future application of the proposed novel TLS equipment based on sparse point clouds are preliminarily tested.
Although the self-adaptation TLS has merits of self-planning, low-cost, and high-efficiency computing, there is an abundance of optimisation and upgrading to fulfil: 1. creating structural parameter calibration methods because several parameters are introduced in the DH modelling, which brings some systematic errors into the result, requiring an appropriate calibration scheme to reduce the systematic error; 2. upgrading segmentation algorithm based on structural characteristics of irregular room. This paper achieves segmentation of point clouds from a regular hexahedral room, but if the room structure is more complicated, the robustness of the segmentation algorithm is apt to decline; 3. by implementing semantic segmentation of the indoor information based on this kind of lightweight dataset presented in this paper, this paper has just researched data features of wall surfaces but not covered semantic segmentation for indoor 3D data or segmentation for details, such as those of doors and windows, and internal and external corners. Therefore, our team will continue relevant researches and tests in the future.
Conflicts of Interest
The authors declare that they have no conflicts of interest regarding the publication of this paper.
Acknowledgments
This study was sponsored by the BUCEA Doctor Graduate Scientific Research Ability Improvement Project (DG2021015), Key Science and Technology Projects of China (KZ202110016024), and BUCEA Master Graduate Scientific Research Ability Improvement Project (PG2022128).
Open Research
Data Availability
The data used to support the findings of this study are available from the corresponding author upon request.


