Control Strategy of Frequent Overflow at Intersection Based on Remote Sensing of Unmanned Aerial Vehicle and Vehicle Trajectory Data
Abstract
This paper proposed an effective method, the overflow control strategy, for identifying and controlling the frequent overflow of signalized intersections based on the unmanned aerial vehicle (UAV) remote sensing and vehicle trajectory data that provide multi-dimensional vehicle dynamic data. This strategy can effectively control the overflow intersection and restore normal operation as soon as possible. The strategy was implemented as follows. First, UAV remote sensing was used to quickly find the overflow precursor at the intersection. Second, by using moving trajectory data, the second-flow model of the road section was constructed, and overflow identification indexes were established. Third, considering the traffic demand of controlled intersection and non-overflow phase from the global perspective, the queue length model of the non-overflow phase based on moving trajectory data was established and overflow identification indexes were taken as the objective function to design overflow control strategy set. Finally, according to the sampling rate requirement of moving trajectory data and the field traffic survey, the Changping District in Beijing, which meets the requirements, is selected as the case study for simulation and verification. Usually, when overflow occurs, total delay time and the average number of stop cycles at intersections are relatively high. However, by taking the proposed method, overflow at intersections was identified quickly, and a control strategy was implemented immediately, which alleviated the overflow and eventually eliminated it. The results show that the method proposed in this paper can accurately detect the occurrence of overflow, restrain and eliminate the overflow eventually.
1. Introduction
Signalized intersections play an important role in traffic flow control and related space-time control and management, dealing with essential tasks related to traffic safety and efficiency. With the continuous increase in the number of vehicles and traffic demand, the overburdened urban intersections have been afflicted by overflow, deadlock, and other phenomena, which not only lead to reduced traffic efficiency and increased vehicles emissions but also more traffic accidents. Therefore, the control of overflows at signalized intersections has always been hotspot research in the traffic control field, among which the earliest can be traced back to the 1990s.
According to the causes, the intersection overflow is mainly divided into the frequent overflow and the occasional overflow. But regardless of the causes, two key issues must be considered. One is how to detect and identify the occurrence of overflow, the other is what control strategies should be adopted to avoid deadlock at intersections when overflow occurs.
Currently, cross-sectional detection, fixed-position detection, and movement detection are methods taken for traffic detection at intersections. The cross-sectional detection includes a loop detector, a wireless magnetic detector, and an infrared detector [1]. The fixed-position detection includes a wide-area radar detector and a video detector [2–8] and the movement detection includes floating car detection and internet of vehicles detection [9–13]. Among the above-mentioned methods, the most popular one is cross-sectional detection which uses wireless magnetic detectors on each exit of the intersection to determine whether overflow occurs. However, the fundamental problem of this approach is the high false trigger rate and inaccurate identification due to the limitation of detector position and signal controller control logic. It is proved that the inaccuracy of test data directly leads to the deviation in intersection overflow identification. However, since the cost of fixed-position detection is very high and most of them are only used in fixed intersections with frequent overflow, it seems that we can do nothing about the dynamic overflow phenomenon in the road network. What’s more, in practice, overflow control strategies are frequently implemented, which disturbs the normal operation of intersections. In recent years, the development of movement detection has brought new changes to traffic detection by providing data such as vehicle trajectory, speed, and travel time, which other detection methods failed. Especially in the key sections of urban roads in China, the coverage rate of movement detection data is close to 5%, and the frequency of detection data is close to 3 s/p, which can provide data support for traffic detection.
Overflow often occurs at the existence of upstream intersections, involving at least two intersections. Therefore, some studies have focused on the generation, evolution, and impact of overflow from the perspective of the urban road network. Daganzo [14] firstly studied the overflow problem in path selection. Lago [15] discussed the causes of frequent overflow during morning peaks in urban areas. Geroliminis [16] and Zhang [17] studied the identification of frequent queuing overflows in urban road networks from a macro perspective. However, considering this problem from a macro perspective will neglect characteristics and some details when intersection overflow occurs, and make it difficult to identify in a quick and accurate manner. Because of this, others studied this problem from a meso perspective and only considered the upstream and downstream intersections. Yang [18] and Zhang [19], taking the vehicle queuing ratio and the average speed of the road section as the input and the severity of the overflow as the output, put forward the traffic overflow fuzzy identification algorithm. Zhang [20] and Shi [21] considered other intersection coordination control problems under the condition of overflow and proposed an intelligent control algorithm for the successive two intersections of the same road section. Liu [22, 23] analyzed the influence of the phase sequence on the traffic state under the traffic bottleneck and proposed a traffic-bottleneck control strategy for the successive two intersections. Liu [24] proposed the anti-overflow control method by using the combined geomagnetic detection method, which was verified by simulation and field experiments.
As a result of detecting traffic data in fixed areas, the traditional section detection method can neither effectively track the dynamic changes of traffic demand nor quickly detect special traffic problems such as overflow. Therefore, in this research, we took movement detection data to construct the indicators of detection and identification of frequent overflow at intersections and designed the overflow control strategy based on the meso perspective. Actually, movement detection data has been applied to the study of intersection control in the past few years. Comert and his colleagues [25–27] deduced an analytical expression of queue length conditional probability based on the observed probabilities of detecting vehicles in queues. Ban [28] proposed to estimate delays by travel time sampled from mobile sensors. Zhang [29] made a comprehensive analysis of the spatio-temporal characteristics of urban road capacity by using floating car data. Liu [30], Zhuang [31], and Wang [32] also used floating car data to estimate and calculate the queue length at the intersection controlled by signal lights. Chen [33] focused on the delay of signal-controlled intersections and analyzed floating car data by neural network and data fusion, effectively improving the accuracy of delay estimation. Based on the estimation method of vehicle crossing section-time, Li [34] established travel-time estimation models under different data conditions, making the error of the results less than 10%.
From the perspective of movement detection, we fully considered the shortcomings of the traditional section detector by taking into account the advantages and disadvantages of cross-section traffic detection and overflow causes. In addition, we proposed the identification method and control strategy of frequent overflow at intersections based on UAV remote sensing and vehicle trajectory data. The control strategy proposed in this paper has good applicability to typical problems, including uncoordinated upstream and downstream intersections, problems in road traffic design at intersections, unreasonable signal timing schemes at intersections, and so on.
In the next section, we will describe the causes of frequent overflow at intersections. Moreover, the technical form of UAV remote sensing monitoring overflow is given and the overflow identification index based on the floating car is introduced, which uses the second flow theory to model and design road sections. Subsequently, this paper describes the phase queue model of intersection based on moving trajectory data and further introduces the control strategy of frequent overflow. Finally, the last part introduces the main conclusions obtained by simulation field data and discusses the future work.
2. Cause Analysis of Overflow at Intersections
Traffic overflow is a phenomenon related to vehicle queues at signalized intersections, leading to traffic congestions and deadlocks in conflict zones because of such factors among others as road planning and design, traffic signal timing, and accidents.
Traffic overflow can be divided into two types: frequent overflow and secondary overflow. The causes of frequent overflow are mainly divided into internal and external causes. The internal causes generally include the unreasonable design of roads or channels at controlled intersections, traffic signal timing (main phase sequence), and so on. With the high demand for mixed traffic, it is difficult to take into account vehicles, non-vehicles, and pedestrians at the same time. The external causes are the mismatch between the storage spaces, which are generally traffic demand under the upstream and downstream intersections in the road network. Besides, there is no coordinated control between the upstream and downstream intersections, as shown in Figures 1(a) and 1(b).
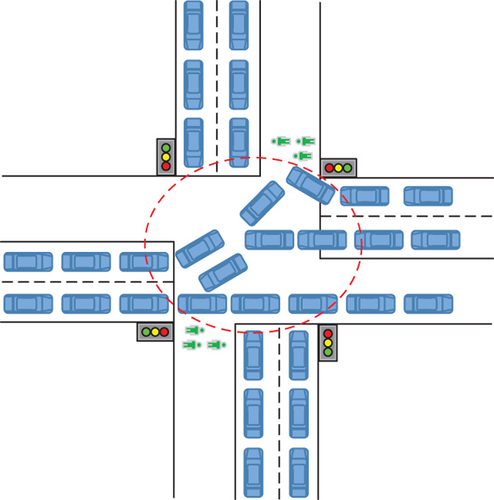
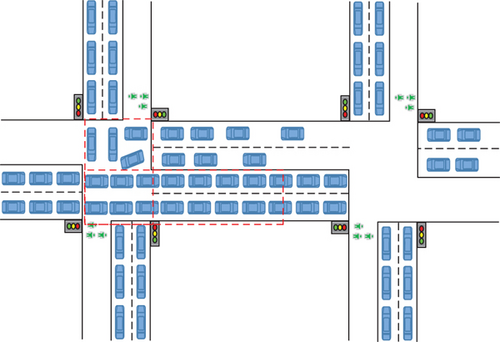
The frequent overflow caused by external causes is more likely to affect the normal operation of the signalized intersection and overall road network. Thus, this study focuses on the identification and control strategy in the effective detection area at the signalized intersection with frequent overflow.
3. Overflow Identification Index of Controlled Intersection Based on UAV Remote Sensing and Vehicle Trajectory Data
Considering that traditional section detectors have limitations such as fixed detection position, difficult implementation, high failure rate, and susceptibility to aging accuracy, movement detection methods have been developed in recent years. Its large detection range and wide variety of detection data types provide better support for the implementation of advanced control strategies for traffic signal control over urban roads. This research utilized high-precision moving trajectory data to identify the frequent overflow scenarios of urban controlled intersections.
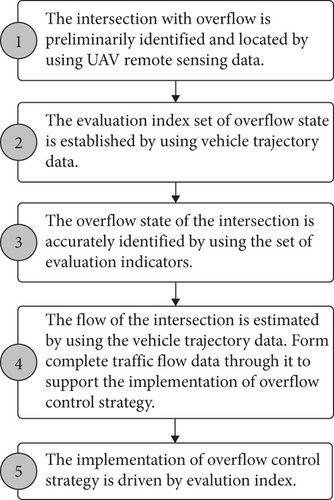
What’s more, recent years have also witnessed advancements in remote sensing detection and movement detection. Its broad detection range and wide variety of detection data types provide better support for the implementation of advanced control strategies for urban road traffic signal control. In this chapter, UAV remote sensing technology is used to preliminarily judge the occurrence of intersection overflow and high-precision motion track data for identifying frequent overflow scenes. In the next chapter, we will design an overflow control strategy driven by the evaluation index, as shown in Figure 2.
3.1. Preliminary Identification of Intersection Overflow by UAV Remote Sensing
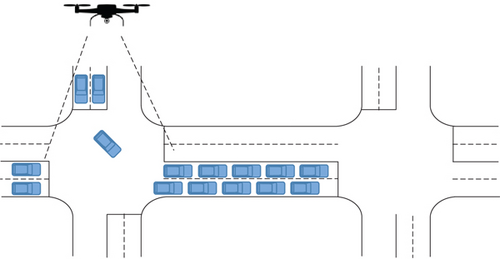
At present, the rapid development of UAV technology promotes its utility in various fields. In many Chinese cities, traffic officers use drones for traffic flow detection, traffic status recognition, traffic guidance and traffic management. As shown in Figure 3, this research preliminarily identified overflow scenes at urban intersections with police UAV remote sensing technology. To ensure the accuracy of overflow scene identification, the preliminary results have been compared with those of vehicle trajectory data identification.
3.2. Overflow Identification Index of Controlled Intersection Based Vehicle Trajectory Data
3.2.1. Model of the road
As a basic component of urban traffic networks, roads play an important role, which accounts for the development of some typical urban road sections. According to the Q- > K basic map of traffic flow, the flow rate reaches the maximum value when the road segment density is optimal. To draw a demarcation, the traffic flow state is divided into two states: non-crowded and crowded, known as the second-flow theory [35]. See details in Figure 4.

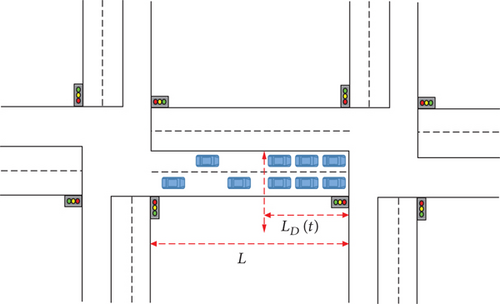
Where Nj(t)is the number of vehicles on roadjat the timet; Nj(t + 1)is the number of vehicles on roadjat the timet + 1; LD,j(t)is the equivalent queuing length at the roadjat the time t; Ljis the length of the roadj; km,jis the optimal average traffic flow density of the roadj; kj,jis the lane average traffic flow blocking density of the roadj; Mis the number of lanes of the roadj.
3.2.2. Overflow identification of controlled intersections
The design of the controlled intersection overflow identification index is based on the second-flow theory, which is to analyze the moving trajectory data and the road traffic flow characteristics.
Remark 1. The coordinate data of the floating car is used in conjunction with the map data. The basic component of the map layer data is Node and Link, the intersection is represented by Node, and the road composes multiple links, andLlink ∈ [Llink,min = 30, Llink,max = 100].
2) Calculating the speed of the non-congested traffic flow on the road network by using the K-means algorithm.
-
Algorithm 1: Non-congested traffic flow speed algorithm based on K-means.
-
Step1:The instantaneous vehicle speed data of the floating car on the road network is taken as a training sample:
-
V = {v(1), v(2), ⋯, v(m)|v(i) ∈ ℝn}
-
Step2:K cluster centroids are randomly selected (the ⸔selection of centroids should be combined with urban road network grade and road design speed):
-
U = {μ1, μ2, ⋯, μk|μj ∈ ℝn}
-
Step3:Calculate the category of eachi:
-
-
Step4:Recalculate the centroid of eachj:
-
-
Step5:Repeat steps 3 and 4 until the centroid is not changing.
-
Step6:Calculate the speed of the non-congested traffic flow on the road network:
-
-
Remark 2:The speed of a non-congested traffic flow is a stable running speed when the vehicle is not interfered with by signals and other vehicles during the operation of the road network.
Where tfis the time of the vehicle passing through the intersection with the speed of the non-congested traffic flow; tris the actual time of the vehicle passing through the intersection; tdis the delay time when the vehicle passes through the intersection.
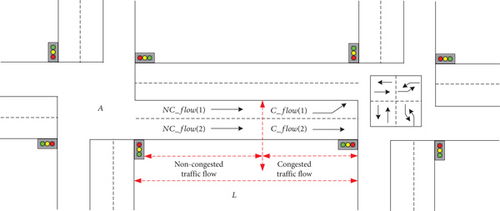
Remark 2. The phase delay index represents the median of the delay indices for all C_flow contained in the phase.
WhereOindexis the overflow index of the intersection.Stage(Dindex(non − congested))is the delay index of the non-crowded traffic flow at each stage of the intersection.
3.2.3. Establishment of Controlled Intersection Phase Queue Length Model Based on Moving trajectory data
1) Queuing model of controlled intersection phase. The controlled intersection of a typical four-phase control is selected for modeling. As shown in Figures 6(a) and 6(b).
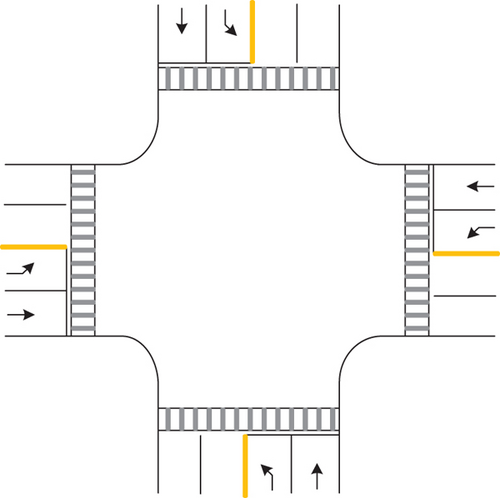
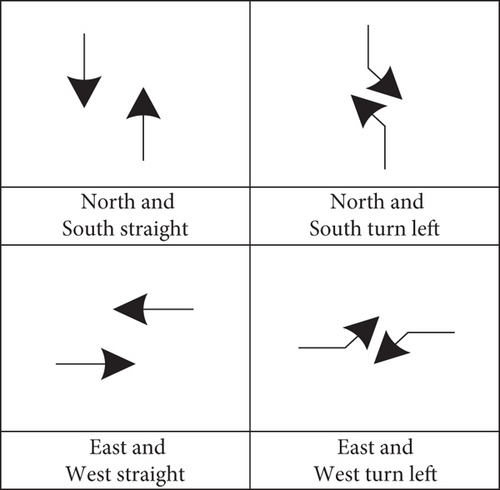
Define the queue length of each phase at the controlled intersection LD,j+n(t) using formula (4). Phase1: The queue length for north straight and south straight is indicated by LD,j+1(t)andLD,j+5(t). Phase2: The queue length for north left and south left is indicated by LD,j+2(t)andLD,j+6(t).
Phase3: The queue length for east straight and west straight is indicated by LD,j+3(t)andLD,j+7(t).
Phase4: The queue length for east left and west left is indicated by LD,j+4(t)andLD,j+8(t).
Remark 3. To avoid frequent switching of the queue length variableLD,j+i(t)betweenLD,j+i(t)andLD,j+i+4(t)in actual control, a hysteresis coefficientwis introduced, which is determined according to the current phase flow and the queue length. For example, when multiple signal periods LD,j+i(t) + w < LD,j+i+4(t) are consecutive, LD,j+i+4(t)can be used as the saturation variable of the current intersection.
Remark 4. Si = Sindicates that, for the sake of simplicity, the saturation flow rates of the phases are the same as the intersection.
2) The calculation of traffic flow at each phase of intersections was based on moving trajectory data.
Since the moving trajectory data are not all sample data in this paper, the proportion of floating cars is about 5%-7% in the whole road network, which cannot be directly used in the calculation of the queuing length of the formula (11). Therefore, the data of the floating car are used to calculate the traffic flow of each phase of the controlled intersection. The following assumptions were made to calculate the traffic flow for each phase of the intersection.
Hypothesis 5. There is a linear relationship between the block delay of the vehicle and the arrival rate of the vehicle when both the arrival rate and the road entrance capacity are constant.
Hypothesis 6. Vehicle delays can be expressed using the delay formula of Webster [36].
Hypothesis 7. The arrival rate of the vehicle and the capacity of the road entrance are constant.
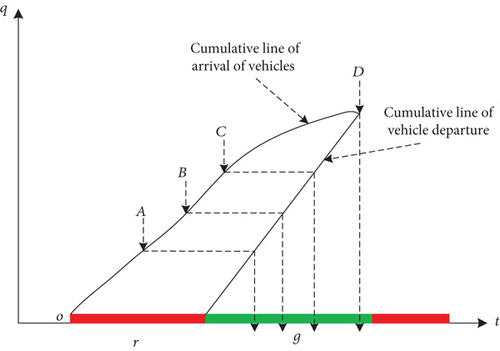
Where is the average delay time of the blocked vehicle in the j vehicle flow during the red light period.C(t)is the cycle of the controlled intersection.λj(t)is the green split of the running phase. yj(t)is the flow ratio in the j vehicle flow, yj(t) = qj+i(t)/S, qj+i(t)is the flow in the j vehicle flow,Sis the lane capacity in the j vehicle flow.
Remark 8. is obtained by analyzing the moving trajectory data accumulated for a long period of time, which is one month in this paper.
4. Control Strategy of Frequent Overflow at Intersection
The controlled intersection is the smallest unit of an urban traffic signal control system, featuring volatility, randomness, and uncertainty. For the sake of safety and efficiency, signal control strategies are based on the theory of the Reasonable Allocation of Road Rights and Conflicts [37, 38]. Therefore, the traffic demand of the non-overflow phase and the rationality should be considered in designing the control strategy of frequent overflow. The strategy structure is presented in Figure 8 in this chapter.
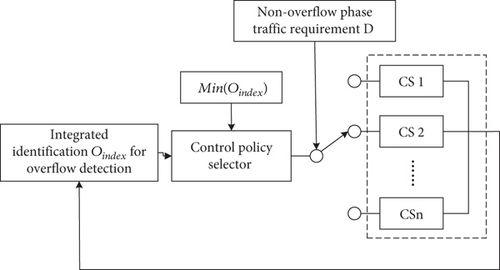
The overflow control strategy proposed in this chapter is as follows:
The overflow control strategy proposed in this chapter is as follows:
-
Algorithm 2: Control Strategy of Frequent Overflow at Intersection.
-
Step 1 calculate the overflow identification indicatorOindex, and determine whether it reaches the overflow condition, if not, continue to calculate; otherwise, enter step 2.
-
Step 2 set objective functionJand constraint D(traffic demand of non-overflow phase).
-
Step 3 design the control strategy set matched with non-overflow phase traffic demand D.
-
-
Remark 7: The global impact of the controlled intersection and the traffic demand of the non-overflow phase should be considered when frequent overflow occurs. Generally speaking, the control strategies which can be designed as demanded are as follows: Delay phase, change phase, jump phase, and insertion phase.
-
Step 4 determine whether the switching conditions are met and operate accordingly. The specific strategies are as follows.
-
Where ε > 0is the lag factor.
-
Step 5 genetic algorithm is used for the optimization
-
a) The objective function is: J = min(Oindex)
-
b) The constraint condition is:
-
c) Let the fitness function be
-
d) The design includes population size, crossover probability, and mutation probability
5. Experiment and Analysis
5.1. Experimental Design
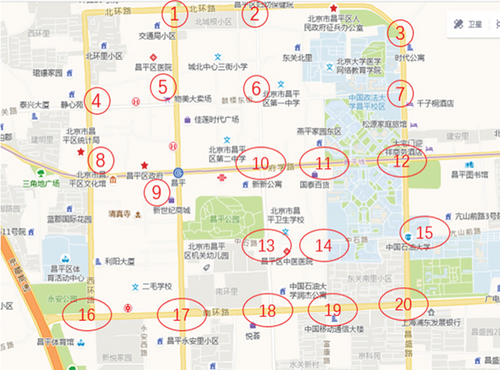
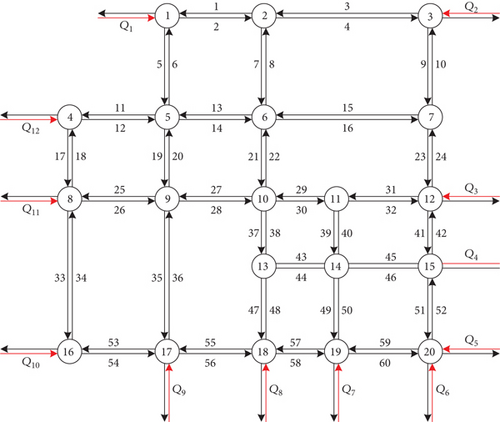
In order to verify the feasibility of the algorithm proposed in this paper, traffic data of the Changping District in Beijing were selected for simulation verification. As shown in Figure 9.
- (i)
The Changping District of Beijing is a core transportation area. Its surrounding land use system is very complicated, including large-scale enterprises, universities, and so on. Its traffic demand is heavy, and the peak of the morning and evening presents obvious tides. According to statistics, there is a frequent overflow at intersections. Therefore, this simulation object is representative
- (ii)
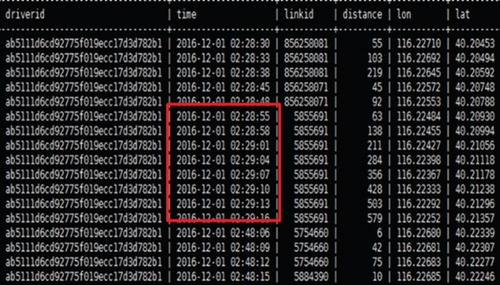
Because of the low road network sampling rate of moving trajectory data (the selected area was about 5%-7%), and its low volume of a single controlled intersection, the trunk (with 5 controlled intersections) is selected as the object of data acquisition and simulation with the intersection as the specific identification object
- (iii)
Traffic data: The moving trajectory data is provided by Shenzhi Data (Dalian) Technology Co., Ltd., and the sampling frequency is 3 s
- (iv)
Signal timing data: The timing data is provided by the Traffic Police Detachment of Changping District, Beijing
- (v)
Calibration of simulation parameters: The dynamic and static parameters of the simulation are calibrated using the field road network data (including the proportion of vehicle types, vehicle speed distribution, space headway, time headway, turning proportion, lane width, intersection type, lane distribution, etc.).
- (vi)
The algorithm is verified in OSP software and API is used to realize control strategy and moving trajectory data to generate traffic demand (the original data of the floating car (target number, location (XPos, YPos), speed (XSpeed, YSpeed)), update the target vehicle movement track).
- (vii)
The overflow control strategy set of the controlled intersection is, includes {delay phase, change phase, jump phase, and insertion phase}.
5.2. Experimental Cases Analysis
(1) Case 1: Coordinated control was not implemented at upstream and downstream intersections
The first reason for frequent overflow is that there is no coordinated control at upstream and downstream intersections, and there are so many blocked vehicles at downstream intersections that merge with the traffic flow entering the lane at upstream intersections, forming a long queue. This has resulted in overflows at upstream intersections. As shown in Figures 10 and 8 is the upstream intersection, and 9 is the downstream intersection. OSP was used for simulation analysis.

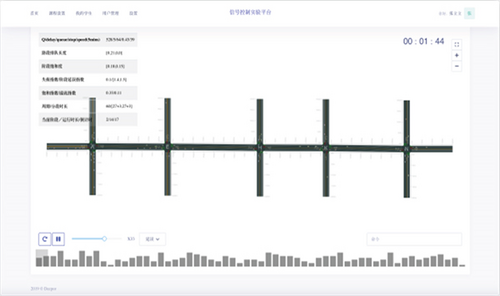
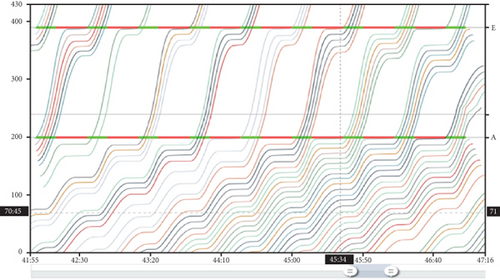
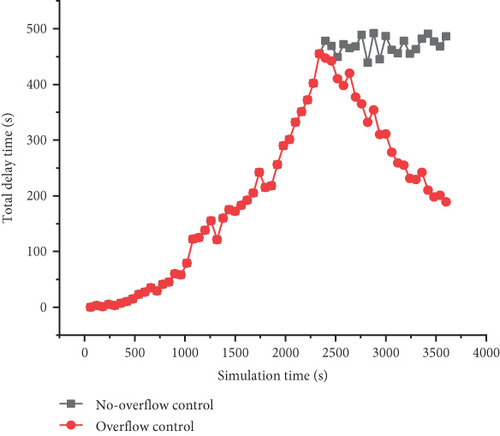
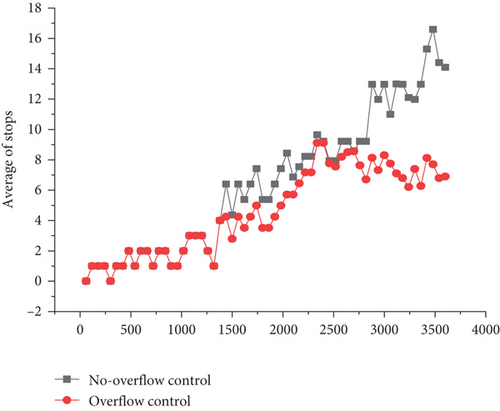
Figure 11(a) shows the space-time trajectory of the floating car when overflow occurs at intersection 8, and no overflow control strategy is adopted. Here, the analysis parameters include the total delay time and the average stopping period of all vehicles at the intersections. As can be seen from Figures 11(b) and 11(c), when the simulation proceeds to 2400 s, a serious overflow occurs at the intersection. Figures 11(b) and 11(c) show that if the control strategy were not adopted, the total delay time and the average number of stop cycles at the intersection would remain at a high level. When the overflow control strategy was adopted after 600 s, the overflow situation at the intersection was alleviated and was finally eliminated.
(2) Case 2: The signal timing scheme of upstream intersection is unreasonable
The second reason for frequent overflow is the inadequacy of the signal timing scheme at upstream intersections, which results in frequent upstream overflow despite the coordinated control of upstream and downstream intersections. As shown in Figure 12, the number 19 is the upstream intersection.
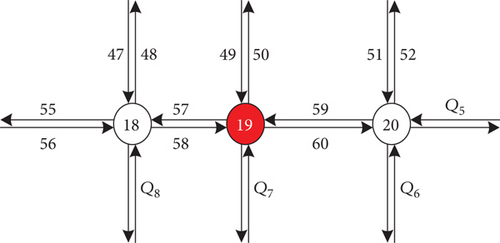
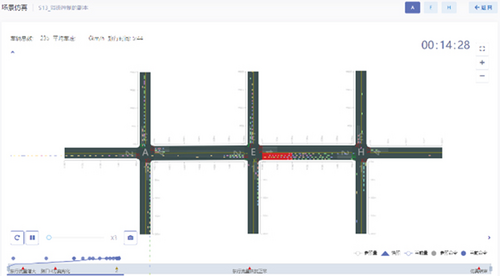
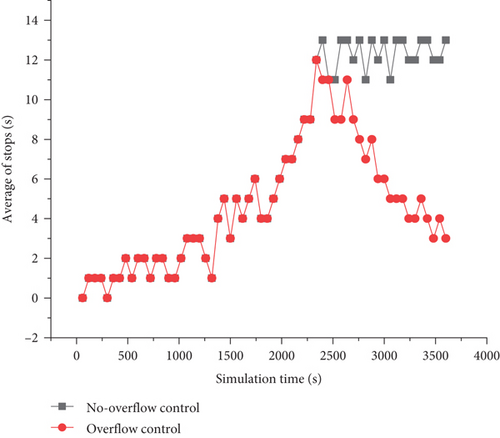
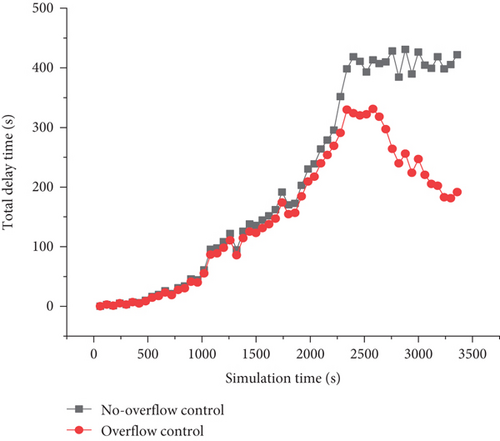
Figure 13 shows that a serious overflow phenomenon occurred at the intersection when the simulation was carried out for 2200 s. The overflow occurred 200 s earlier than that in Figure 10. The reason is that the overflow occurred faster due to unreasonable signal timing at upstream intersections. Especially between 2200 s-2800 s, the overflow control strategy did not immediately alleviate the situation due to the unreasonable timing in the early stage, resulting in excessive demand for traffic flow, making it difficult to solve this quickly. However, Figures 13(a) and 13(b) show that if the overflow control strategy was not implemented, the total delay time and the average number of stop cycles at the intersection would remain at a high level when overflow occurs. When the overflow control strategy was adopted after 600 s, the overflow situation at the intersection was alleviated, and the overflow phenomenon was finally eliminated.
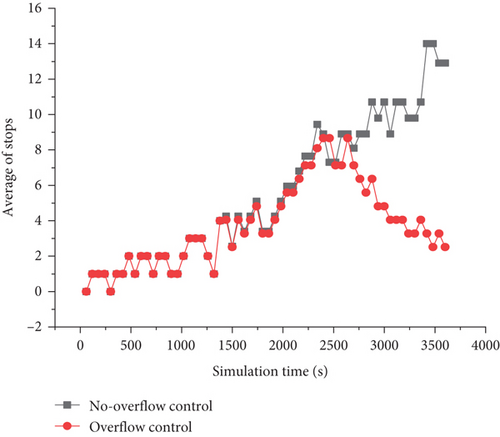
(3) Case 3: There are problems in upstream intersection road design
The third reason for frequent overflow lies in the mal-designed road traffic at intersections. As a result, the traffic organization at such intersections is chaotic, and the traffic flow is always in over-saturated demand. This affects not only the downstream intersection but also the frequent overflow of itself. Generally, such intersections can be found inside the T-junction network. As shown in Figure 14, the number 13 is the upstream intersection.
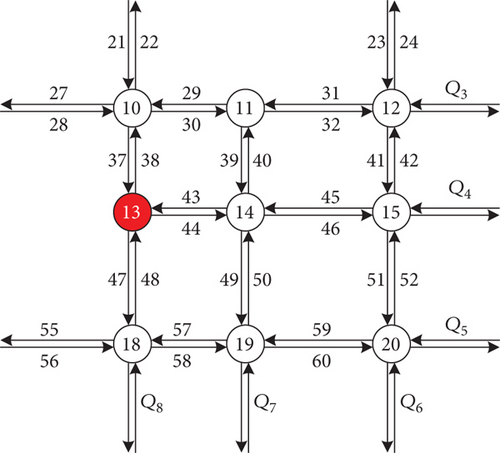
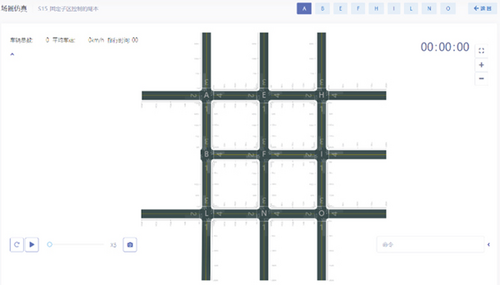
Figure 15 shows that overflow at intersections due to road design problems was more severe and happened earlier accompanied with bigger impact. Although the overflow control strategy was implemented, which alleviated the situation, the total delay time and total stops at the intersection were still at a relatively high level, as shown in Figures 15(a) and 15(b). This is because the problem of road design directly affects the formation of traffic flow, which consequently evolves to the adjacent intersection, making it a bottleneck point in the road network.
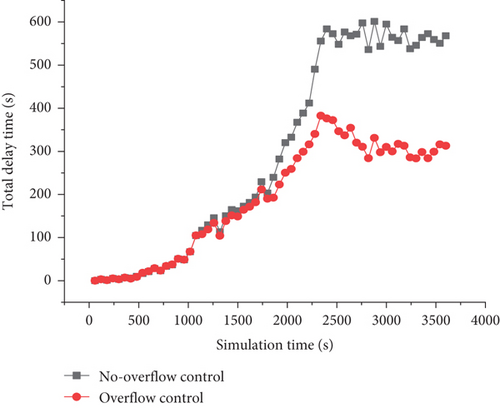
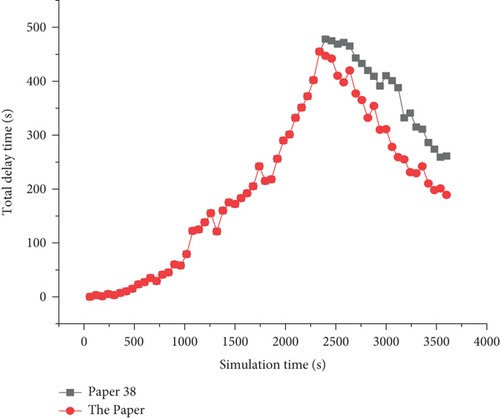
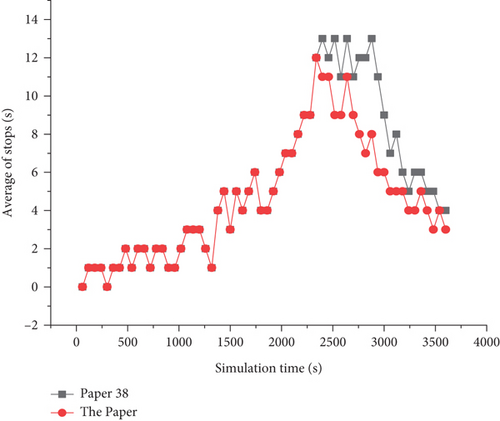
(4) Case4: The method in this paper is compared with the most widely used overflow control based on cross-section detection [38]
In this case, it is assumed that the reasonable timing scheme and road design of the upstream intersection is to more intuitively compare the control effect of the two methods. The road network and key intersection 8 shown in Figure 10 are still used as the simulation object to analyze the typical scene where there is no cooperative control at the upstream and downstream intersections, which is easy to cause overflow. As shown in Figure 16, when the simulation reached 2400 s, the overflow occurred at the key intersection 8. At this time, the method in this paper has quickly identified the emergence of the overflow state, and the overflow control strategy is activated after 600 s. However, the method [38] did not recognize the overflow state until 240 s later, and the implementation of the control strategy was delayed for 300 s. In the end, the overflow at intersections was alleviated, the method in paper [38] increased the total delay time at intersections by 13.3% and the average number of parking by 19.2%.
6. Conclusion
Starting from the problem of frequent overflow at signalized intersections, this paper first established a road section model according to the second-flow theory and set up an overflow identification index by using moving trajectory data. Then the queuing model of signalized intersections based on moving trajectory data was constructed, and the maximum queuing length was used to divide congestion flow and non-congestion flow. After that, considering the traffic demand of signalized intersections and non-overflow phase from the global perspective, the overflow control strategy set was designed with the overflow identification index as the objective function, and the genetic algorithm was used to optimize the settings. At last, the field data at Changping District in Beijing was used to verify the proposed method. The results show that it cannot only quickly suppress the overflow phase and prevent deadlock, but also meet the traffic demand of the non-overflow phase (the queue length did not exceed the maximum value).
Although the proposed method has obtained good results in identifying and controlling frequent overflow, the application of this method may be limited due to the low sampling rate of moving trajectory data. In the future, we will further improve the method so that it can be applied to urban intersections with a low sampling rate of moving trajectory data. At the same time, with the development of vehicle-road coordination [39–42] and automatic driving [43] technology, the sampling rate of moving trajectory data will be gradually increased, which will effectively improve the accuracy and control effect of this method.
- (1)
The continuous increase in the number of cars will lead to frequent overflow at intersections. Traffic management departments should strengthen the use of unmanned aerial vehicles and other advanced technology for getting inspection, discovery, and summary of the law
- (2)
Traffic management departments should integrate various data types, such as moving vehicle track data, UAV remote sensing data, fixed detector data, public transport data, spatial remote sensing data, etc. The overflow control strategy is underpinned by rich data types
- (3)
There are many causes of overflow. The traffic management department should fully analyze and classify the reasons, especially the overflow caused by road design, and cooperate with the planning and design department to alleviate the situation
Conflicts of Interest
The authors declare no conflict of interest.
Authors’ Contributions
Conceptualization, Lili Zhang and Fang Wang; Formal analysis, Lichen Su and Wei Wei; Funding acquisition, Jing Li and Pei Yu; Methodology, Lili Zhang and Fang Wang; Validation, Xinzhe Wang and Jiamei Xu; Visualization, Lichen Su, Jing Li and Wei Wei; Writing – original draft, Lili Zhang, Xinzhe Wang and Jiamei Xu; Writing – review & editing, Jing Li and Qi Zhao.
Acknowledgments
This research was supported by grants from the Beijing Municipal Natural Science Foundation (4214070), the 2021-2023 Young Talents Promotion Project of Beijing Association for Science and Technology, Natural Science Foundation of Ningxia (2022AAC03757), Cross-Disciplinary Science Foundation from Beijing Institute of Petrochemical Technology (BIPTCSF-006), General Project of Science and Technology Plan of Beijing Municipal Education Commission (KM201910017006, KM202010017011), Teaching Reform project of Beijing Institute of Petrochemical Technology (ZD202103001), Beijing Urban Governance Research Base Project of North China University of Technology (21CSZL34), National Innovation and Entrepreneurship Training Program for College Students (2021 J00130, 2021 J00131). The referees’ valuable suggestions are greatly appreciated.
Open Research
Data Availability
The data includes moving trajectory data, signal timing data, and geomagnetic detector data in this paper. The moving trajectory data was provided by Shenzhi Data (Dalian) Technology Co., Ltd., and the signal timing data was provided by the Beijing Changping District Traffic Police Detachment. The data provided was for use in this paper only because it involves commercial and government requirements for the use of data.


