Research on Bridge Structural Damage Identification
Abstract
The traditional identification methods have limited ability to identify damage location of bridge structures. Therefore, a bridge structural damage location identification method based on deep learning is proposed. In addition, the sigmoid function is the activation function, and the cross entropy is the cost function. Meanwhile, take the Gaussian noise as the addition method and take the softmax as the classifier. So the constructed SDAE deep learning model can realize damage location identification of the simply supported the continuous beam bridges. Compared with the traditional identification methods of bridge structures, namely BP network and SVM, the proposed method shows higher identification accuracy and antinoise performance. Here, the average identification accuracy of the method for continuous beam bridge is 99.8%. As can be seen that the proposed method is more suitable for practical bridge structure damage location identification.
1. Intoduction
The development of social economy is inseparable from transportation. Bridge, as an important part of transportation, plays an important role in connecting the north and south. The safety of its structure is related to the safety of transportation, and it affects people's life. Once the bridge structure is seriously damaged, it will inevitably cause traffic accidents. In order to ensure the safe operation of bridges, it is of great significance to identify the damage of bridge structures. With the development of data transmission and processing technology, the nondestructive detection of bridge structures has been widely used. At present, the nondestructive detection and identification methods of bridge structures are mainly based on vibration identification methods, including the method based on modal domain data, the method based on time domain data, the method based on time-frequency domain data, and the method based on intelligent algorithm. For example, Xijun Ye and Boscato et al. proposed an adaptive signal denoising method based on genetic algorithm and singular value decomposition. By selecting SNR as fitness function, the genetic algorithm is introduced to automatically optimize p and r parameters. Then the inverse singular value decomposition is performed to obtain the denoised signal[1, 2]. This method is helpful to improve the identification accuracy of bridge structural damage location. Considering that the long-term effect of vehicle load is an important cause of fatigue, local damage, aging, reliability reduction, and so on, Jihwan Kim and Lili Li et al. proposed a bridge vehicle load model and carrying capacity evaluation method based on dynamic weighing system [3, 4]. Xiao-qin Li and Shiqiang Qin et al. discussed the strategy and scheme of multiscale finite element simulation of long-span bridge structures with the goal of structural damage diagnosis and safety assessment[5, 6]. Based on the analysis of the error sources of the finite element model, an error hierarchical correction method for the long-span bridges structure model is proposed. In addition, based on the finite element modeling and model modification process of cable-stayed bridge of the Runyang Yangtze River Bridge, a multiscale finite element simulation method for damage diagnosis and safety assessment of long-span cable-stayed bridge is proposed. Xianzheng Yu and Marco Furinghetti et al. established and modified the finite element model of the bridge structure to accurately simulate the behavior and working state of the bridge structure [7, 8]. On this basis, combining the finite element forward analysis with the signal inverse identification to evaluate the daily work of the bridge and the impact of various disasters on the structure. To a certain extent, the above research methods have realized the location of damage parts to different bridge structures, but the positioning accuracy and antinoise performance need to be improved. Therefore, in order to improve the identification accuracy and antinoise performance of the algorithm for bridge structure damage location, and based on deep learning model, this paper proposes a bridge structure damage location identification method based on stacked denoising autoencoder.
1.1. Introduction to SDAE Model
SDAE is a common model in deep learning, it is formed by stacking several denoising autoencoders. However, on the basis of autoencoder, the denoising autoencoder is a network. First, it can add noise to the training data and randomly mask part of training data. Subsequently, it forces the model to learn denoising and restore the input data. Therefore, to understand the principle of SDAE, the first is to understand the structure and training mode of autoencoder and denoising autoencoder.
1.2. Introduction to Autoencoder
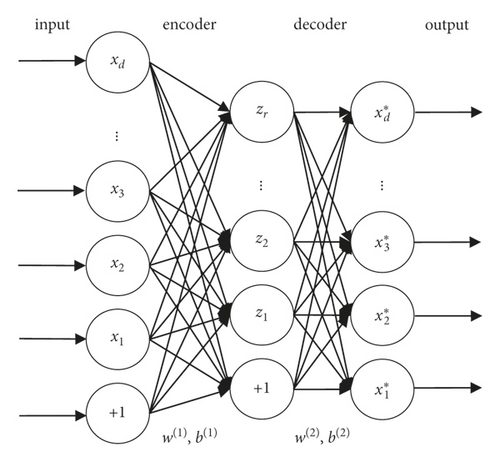
Formula (1) shows that x represents the input vector, z represents the encoder output vector, W(1) represents the input weight of the hidden layer, b(1) represents the input bias of the hidden layer, and s represents the activation function.
Formula (2) shows that x ′ represents the output matrix, W(2) represents the input weight of the output layer, and b(2) represents the input bias of the output layer.
The weight and bias can be updated according to the error back propagation and gradient descent algorithm, and the optimal parameter θ can be obtained.
1.3. Denoising Autoencoder
Denoising autoencoder takes the data with added noise as input and outputs the predicted original data without noise through training. Its denoising principle is shown in Figure 2. In the figure, x represents the original data, x1 represents the data with noise, and y represents the feature obtained by encoding x1 in the hidden layer of the denoising autoencoder, Z represents the original data restored by decoding y, andLD (x,z) represents the error function.
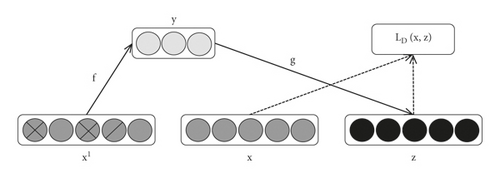
The weight and bias can also be updated by using error back propagation and gradient descent algorithm, and the optimal parameter θ can be obtained.
For SDAE, the training method is that initially determine the parameters of a single denoising autoencoder through unsupervised learning, then use the BP algorithm to conduct supervised learning for all denoising autoencoders, and fine-tune the global parameters.
1.4. BP Algorithm Parameter Tuning
Formula (6) shows that M represents the total number of layers; Nk represents the total number of neurons in k layer; represents the connection weight between neuron i of k-1 layer and this neuron; represents the neuron offset value; and represents the output of neuron i of k-1 layer.
It can be seen from the above analysis that SDAE can obtain the most representative features of the original samples from the input samples with noise through multiple stacked denoising autoencoders, which is conducive to enhancing the robustness of the model. Considering the possibility of distortion in the data collection of the bridge structure, which is similar to adding noise data to the real data, SDAE can be used to analyze the data of the bridge structure. Therefore, this paper proposes an identification method of bridge structural damage location based on SDAE.
2. Bridge Structural Damage Location Identification Based on SDAE
2.1. SDAE Model Construction
2.1.1. Activation Function Selection
2.1.2. Cost Function Selection
Among them, and xi represent the predicted value and the true value, respectively. N represents the total number of training samples.
2.1.3. Selection of Noise Adding Method
Here, xi and represent the input data before and after processing noise i, respectively, η represents noise level; and normrnd(0,1) represents Gaussian noise with mean value 0 and variance 1.
2.1.4. Classifier Selection
On the basis of the above analysis, the SDAE model constructed in this paper is shown in Table 1.
| Deep learning model | Activation function | Cost function | Noise adding mode | Classifier |
|---|---|---|---|---|
| SDAE | Sigomid | Cross entropy cost function | Gaussian noise | Saftmaxclassifier |
2.2. Identification Process
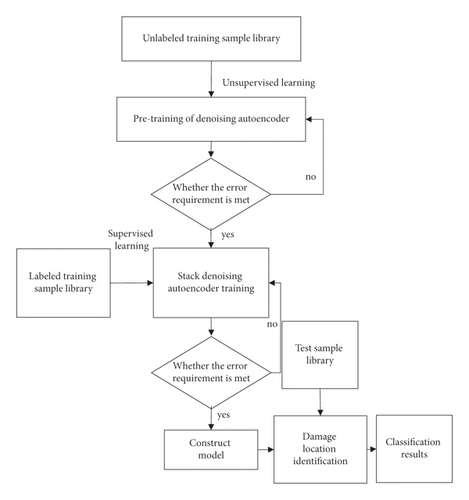
According to the constructed SDAE model, the identification method of bridge structural damage position is designed as Figure 3. First of all, the bridge structure sample data are divided into unlabeled sample and labeled sample data set. Then, the denoising autoencoder is used to conduct unsupervised learning and pretraining for unlabeled data, and the samples meeting the error requirements are input into SDAE for training. Meanwhile, the labeled samples are trained by SDAE for supervised learning and pretraining. When the training results meet the error, the SDAE model is constructed. At last, the constructed SDAE model is adopted to identify the damage locations of test samples and output the results. It can be seen that the bridge structural damage location identification based on SDAE is realized.
3. Simulation Experiment
3.1. Experimental Environment
This experiment is simulated on ANSYS finite element analysis software and MATLAB platform. The net span of the simply supported beam bridge model is 10 m, the concrete grade is C50, the beam cross-sectional area is 0.2 m2, the inertia moment of unit section is 0.0042 m4, the beam height is 0.5 m, the density is ρ = 2500kg/m3, and the elastic modulus is 3.5 × 10⁴ MPa[26–29]. Its unit division and plate-beam interface are shown in Figure 4. As can be seen from the figure, the simply supported beam bridge model is divided into 20 units and 21 nodes. Node 1 and node 21 are end nodes of the bridge, which are fixed hinge supports and sliding supports, respectively. Among them, the main beam is simulated by Bean3 unit, the horizontal and vertical displacements are used for node 1 constraint, and the vertical displacements are used for node 21 constraint.

The continuous beam bridge model is a two-span continuous beam bridge. The net span is (24 + 24) m, the concrete grade is C50, the beam sectional area is 0.18 m2, the inertia moment of unit section is 0.0054 m4, the beam height is 0.6 m, the density is ρ = 2500kg/m3, and the elastic modulus is 3.5 × 10⁴ MPa. The unit division and plate-beam interface are shown in Figure 5. As can be seen from the figure, the continuous beam bridge model was divided into 24 units and 25 nodes. The length of each unit is 2m. Node 1, node 13, and node 25 are end nodes of the bridge, which are interactive supports, fixed hinge supports, and sliding supports, respectively. Among them, the main beam is simulated by Bean3 unit. The node 1 and node 25 are constrained by displacement cross the bridge, vertical angle along the bridge, and vertical displacement. The node 13 is constrained by displacement cross the bridge, displacement along the bridge, vertical displacement, and vertical angle along the bridge.

3.2. Damage Samples of Bridge Structures
3.2.1. Damage Index and Training Sample Database Determination
Combining the various literature, the acceleration response value of the measuring point is selected as the damage index of the bridge structure position identification. Totally, 270 groups of measuring point accelerations are used as a training sample database for damage location identification of simply supported beam bridges. In total, 12600 groups of measuring point accelerations are selected as a training sample database for damage location identification of continuous beam bridges.
3.2.2. Simply Supported Beam Bridge
Damage Condition. A moving load with a directional speed of 18 km/h is placed on the bridge, and the reduction of elastic modulus of material is defined as the damage degree. If the elastic modulus is reduced by 10%, the damage degree is 10% and substituted by the concentrated force F = 100 kN. Finally, there are seven damage conditions in this experiment, including no damage state and certain damage degree of a damage unit. The corresponding damage labels are shown in Table 2.
| Damage condition number | Loading condition | Damage unit | Damage degree | Label | ||||
|---|---|---|---|---|---|---|---|---|
| Boundary conditions | Concentration force size (kN) | Movement speed | Start | End | ||||
| JZLQ1 | Boundary conditions of simply supported beam | 100 | 18 km/h | Node 1 | Node 21 | No | No | 1st category |
| JZLQ2 | Boundary conditions of simply supported beam | 100 | 18 km/h | Node 1 | Node 21 | No. 3 | 45% | 2nd category |
| JZLQ3 | Boundary conditions of simply supported beam | 100 | 18 km/h | Node 1 | Node 21 | No. 3 | 55% | 2nd category |
| JZLQ4 | Boundary conditions of simply supported beam | 100 | 18 km/h | Node 1 | Node 21 | No. 7 | 5% | 3rd category |
| JZLQ5 | Boundary conditions of simply supported beam | 100 | 18 km/h | Node 1 | Node 21 | No. 7 | 95% | 3rd category |
| JZLQ6 | Boundary conditions of simply supported beam | 100 | 18 km/h | Node 1 | Node 21 | No. 11 | 25% | 4th category |
| JZLQ7 | Boundary conditions of simply supported beam | 100 | 18 km/h | Node 1 | Node 21 | No. 11 | 55% | 4th category |
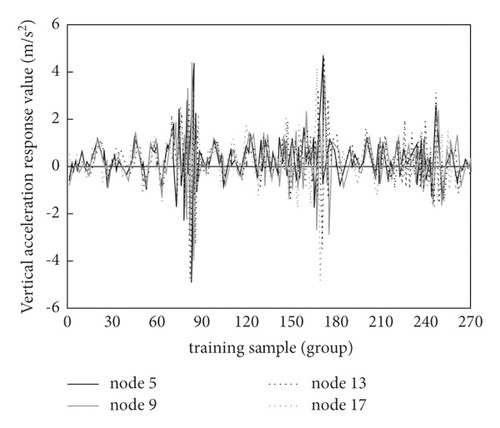
Sample Preprocessing. Under the action of moving load, the vertical acceleration values of nodes 5, 9, 13, and 17 in the 3 s of the simple beam bridge are randomly selected as the damage index [30]. Among them, the corresponding acceleration-time curve to each node in nondamage state is shown in Figure 6.
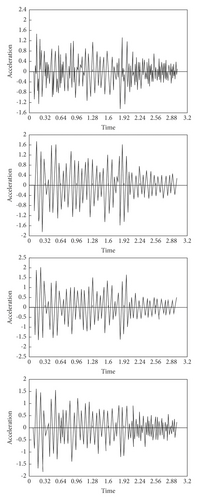
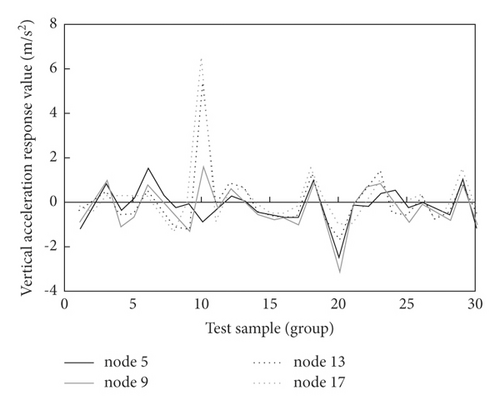
Z-score is used to conduct standardized preprocessing for the training samples and test samples, and sample I for SDAE training and test can be obtained, as shown in Figure 7.
3.2.3. Continuous Beam Bridge
Damage Condition. A moving load with a directional speed of 18 km/h is placed on the bridge, and the reduction of elastic modulus of material is defined as the damage degree. If the elastic modulus is reduced by 10%, the damage degree is 10%, and substituted by the concentrated force F = 100 kN. In order to be different from simply supported beam bridge, multiple unit damage is added in the experiment. Finally, the damage label database of the set test samples is shown in Table 3.
| Damage condition number | Loading condition | Damage unit | Damage degree | Label | ||||
|---|---|---|---|---|---|---|---|---|
| Boundary conditions | Concentration force size (kN) | Movement speed | Start | End | ||||
| LXLQ1 | Continuous beam bridge boundary conditions | 100 | 18 km/h | Node 1 | Node 25 | 3 | 40% | 1st category |
| LXLQ2 | Continuous beam bridge boundary conditions | 100 | 18 km/h | Node 1 | Node 25 | 10 | 15% | 2nd category |
| LXLQ3 | Continuous beam bridge boundary conditions | 100 | 18 km/h | Node 1 | Node 25 | 21 | 55% | 3rd category |
| LXLQ4 | Continuous beam bridge boundary conditions | 100 | 18 km/h | Node 1 | Node 25 | 6.9 | 30%, 30% | 4th category |
| LXLQ5 | Continuous beam bridge boundary conditions | 100 | 18 km/h | Node 1 | Node 25 | 11, 19 | 15%, 15% | 5th category |
| LXLQ6 | Continuous beam bridge boundary conditions | 100 | 18 km/h | Node 1 | Node 25 | 5, 22 | 30%, 60% | 6th category |
| LXLQ7 | Continuous beam bridge boundary conditions | 100 | 18 km/h | Node 1 | Node 25 | 4, 8, 11 | 10%, 10%, 10% | 7th category |
| LXLQ8 | Continuous beam bridge boundary conditions | 100 | 18 km/h | Node 1 | Node 25 | 9, 15, 20 | 45%, 45%, 45% | 8th category |
| LXLQ9 | Continuous beam bridge boundary conditions | 100 | 18 km/h | Node 1 | Node 25 | 5, 15, 20 | 60%, 60%, 60% | 9th category |
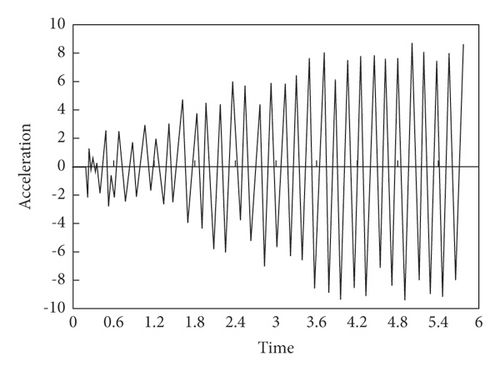
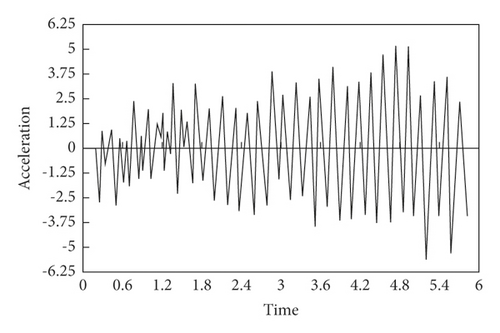
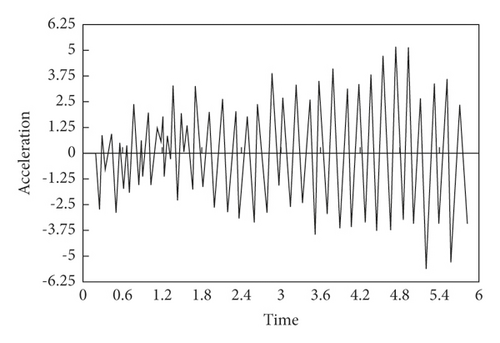
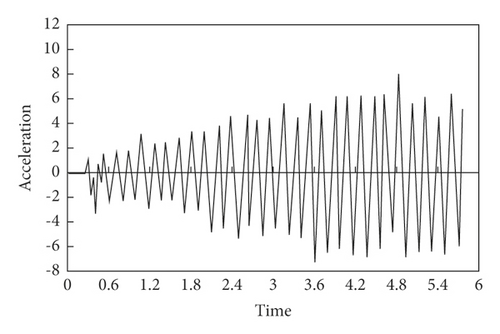
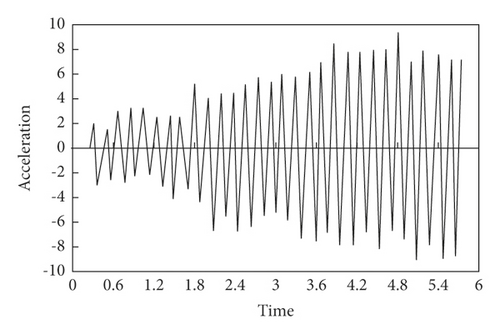
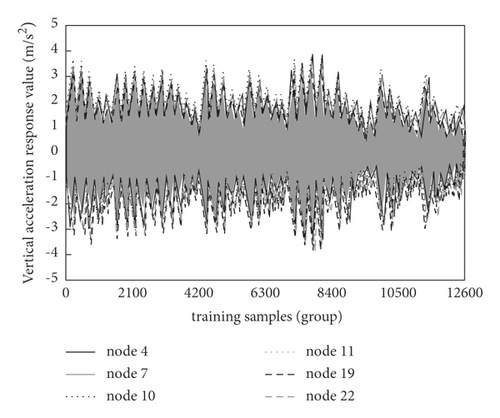
Sample Preprocessing. Under the action of moving load, all the vertical acceleration response values of nodes 4, 7, 10, 11, 19, and 22 within 5.8 s of continuous girder bridge are randomly selected as the training sample database. Among them, the damage degree is 40%, and the damage unite is No. 3. The corresponding acceleration-time curve of each node at this unit state is shown in Figure 8.
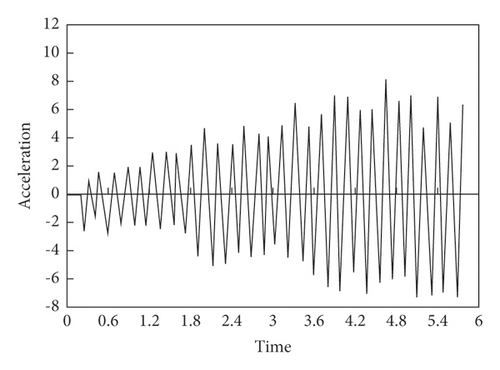
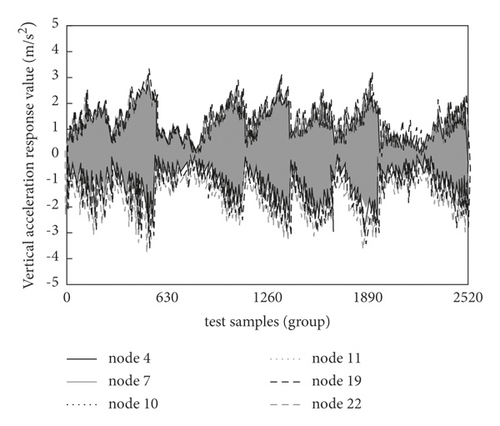
Z-score is adopted to perform standardized preprocessing for training samples and test samples, and sample II for SDAE training and test can be obtained, as shown in Figure 9.
3.3. Results and Analysis
3.3.1. Damage Location Identification of Simply Supported Beam Bridges
Analysis of Recognition Results. The test sample of preprocessed sample I is used as the input data of SDAE, and the recognition results of deep learning model are shown in Table 4. In the table, the first category represents nondamaged unit, the second category represents the No. 3 damaged unit, the third category represents the No. 7 damaged unit, and the fourth category represents the No. 11 damaged unit. As can be seen from the table, the identification accuracy of the proposed method for all damage categories has been reached 93.3%. Among them, the recognition accuracy of undamaged unit and No. 7 damaged unit is 100%, the recognition accuracy of No. 3 damaged unit is 90%, and the recognition accuracy of No. 11 damaged unit is 88.9%. Therefore, the proposed method for the each damage unit location identification of simply supported beam bridge has certain effectiveness.
| Damage category | Total number of actual categories | The number of accurate classifications | Accuracy (%) |
|---|---|---|---|
| 1st category | 1 | 1 | 93.33 |
| 2nd category | 10 | 9 | |
| 3rd category | 10 | 10 | |
| 4th category | 9 | 8 |
In order to verify the effectiveness of the proposed method for damage location identification of simply supported beam bridges with noise data, 5%, 10%, and 15% Gaussian noise are added to the input data of training data and test data in sample I, respectively. Meanwhile, the proposed method is adopted to identify, and the results are obtained as shown in Table 5. As can be seen from the table, under different noise conditions, the proposed method has a high recognition accuracy, which reaches 93.3%. Therefore, the SDAE proposed in this paper can effectively identify the location of each damage unit of a simply supported beam bridge.
| Project | The number of actual categories | Correct classification at 0% noise | Correct classification at 5% noise | Correct classification at 10% noise | Correct classification at 15% noise |
|---|---|---|---|---|---|
| 1st category | 1 | 1 | 1 | 1 | 1 |
| 2nd category | 10 | 9 | 9 | 9 | 9 |
| 3rd category | 10 | 10 | 10 | 10 | 10 |
| 4th category | 9 | 8 | 8 | S | 8 |
| Accuracy | —— | 93.33% | 93.33% | 93.33% | 93.33% |
Performance Comparison. In order to verify the identification performance of the proposed method, the proposed method and the traditional damage location identification methods of simply supported beam bridges, such as BP network and SVM, are used to identify sample I under the condition of no noise. The results are shown in Table 6. As can be seen from the table, compared with BP network and SVM comparative identification methods, the proposed identification method based on SDAE has the highest identification accuracy and a certain advantages.
| Project | The number of actual categories | The SDAE algorithm is correct | The BP neural network algorithm is correct | The SVM algorithm is correct |
|---|---|---|---|---|
| 1st category | 1 | 1 | 0 | 0 |
| 2nd category | 10 | 9 | 1 | 6 |
| 3rd category | 10 | 10 | 7 | 3 |
| 4th category | 9 | 8 | 3 | 3 |
| Accuracy | —— | 93.33% | 36.67% | 40.00% |
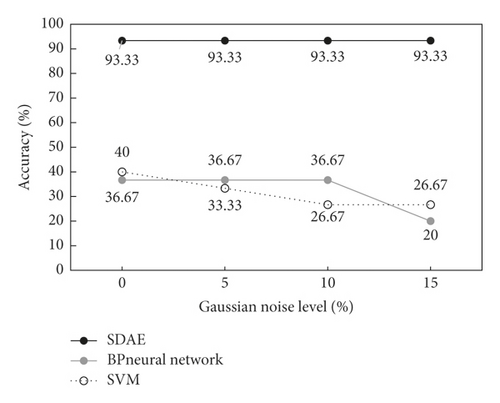
Under different Gaussian noise conditions, the recognition results of BP network, SVM, and the proposed method are shown in Figure 10. As can be seen from the figure, compared with the traditional identification methods BP network and SVM, the proposed method has obvious advantages in recognition accuracy. With the increase of noise level, the recognition accuracy of both BP network and SVM shows a decreasing trend, and the recognition accuracy of the proposed method remains stable. Therefore, the identification performance of the proposed method is better than that of traditional identification methods for simply supported beam bridges, and it has certain practical application value.
3.3.2. Damage Location Identification of Continuous Beam Bridges
Analysis of Recognition Results. The test samples of preprocessed sample II are used as the input data of SDAE, and the recognition results of deep learning model are obtained as shown in Table 7. As can be seen from the table, the average identification accuracy of the method proposed for multiple damage units of continuous beam bridges is higher, which reaches 99.8%. Among them, when the damage unit is No. 3, the recognition accuracy of the first damage category is 98.2%. When the damage unit is No. 10, the recognition accuracy of the second damage category is 98.2%. The recognition accuracy of other damage categories containing multiple damage units is 100%. Therefore, compared with a single damage unit, the method proposed in this paper has a higher identification accuracy for the damage position of continuous girder bridges with multiple damage units simultaneously. The reason is that the more the damage units are, the greater the impact on the carrying capacity of the bridge structure is, and the more obvious the topological relationship between the damage category and the acceleration response value of the monitoring point is. It can be seen that it is conducive to SDAE classification, so as to improve the identification accuracy of the algorithm.
| Damage category | Total number of actual categories | The number of accurate classifications | Accuracy (%) |
|---|---|---|---|
| 1st category | 280 | 275 | 99.76 |
| 2nd category | 280 | 279 | |
| 3rd category | 280 | 280 | |
| 4th category | 280 | 280 | |
| 5th category | 280 | 280 | |
| 6th category | 280 | 280 | |
| 7th category | 280 | 280 | |
| 8th category | 280 | 280 | |
| 9th category | 280 | 280 |
In order to verify the effectiveness of the proposed method in identifying the damage position of continuous beam bridges with noise data, the 5%, 10%, and 15% Gaussian noise are added to the input data of training data and test data in sample II. And the proposed method is used to identify the damage position, and the results are obtained as shown in Table 8. It can be seen from the table that under different noise conditions, the method proposed in this paper has high recognition accuracy, with an average recognition accuracy of 99.8%. Therefore, the proposed SDAE can effectively identify the location of each damage unit of continuous beam bridges, and it has certain practical application value.
| Project | The number of actual categories | Correct classification at 0% noise | Correct classification at 5% noise | Correct classification at 10% noise | Correct classification at 15% noise |
|---|---|---|---|---|---|
| 1st category | 280 | 275 | 275 | 275 | 275 |
| 2nd category | 280 | 279 | 279 | 279 | 279 |
| 3rd category | 280 | 280 | 280 | 2S0 | 280 |
| 4th category | 280 | 280 | 280 | 280 | 280 |
| 5th category | 280 | 280 | 280 | 280 | 280 |
| 6th category | 280 | 280 | 280 | 280 | 280 |
| 7th category | 280 | 280 | 280 | 280 | 280 |
| 8th category | 280 | 280 | 280 | 280 | 280 |
| 9th category | 280 | 280 | 280 | 280 | 2S0 |
| Accuracy | — | 99.76% | 99.76% | 99.76% | 99.76% |
Performance Comparison. In order to verify the identification performance of the proposed method, the proposed method and the traditional damage location identification methods of continuous beam bridges, such as BP network and SVM, are used to identify sample I under the condition of no noise. The results are shown in Table 9. As can be seen from the table, compared with BP network and SVM comparative identification methods, the proposed identification method based on SDAE has the highest identification accuracy, which has certain advantages.
| Project | The number of actual categories | The SDAE algorithm is correct | The BP neural network algorithm is correct | The SVM algorithm is correct |
|---|---|---|---|---|
| 1st category | 2S0 | 275 | 0 | 0 |
| 2nd category | 280 | 279 | 50 | 34 |
| 3rd category | 280 | 280 | 0 | 0 |
| 4th category | 280 | 280 | 19 | 2 |
| 5th category | 280 | 280 | 17 | 1 |
| 6th category | 2S0 | 280 | 24 | 0 |
| 7th category | 2S0 | 280 | 48 | 6 |
| 8th category | 280 | 280 | 63 | 0 |
| 9th category | 280 | 280 | 43 | 223 |
| Accuracy | — | 99.76% | 10.48% | 10.56% |
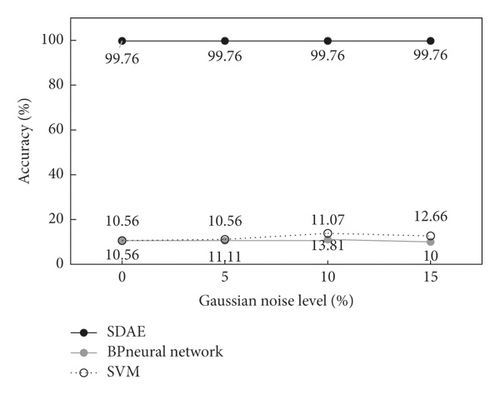
Under different Gaussian noise conditions, the recognition results of BP network, SVM, and the proposed method are shown in Figure 11. As can be seen from the figure, compared with the traditional identification methods BP network and SVM, the proposed method has obvious advantages in recognition accuracy. With the increase of noise level, the recognition accuracy of both BP network and SVM method shows small fluctuation, while the recognition accuracy of the proposed method always maintains a high recognition accuracy, which is up to 99.8%. Therefore, the identification performance of the proposed method is better than that of traditional identification methods for continuous beam bridges, and it has a certain practical application value.
4. Conclusion
To sum up, the damage location identification method of bridge structure based on deep learning proposed in this paper can effectively identify the damage location of simply supported and continuous beam bridges by using SDAE. Compared with the traditional bridge structure recognition method BP network and the SVM method, the proposed method shows a higher recognition accuracy and antinoise performance. And the average identification accuracy for continuous beam bridge of multiple damage unit reaches 99.8%. It can be seen that the proposed method has obvious advantage on the damage location identification of actual bridge structures. Although there are some achievements, all the conclusions are based on software simulation, namely theory. Obviously, it lack of practical test support, so the proposed method has certain limitations. What is more, the constructed damage index is relatively single. In the practical application, the damage index of bridge structure is complex and diverse, so the selection of damage index needs to be further strengthened. Meanwhile, the practicality and persuasiveness of the proposed method also need to be improved.
Conflicts of Interest
The authors declare that they have no conflicts of interest regarding this work.
Open Research
Data Availability
The experimental are available from the corresponding author upon request.


