[Retracted] Optimization and Quality Evaluation of Online Teaching Courses Based on Machine Learning
Abstract
Due to the epidemic, online courses have become an important form of school courses, so it is very necessary to optimize online teaching courses. This paper analyzes the survey data by using factor analysis and ANP model and finally determines 18 evaluation indicators by scoring the evaluation indicators by the respondents. The analysis of these 18 indicators shows that the average score of goal setting is the highest, and the average score of interface design is the highest. Lowest: the low-scoring portion of the course interaction is the most important aspect of developing a suggested strategy, and setting the environment, stimulating interest, interface design, and performance evaluation are also important factors in improving the quality of online courses. It can be seen that teacher-student interaction, media presentation, and interest stimulation are three more important factors, and these three factors are relatively less important for performance evaluation, course duration, and language level. It can be seen that learners pay relatively low attention to performance evaluation and pay the highest attention to intelligent learning. These indicators with high attention are improved to optimize online teaching courses.
1. Introduction
The online education quality assessment system is established on the basis of the analytical hierarchy process, the importance of each subsystem and indicator in the online education quality assessment system is determined, and the safety rules of the risk values of each indicator are determined based on up to practical experience. The return model is established by the BP neural networks, and the model weights and thresholds are optimized by the particle swarm algorithm. Based on the online education quality assessment model in the BP neural network, the model parameters are constantly adjusted, the appropriate function is selected, and the particle swarm algorithm used in neural network learning and teaching is optimized. The scientificity of the questionnaire has been verified by means of reliability and validity tests. Based on the score results, combined with the weighting factors of each indicator in the Online Course Quality Indicator System, the main factors influencing the quality of online courses are obtained. Based on the study data, descriptive statistics, analysis of variance, and Pearson’s correlation coefficient were used to test the study hypotheses and obtain valuable empirical results. By comparing this model with the standard BP model, the results show that the accuracy of the PSO-BP model is higher than that of the normal BP model, and the PSO-BP model successfully conquers the shortcomings of the BP neural networks [1]. In the era of more and more popular online learning, it is imperative to build an education evaluation system for online courses. In the absence of face-to-face communication and accurate assessment of student skills, online learning ignores process assessments, resulting in one-sided and oversimplified assessments. After analyzing the existing problems and evaluation data, an optimized online evaluation system is proposed for course learning. Based on examples from language and programming courses, it has been demonstrated that the above optimization assessment strategies can help students improve their learning and make better use of the course [2]. Evaluation of the MOOC bot based on previous Chatterbox Challenge and Loebner Prize competition questions showed that it was able to give correct answers during most of the test period and demonstrated the ability to expand conversations. The advantages of MOOC bots, such as 24/7 service, support for different time zones, multidomain knowledge, and simultaneous sharing of multiple pages, exceed existing limitations [3]. To select effective representations of sentiment, we use the Multiswarm PSO (MSPSO) method, which generates many different swarms of particles in different cross-training subsets. These groups are used to find the best features according to F-Measure Fit. Experimental results on real datasets show that MSPSO can efficaciously decrease the redundancy of version functions and accommodate discriminants. Compared to traditional methods of characteristic selection, MSPSO can achieve better show when choosing the identical dimensions. In addition, the results of the user survey showed that 72.2% of the respondents noted the usefulness of the identification outcome and the utility of job selection [4]. Blackboard teaching is not only a supplement and extension of classroom teaching but also optimizes teaching evaluation from four aspects: learning objectives, teaching shapes and ways, teaching detail, and education. Based on the analysis of the course characteristics and the needs of teachers and students, it is emphasized how to push forward a more complete achievement of the learning objectives and how to deliver a more complete, flexible, humane learning content, open and better prepared. In order to reflect more diverse teaching forms and methods, promote evaluation teaching to be more comprehensive, objective, and efficient, optimize the entire education system, develop blackboard courses, understand material structure, interactive links and evaluation models, and build overall training courses [5]. Autonomous Online Learning Optimization (AOLO) combines Deep Neural Networks (DNNs) with FEM computations. DNN learns and replaces the objective based on design variables. DNN-based optimal prediction dynamically generates a small amount of training data. Adapting to fresh practice data and providing better predictions in convergent areas of interest, DNN is a self-directed online learning method that embeds deep learning into optimization methods to accelerate the learning and optimization process [6]. Based on the exploration of online course evaluation data with big data, an optimization framework has been proposed for evaluating online courses based on process assessment. Using deep learning and collaborative filtering techniques to analyze online course assessment optimization based on online course assessment data and student assessments includes ameliorating teacher teaching and ameliorating student learning efficiency [7]. Through the analysis of the lack of spirit, values, and humanistic spirit of some students, it reflects the current situation of the educational effect of high-quality humanities courses in colleges and universities and tries to discuss it from the perspective of identity. The overall function of high-quality humanities courses, the optimization of the overall organization and design of education, the premise of high-quality courses, the construction of “macro humanities” learning system and quality evaluation system, etc., provide a benchmark for higher education and provide innovation and improvement for learning outcomes [8]. Along with the increase in the quantity of students, the popularization of the net and the development of information management, more and more colleges and universities have implemented online education assessment methods and achieved certain results. However, in application, the management function of the online education evaluation system still needs to be improved and optimized. Based on practical experience, this paper discusses the optimization of online education evaluation system management functions from four aspects: evaluation questionnaire management, evaluation process monitoring, and evaluation result feedback, so as to ensure the effective teaching of student evaluation, help complete student evaluation work, and make management more effective work [9]. In order to enhance the accuracy of teaching quality evaluation in colleges and teaching quality evaluation method, clever optimization algorithm is suggested. Firstly, the rating index system is constructed using the AHP; secondly, the BP neural network is optimized by using a multipopulation genetic algorithm; finally, the BP-optimized neural network is used to assess the quality of education. The experimental consequents display that this means not only overcomes the blindness of neural networks but also ameliorates the accurateness of the nonlinear approximation assessment and that the proposed method is feasible and effective [10]. An important content of physical education is the assessment of the quality of education. The purpose of evaluating classroom teaching is to promote teacher progress and improve the quality of teaching. The article analyzes the optimization of the quality management of physical education based on a neural network. This is conducive to the broad development of students and teachers in the physical education evaluation system in universities. The content of the assessment, indicators, and weights of this indicator have a certain objectivity [11]. With the improvement of education quality, higher requirements have been put forward for the quality of computer education in national universities. High-quality computer education can promote students’ mastery of knowledge and increase employment rates. Different colleges and universities have different goals for teacher education, quality, and training, which further undermines the evaluation criteria for the quality of computer education in colleges and universities. The principles of Bloom’s method are for categorizing educational goals, establishing and improving computer optimization [12]. With the rapid increase in the number of MOOCs, the quality of courses and educational effects are of concern. Following the 6 most popular courses among the three major MOOC platforms in the country, it analyzes and compares the four aspects of learning outcomes, course content, assessment methods, and interactive design. The optimized design results such as design play a certain reference role in improving the quality of the course [13]. The neural network method of particle swarm majorization is used to create a model for assessing the quality of education; compared to the traditional model for assessing the quality of BP neural network education, the particle swarm optimization neural network education quality evaluation result is closer to the real value, avoiding reaching a local minimum and achieving for better performance evaluation [14]. Teaching online is an urgent way to ensure continuity of university education during the COVID-19 pandemic. In this special situation, it is urgent to research an effective online learning method and improve the quality of online education. As a new type of localized teaching method, PAD (Presentation, Assimilation, Discussion) mode has the significant advantages of in-depth concept, comfortable use, and significant learning effect. Based on the principle of the PAD model, its application in the online teaching of general psychology courses for general students during the COVID-19 epidemic is discussed, as well as the challenges faced by the online education of general psychology courses, the theoretical and practical basis of the application of the PAD model, and the PAD specific stage of the model’s implementation in general psychology online education, and finally summarizes the issues that need to be considered when applying the PAD model to online teaching, including distinguishing students’ learning characteristics, enhancing teachers’ ability to manage classrooms, and improving the integration and optimization of educational resources [15].
2. Online Teaching Courses
2.1. Problems Existing in Online Courses
Online teaching courses can break the limitations of time and space and provide continuous and diverse course resources anytime, anywhere, which is a huge advantage that traditional courses cannot match. On the other hand, online teaching courses also have problems such as poor continuity of students’ learning attention, fragmented learning exchanges, and insufficient interaction with education. However, colleges and universities often fail to see many of the differences between online teaching courses and traditional courses and do not have clear instructions on the specific development of learning activities. Therefore, many teachers do not follow the characteristics of online teaching courses, but follow the original teaching experience, which seriously affects education. In addition to teaching courses online, university teachers face challenges related to their own sources of knowledge, teaching methods, teaching skills, and use of information technology. Many teachers laughed at themselves and became “eighteen anchors,” and some famous teachers and famous teachers have a strong “achievement” color in their teaching. Some teachers do not use experiential eLearning or create classroom lessons. All this requires teachers to improve their own skills. A more general problem is that teachers teach in the same way as in traditional classrooms, and online courses are less oversight of the learning process. Due to the lack of classroom restrictions in traditional teaching methods, students are easily distracted in online courses, which affects the learning effect. Online courses are usually organized into different modules according to the learning content and knowledge points, supplemented by short videos of about ten minutes. Students should browse and explore independently before and after class. Academic achievement largely depends on the self-discipline of students. As a result, online learning outcomes at the student level vary from person to person. Online courses lack elements such as teachers, classmates, and classroom discipline that can be used to drag students down. Students only look at computer screens and are easily distracted from study. Students’ learning has changed from group learning to individual learning. There is no comparison, it is easy to slow down and procrastinate, and the learning efficiency is reduced. In addition, online team discussions for students after class can easily become on paper and cannot be conducted in person or with satisfactory results.
In online courses, learners’ attention is not strong, the learning communication is scattered, and the teaching interaction is insufficient; the course setting is not prepared in advance, and the students do not preview in advance, and the classroom learning effect is reduced; in the teaching process of online courses, teachers cannot pass the network. The classroom platform sees the learning status of students. Even through live broadcast or barrage, the interaction between teachers and students is delayed. It is impossible to grasp students’ thoughts and behaviors in the first place, and teachers’ management and supervision functions in the classroom are correspondingly weakened; due to the lack of traditional classroom constraints of the teaching form, students are easily distracted during the online course learning process, which affects the learning effect.
2.2. Factors Influencing the Quality of Online Teaching Courses
The quality assurance system of online teaching courses is based on the whole process of online courses, including the main factors and some hidden elements that influence the quality of online teaching courses. Linking issues can affect the quality of the entire online course, which in turn affects learning outcomes. Therefore, only by analyzing all aspects of the entire course can a scientific online course quality assurance system be finally constructed. The curriculum concept is the forerunner of curriculum design. For online education, the concept of creating courses based on workflow has become the core concept of education, and open online courses in colleges should be matured around this concept. Colleges and universities mainly cultivate students’ professional skills, and it is clear that the positioning of online courses is to cultivate skills; the course design is based on the actual job process, and the content of online courses is clearly constructed according to the tasks of the work process; the educational method of organizing courses is based on behavior or design, specifying strategies for implementing online courses. Explaining the concept of an online course is the starting point for quality assurance. Course resources and content are the cornerstone of online course quality assurance. Due to changes in teaching forms, online courses have put forward new standards and requirements for the form and content of resources. In particular, with the development of the mobile net, the construction of online course resources has become “easy to spread.” Therefore, “microengraving” has become the main form of programming resources in recent years. At the same time, with the development of microcourses, the organizational form of course content has changed, especially in education. In addition to the above behavioral concepts, “granular” teaching content has become the mainstream, and the creation of a quality online course guarantee system focuses on creating course resources and content. The key to building an online course is course implementation and management, which is the way to embody the course idea and the form of delivery of course resources. The online form of higher education has essentially broken through the traditional teaching method and is no longer a knowledge transfer in the context of professional embodiment. Therefore, the implementation of online open courses in colleges and universities is based on behavior orientation, the use of message technology, and the use of online learning platforms. In this process, we must not only persist in the basic principles of teaching but also take into account the laws of network communication to ensure the quality of the course, as shown in Figure 1.

2.3. Construction Principles of Online Teaching Course Guarantee System
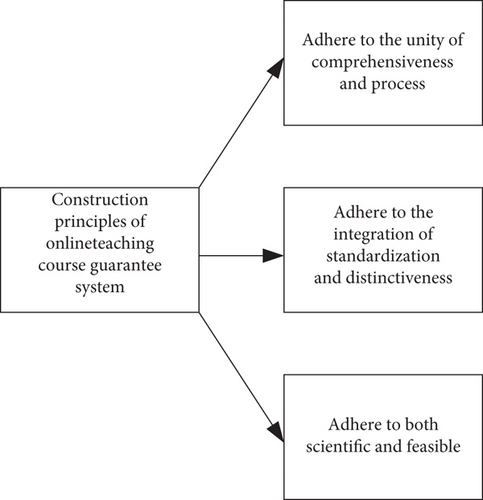
Since in the organization of the whole project, as a factor that affects different cities, it is essential to fully consider the elements that affect the comprehensive achievement education, the factors that affect different aspects, throughout the entire online course and the most important aspect, the design of the comprehensive aspects online can be emphasized by emphasizing emphasized and displayed with different emphasis. Build the basic guarantee system of the curriculum quality system. The establishment of a quality assurance system is only a basic institutional requirement, and it is also a standard system. Integration and features ensure the sexual development of course content and a mature quality assurance system. If an excellent and scientific quality assurance system cannot be implemented, if the operation of the system cannot be guaranteed, the operation of the operating system cannot be guaranteed, and an empty system shelf cannot be guaranteed. Proposing and acknowledging that such developments are fully guaranteed, targeted activities and the quality of activities are the principles of the system, as shown in Figure 2.
2.4. Optimization Strategies for Online Teaching Tutorials
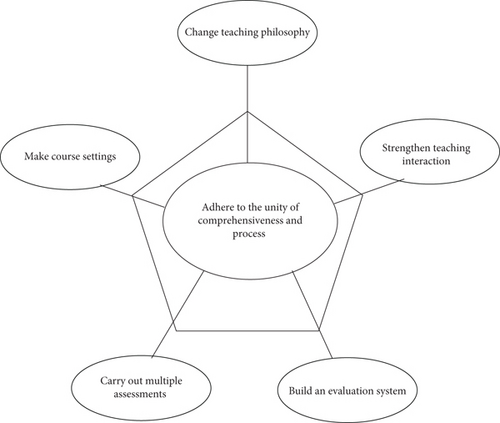
At this stage, “large-scale, interactive online education” enables teachers to provide thousands of students with high-quality education in a real-time, interactive, remote, and decentralized way. The educational philosophy requires and guides teachers and students to carry out online course work. Many students do not have time to bring their textbooks home, or the school does not distribute textbooks, and students do not review reference materials, which affects the effect of online courses. In view of more than questions, so as to achieve the teaching goal of the trinity of value counseling, training technical skills and theoretical knowledge transfer, the information security technology course teaching content of group planning is the basic theory of information security and the application of information security in the compilation of textbooks. There are 3 sections of technical engineering and information security, which conform to the 3 dimensions of learning research, technical research, and practical examples. Configured online learning resources. Tutorials, intermediate knowledge explanation rules and advanced problem discussion applications allow students to expand and read other online resources after self-study online. Students can use sufficient online teaching materials for preview review, which is conducive to easier mastery of the course. Compared with traditional face-to-face classroom teaching, online teachers cannot see the performance of students in time, and it is difficult to keep abreast of students’ learning status. Students are easily distracted from learning because they do not have to look at the teacher and are not confined to the classroom. Therefore, timely and effective online interaction is the most major link to improve the quality of online education. For this reason, the information security technology group course starts with language scripts and multimedia audiovisual tools to improve the organization ability of online discussion and answering questions. The course team also set up online. Various data collection channels such as video assessment, synchronous chapters, and self-assessment are used to understand students’ learning difficulties and common problems. In addition, continuous education feedback can be obtained through platform questionnaires, hiring students and teachers, etc. It needs to be improved. According to the stratified and segmented assessment methods, research and understand the learning outcomes of students at each stage, and check and fill in the blanks. In the offline epidemic prevention and control exam, in order to strengthen the connection of knowledge points learned by online students and solve the problem of fragmentation of knowledge content, the course group. It further emphasizes the requirement of “integration” and proposes a course report to solve complex problems and technical problems related to information security. From macro to micro, it helps students solve knowledge problems and establishes an online education model that resonates synchronously and asynchronously, as shown in Figure 3.
3. Machine Learning Models
3.1. Factor Analysis
3.1.1. Standardize the Original Data
Since the covariance matrix of the standardized index is equal to its correlation coefficient matrix and the correlation coefficient matrix is not affected by the index dimension or quantity set, the standardized factor formula is not affected by the dimension and quantity set.
3.1.2. Calculate the Covariance Matrix of the Standardized P Indicators
3.1.3. Calculate the Eigenroot and Eigenvector of the Correlation Matrix R
λi is the variance of the i-th main factor yi, which reflects the role of the i-th main factor yi in describing the object being evaluated.
3.1.4. Calculate the Variance Contribution Rate ak and Cumulative Variance Contribution Rate a(k) of Each Common Factor
The proportion of the total variance of the original index is the information amount of the original p index extracted by the kth common factor. Therefore, the cumulative variance contribution rate a(k) of the k common factors y1, y2, ⋯, yk represents the total amount of original information retained by the k common factors.
3.1.5. Determine the Number of Common Factors
The more common ones in practice are as follows.
The first is the principle of cumulative contribution rate. According to the actual needs of the problem, the cumulative variance contribution rate of the first k common factors can meet certain requirements, usually a(k) ≥ 85%.
Then, compare each feature root λi with , and if λi > 1 is satisfied, it can be selected.
The minimum k value that satisfies λi > 1 is required. The common factors of this principle are selected less.
- (1)
The principle of cumulative contribution rate: according to the needs of the actual problem, the cumulative variance contribution rate of the first k common factors can meet certain requirements
- (2)
The principle of mean
- (3)
Bartlett’s hypothesis test to determine the number of common factors
3.1.6. Calculate the Initial Factor Loading Matrix
3.1.7. Calculate the Inverse of the Correlation Matrix R and Estimate the Factor Scores
Since the indicators and common factors are standardized, there is βj0 = 0.
3.1.8. Finding Total Factor Score Estimates
Finally, according to the estimated value of the total factor score, each evaluated object can be sorted, classified and compared. The calculation process is as follows.
Step 1: standardize the original data to eliminate the influence of the dimension and order of magnitude of the indicators.
Step 2: calculate the correlation coefficient matrix R of the standardized indicators.
Step 3: use the Jacobi method to find the eigenvalues of R and its corresponding eigenvectors.
Step 4: determine the number of common factors: select the number m of characteristic roots greater than or equal to 1 as the number of common factors, or determine m according to the criterion that the cumulative variance contribution rate is equal to or equal to 85%.
Step 5: calculate the initial factor loading matrix.
Step 6: explain the actual meaning of common factors.
Step 7: calculate the inverse matrix of the correlation coefficient matrix R, and estimate the factor score of each evaluated object.
Step 8: seek comprehensive value.
Step 9: according to the estimated value of the total factor score, each evaluated object can be sorted, classified, compared, and analyzed.
3.2. ANP Model
3.2.1. Weighted Hypermatrix
Observe whether the diagonal of the weighted super matrix has a value of 0; if it does, it means that the weight of the feature will eventually be 0.
3.2.2. Limit Hypermatrix Features
Based on the interaction between the elements in the network model, make a pairwise comparison. Determine the unweighted super matrix (based on the pairwise judgment matrix, use the eigenvector method to obtain the normalized eigenvector value, and fill in the super matrix column vector). Determine the weight of each element group in the super matrix (to ensure that each column is normalized). Calculate the weighted super matrix. Calculate the limit super matrix (use the power method, that is, find the nth power of the super matrix until the column vectors of the matrix remain unchanged).
4. Evaluation and Analysis of Online Teaching Course Quality Based on Machine Learning Model
In order to reduce random errors, this survey randomly selected 4 colleges and universities to distribute questionnaires to colleges and universities of different levels. Each school distributed 90 copies, a total of 360 questionnaires were distributed, 301 copies were successfully recovered, and the effective recovery rate was 83.61%. Data were analyzed.
4.1. Construction of Basic Information and Evaluation Index System
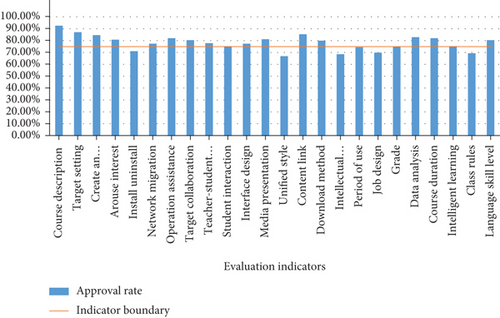
A total of 24 evaluation indicators have been set up. Statistical analysis is carried out through the questionnaire data, and the evaluation indicators with a recognition rate of more than 75% are selected for the subsequent analysis. From the figure, we can see that there are 18 indicators whose recognition rate is greater than or equal to the limit of the indicators, which are courses, respectively: description, environment creation, goal setting, interest stimulation, goal collaboration, network migration, teacher-student interaction, operation assistance, interface design, student interaction, content connection, media presentation, download method, course duration, performance evaluation, intelligent learning, data analysis, and language level. Those with an approval rate of less than 75% included installation and uninstallation, style uniformity, intellectual property rights, term of use, homework design, and classroom discipline. Their approval rates were 71.40%, 67.20%, 68.90%, 74.80%, 70.20%, and 69.70%, respectively, as shown in Figure 4.
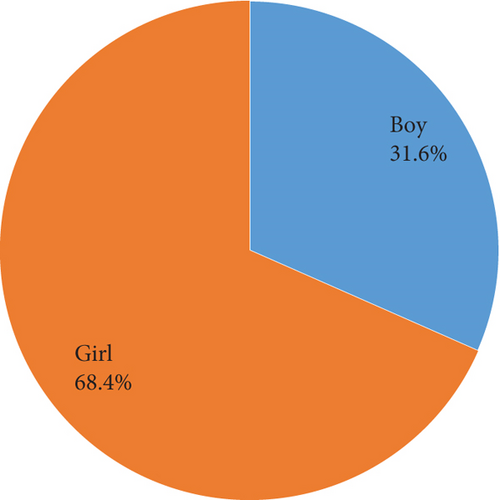
The gender distribution of valid questionnaires was that girls were more than boys. Boys accounted for 31.6% of the total number and girls accounted for 68.4% of the total number, as shown in Figure 5.
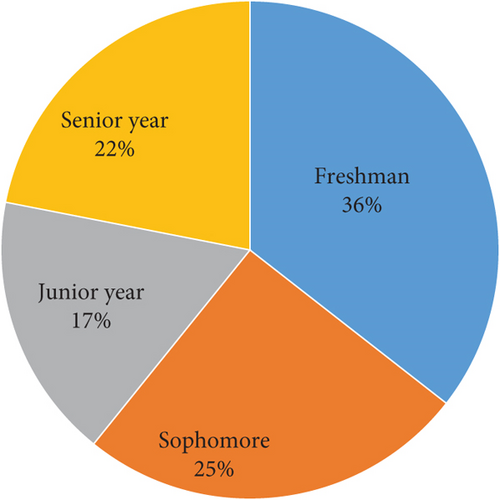
As can be seen from Figure 5, there are 107 freshmen, accounting for 35.5%; sophomores are 76, accounting for 25.3%; juniors are 52, accounting for 17.30%; seniors are 66, accounting for 25.3%, as shown in Figure 6.
The most selected evaluation index is 4 points, and the least is 1 point. In the course description, there are 4 people who choose 1 point, 2 people who choose 2 points, 43 people who choose 3 points, 168 people who choose 4 points, and 74 people who choose 5 points. In the goal setting, there is 1 person who chose a score of 1, 8 people who choose a score of 2, 40 people who choose a score of 3, 167 people who choose a score of 4, and 85 people who choose a score of 5. There are 4 people who choose 1 point, 21 people who choose 2 points, 54 people who choose 3 points, 171 people who choose 4 points, and 51 people who choose 5 points. There are 4 people who choose 1 point, 24 people who choose 2 points, 45 people who choose 3 points, 163 people who choose 4 points, and 65 people who choose 5 points. There are 4 people who choose a score of 1, 30 people who choose a score of 2, 46 people who choose a score of 3, 127 people who choose a score of 4, and 94 people who choose a score of 5; in the operation help, there are 4 people who choose 1 point, 25 people who choose 2 points, 42 people who choose 3 points, 162 people who choose 4 points, and 68 people who choose 5 points. There are 2 people who get a score of 1, 11 people who choose a score of 2, 63 people who choose a score of 3, 165 people who choose a score of 4, and 60 people who choose a score of 5. There are 3 people who choose a score of 1, 25 people who choose a score of 2, 46 people who choose a score of 3, 151 people who choose a score of 4, and 76 people who choose a score of 5, as shown in Figure 7.
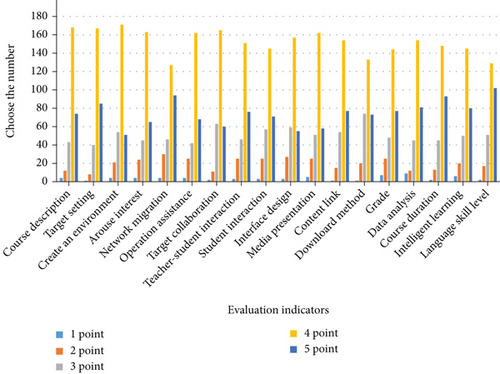
Goal setting had the highest average score, with an average score of 4.09, followed by course length, with an average score of 4.05, language proficiency, with an average score of 4.04, course description, with an average score of 3.98, content linkage, with an average score of 3.97. The average score of network migration is 3.92; the average score of intelligent learning is 3.91; the average score of target collaboration is 3.9; the average score of teacher-student interaction is 3.9; the average score of operation assistance is 3.88; the average score of interest stimulation is 3.87; the average score of student interaction is 3.85; the average score of download method is 3.85; the average score of environment creation is 3.81; the average score of media presentation is 3.81; the average score of interface design is 3.78, as shown in Table 1.
| Evaluation indicators | The average score |
|---|---|
| Course description | 3.98 |
| Target setting | 4.09 |
| Create an environment | 3.81 |
| Arouse interest | 3.87 |
| Network migration | 3.92 |
| Operation assistance | 3.88 |
| Target collaboration | 3.9 |
| Teacher-student interaction | 3.9 |
| Student interaction | 3.85 |
| Interface design | 3.78 |
| Media presentation | 3.81 |
| Content link | 3.97 |
| Download method | 3.85 |
| Grade | 3.86 |
| Data analysis | 3.95 |
| Course duration | 4.05 |
| Intelligent learning | 3.91 |
| Language skill level | 4.04 |
4.2. Factor Analysis Method
The KMO and Bartlett tests were performed on the questionnaire data, and it could be seen that the KMO sampling suitability measure was 0.876 greater than 0.8, so the relationship between the variables was good, and it was suitable for factor analysis, as shown in Table 2.
| KMO sampling suitability quantity | 0.876 | |
| Bartlett’s sphericity test | Approximate chi-square | 1497.685 |
| Degrees of freedom | 153 | |
| Salience | 0 | |
As can be seen from the table, the first factor includes data analysis, performance evaluation, intelligent learning, course duration, and language level named as course analysis; the second factor includes network migration, operation assistance, content connection, and download method named as course support; the third factor is course description, environment creation, goal setting, and interest stimulation, which is named curriculum preset; the fourth factor is student interaction, media presentation, goal collaboration, interface design, and teacher-student interaction, named curriculum interaction, as shown in Table 3.
| Element | ||||
|---|---|---|---|---|
| 1 | 2 | 3 | 4 | |
| Data analysis | 0.738 | 0.135 | 0.098 | 0.134 |
| Grade | 0.666 | -0.015 | 0.057 | 0.297 |
| Intelligent learning | 0.619 | 0.14 | 0.115 | 0.242 |
| Course duration | 0.503 | 0.38 | 0.189 | -0.021 |
| Language skill level | 0.481 | 0.17 | 0.267 | 0.071 |
| Network migration | 0.063 | 0.76 | 0.187 | 0.18 |
| Operation assistance | 0.116 | 0.684 | 0.12 | 0.276 |
| Content link | 0.393 | 0.559 | 0.099 | 0.095 |
| Download method | 0.178 | 0.549 | 0.075 | 0.355 |
| Course description | 0.174 | 0.258 | 0.778 | 0.078 |
| Environment creation | 0.193 | -0.005 | 0.688 | 0.206 |
| Target setting | 0.247 | 0.363 | 0.683 | -0.081 |
| Arouse interest | -0.08 | -0.031 | 0.563 | 0.559 |
| Student interaction | 0.247 | 0.208 | -0.04 | 0.624 |
| Media presentation | 0.331 | 0.13 | 0.115 | 0.584 |
| Target collaboration | -0.003 | 0.356 | 0.24 | 0.53 |
| Interface design | 0.258 | 0.284 | 0.042 | 0.446 |
| Teacher-student interaction | 0.304 | 0.179 | 0.286 | 0.398 |
4.3. ANP Model
In the secondary indicators, the CR value of course preset is 0.06529; the CR value of course interaction is 0.06368; the CR value of course support is 0.0748; the CR value of course analysis is 0.036. According to the rules of consistency test, the CR values of the secondary indicators are all less than 0.1, so all the judgment matrices meet the requirements, as shown in Table 4.
| Secondary evaluation index | Course preset | Course interaction | Curriculum support | Course analysis |
|---|---|---|---|---|
| CR | 0.06529 | 0.06368 | 0.0748 | 0.036 |
The figure shows intuitively that the teacher-student interaction in the course interaction has the highest ANP value, with an ANP value of 0.264721; the lowest is the course duration in the course analysis, with an ANP value of 0.006085; in the course presets, the highest ANP value is interest excited, the ANP value is 0.121398, followed by the course description ANP value of 0.06009, the goal setting ANP value of 0.031365, and the curriculum analysis ANP value of 0.014004; in the course interaction, the largest ANP value is the teacher-student interaction, and the ANP value is 0.264721. The ANP value of media presentation is 0.154391, the ANP value of target collaboration is 0.084266, the ANP value of class-student interaction is 0.047685, and the ANP value of interface design is 0.033207; in course support, the largest ANP value is operation assistance, and the ANP value is 0.039793, followed by network. The ANP value of migration is 0.030863, the ANP value of download mode is 0.027683, and the ANP value of content connection is 0.012347; in the course analysis, the largest ANP value is intelligent learning, the ANP value is 0.045928, followed by the data analysis ANP value of 0.01136, the language standard ANP value is 0.008374, and the performance evaluation ANP value is 0.006441; the course duration ANP value is 0.006085, as shown in Figure 8.
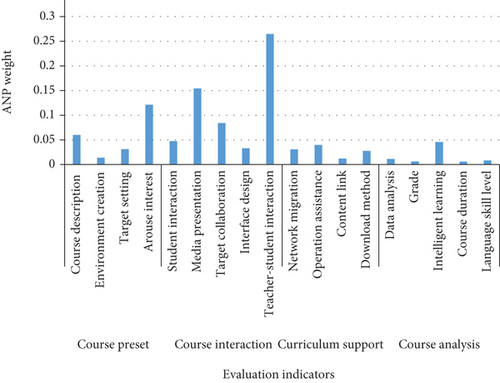
On the whole, it can be seen that teacher-student interaction, media presentation, and interest stimulation are the three factors with higher weights in order, while the three factors of performance evaluation, course duration, and language proficiency have relatively low weights. In the course presets, the highest weight is interest stimulation, and the smallest weight is environment creation; in the course interaction part, the global weight is the teacher-student interaction, and the smallest weight is the interface design; in the course support, the largest weight is an operation aid, and the content connection has the smallest weight; in the course analysis part, the weight of intelligent learning is the highest, and the weight of the course duration is the lowest.
It can be seen from the table that in the second-level indicators, the evaluation score of course interaction is the lowest, with a score of 3.91, and the course support is the highest, with a score of 4.02. In the third-level indicators, environment creation has a low score, with a score of 3.83, interface design. The score was 3.84, interest stimulation, 3.87; performance evaluation, 3.87; relatively high scores were language proficiency, 4.08; course description, 4.07; goal setting, 4.16; and content connection, 4.07. Clearly, the low-scoring part of the course interaction is the most important aspect when developing our proposed strategy. At the same time, stimulating interest, creating environment, performance evaluation, and interface design are also important factors for us to improve the quality of online courses, as shown in Table 5.
| Control layer | Secondary indicators | Evaluation score | Three-level indicator | Evaluation score |
|---|---|---|---|---|
| Quality of online teaching courses | Course preset | 3.98 | Course description | 4.07 |
| Environment creation | 3.83 | |||
| Target setting | 4.16 | |||
| Arouse interest | 3.87 | |||
| Course interaction | 3.91 | Student interaction | 3.93 | |
| Media presentation | 3.9 | |||
| Target collaboration | 3.94 | |||
| Interface design | 3.84 | |||
| Teacher-student interaction | 3.93 | |||
| Curriculum support | 4.02 | Network migration | 4.05 | |
| Operation assistance | 3.98 | |||
| Content link | 4.07 | |||
| Download method | 3.96 | |||
| Course analysis | 4.01 | Data analysis | 4.01 | |
| Grade | 3.87 | |||
| Intelligent learning | 3.94 | |||
| Course duration | 4.15 | |||
| Language skill level | 4.08 |
5. Conclusion
The study found that students pay more attention to interest stimulation, but the score of interest stimulation is relatively low; the presentation method of media is an important factor affecting the quality of online teaching courses; teacher-student interaction is the main factor affecting the quality of online courses and has a direct impact on the quality of online teaching courses, negative impact. It is suggested that colleges and universities should attach importance to the construction of online courses, increase investment in online courses, implement quality assurance measures for online teaching courses, and incorporate online teaching courses into the regular education assessment of schools. Moderately difficult preclass activities can put moderate pressure on students, let students have a basic understanding of the subject of the course, and stimulate students’ interest in the task; teachers should clearly explain the practical value of the course in the course, with strong practical multimedia display of course content; establish a professional and dedicated team of online course teachers, that is, collaborate with course designers during course development, monitor the quality of course development as a whole, and assign full-time teachers to quickly respond to students’ learning after class on-demand; online courses provide students with descriptive performance analysis reports with targeted explanations and instruction for specific students.
Conflicts of Interest
The authors declared that they have no conflicts of interest regarding this work.
Open Research
Data Availability
The experimental data used to support the findings of this study are available from the corresponding author upon request.


