Effect of MnOx/α-Fe2O3 Prepared from Goethite on Selective Catalytic Reduction of NO with NH3
Abstract
A low-cost goethite and manganese acetate were used to prepare a MnOx/α-Fe2O3 composite catalyst by simple impregnation method for novel high-efficiency selective catalytic reduction (SCR) of NO with NH3, and its denitration performance of composite catalyst under different conditions was investigated in a thermal fixed-bed catalytic reaction system. The results showed that MnOx/α-Fe2O3 with Mn/Fe molar ratio of 0.1 and calcination temperature of 400 °C had the best low-temperature catalytic activity and wider reaction temperature window compared with α-Fe2O3. It achieved over 90% NO conversion efficiency with a space velocity of 72,000 h−1 at 200~350 °C and possessed a good resistance of H2O and SO2. Characterization by XRD, BET, H2-TPR, and NH3-TPD revealed that the main reason for the high catalytic activity of MnOx(0.1)/α-Fe2O3(400) was that the addition of Mn changed phase types of catalyst and valence composition of Fe, resulting in a larger specific surface area, more acidic sites, and higher redox performance.
1. Introduction
Nitrogen oxides (NOx), mainly emitted from stationary sources such as industrial furnaces and coal-fired boilers, are one of the major pollutants in the atmosphere and a source of environmental problems such as acid rain, photochemical pollution, and ozone depletion, making it highly necessary to degrade NOx [1, 2]. Among numerous de-NOx technologies, the selective catalytic reduction of NOx with ammonia (NH3-SCR) is one of the most mature, research-worthy, and promising methods and its key technology lies in the selection of catalysts [3, 4]. Currently, commercial denitration catalysts are mainly vanadium-titanium-based (V2O5-WO3/TiO2); their activity temperatures are in the range of 300~400 °C with a higher activation temperature and narrower activity temperature window. In addition, the deactivated and aged catalysts are likely to produce secondary pollution due to bio-toxicity of vanadium component [5, 6], and lower flue gas temperatures (150~300 °C) emitted from glass, cement, and other industries are not suitable for current commercial vanadium-based catalysts [7]. Therefore, the development of a de-NOx catalyst with a lower temperature and more eco-friendly profile is of great significance to the reduction of NOx emissions.
Goethite is widely distributed in natural environments such as soils and rocks and is an important mineral resource [8, 9]. It is easily replaced by cations such as manganese, aluminum, and zinc in the formation process and possesses some advantages of a high specific surface area, excellent chemical stability, and being environment-friendly, and as a result, it is generally used in water treatment, soil restoration, and photocatalysis [10–12]. Ding et al. [13] found that hydrogen peroxide (H2O2) and persulfate (PS) activation systems using goethite as a catalyst could quickly degrade BPA and goethite had excellent structural stability. Ni et al. [14] had comparatively studied conversion performance and mechanism of polycyclic aromatic hydrocarbons (PAHs) on the surface of goethite, hematite, and magnetite, respectively, and found that α-Fe2O3 possessed the highest level of oxygen vacancy, and it was beneficial to produce more active sites. Sun et al. [15] reported that using goethite photocatalytic degradation of sulfadiazine (SDZ) could achieve a remarkable effect, obtaining 100% degradation and more than 80% mineralization within 60 min. The results manifested that goethite has significant functions in the treatment of environmental pollution.
Mn-based catalysts have been extensively studied for their excellent low-temperature denitrification activity, such as preparation and performance of a series of Mn-based catalysts, like Mn/TiO2 [16], Mn-Cu/SSZ-13 [17], Fe-Mn-Ce/TiO2 [18], Nd-Mn/Ti [19], and MnOx-CeO2/Al2O3 [20]. Xu et al. [21] investigated and compared the differences in manganese oxide structure and denitration activity of Mn/beta and Mn/ZSM-5 catalysts prepared with three different precursors, including manganese nitrate, manganese acetate, and manganese chloride. They found that using manganese acetate as the precursor made catalyst optimal activity in contrast to other precursors. Li et al. [22] discovered that MnOx/TiO2 prepared with manganese acetate as a precursor had a better low-temperature denitration activity than manganese nitrate.
Previous studies on goethite were mainly focused on the application in adsorption and photocatalysis [11, 12], but there were relatively few studies on the use in the field of catalytic reduction, especially in SCR. In this study, MnOx/α-Fe2O3 was synthesized by impregnation with goethite as a precursor. The properties of catalysts were characterized by such as X-ray diffraction (XRD), N2 adsorption-desorption (BET), X-ray photoelectron spectroscopy (XPS), and H2 temperature-programmed reduction (H2-TPR). The effects of various molar ratios of MnOx and goethite in the composite, calcination temperature on de-NO efficiency, and its stability and resistance to sulfur and water of MnOx/α-Fe2O3 were systematically investigated. The primary object is to provide optimal conditions of MnOx/α-Fe2O3 prepared by goethite, being of the considerable reference value and practical significance for expanding technological applications of natural goethite and other ore resources in environmental treatment.
2. Experimental Sections
2.1. Catalyst Preparation
Synthetic goethite (α-FeOOH) and manganese acetate (Mn(CH3COO)2.4H2O) were used to prepare MnOx/α-Fe2O3 composite catalyst by impregnation method. Goethite powder was dried at 102~105 °C for 2 h before being employed. Mix manganese acetate with 80 mL ultrapure water and stirring for 0.5 h to make it fully dissolved, according to a certain molar ratio, adding goethite to manganese acetate solution, and stirring for 1 h at room temperature, placing the mixture in an oven at 40 °C for 24 h, stirring again, and then return it in an oven at 102~105 °C until drying. Dried samples were calcined in groups using a muffle furnace for 2 h at different temperatures. The calcined samples were crushed and sieved before use, named as MnOx(n)/α-Fe2O3(z) (where n and z represent Mn/Fe molar ratio and calcination temperature, respectively).
2.2. Catalyst Characterization
X-ray diffractometer (XRD, D/max-RB, Rigaku) was used to analyze the phase composition of catalysts (Cu Kα radiation, 80 mA, 40 kV, 2θ = 15° ~ 80°). The specific surface area and pore structure of catalysts were analyzed by an automatic specific surface area analyzer (BET, NOVA3000e, Quantachrome, USA). High-resolution field emission scanning electron microscopy (SEM, Hitachi Regulus 8230, Japan) was applied to observe the surface micromorphology of samples. X-ray photoelectron spectrometer (XPS, Thermo ESCALAB250Xi, USA) was used to determine the valence state and element content (Al-Kα radiation, 1486.6 eV, C 1 s line at 284.8 eV as standard). H2 temperature-programmed reduction (H2-TPR) and temperature-programmed desorption of NH3 (NH3-TPD) were detected by AutoChem II 2920 chemisorption apparatus from Mick Instrument Corporation, USA. Fourier transform infrared spectroscopy (FTIR, Bruker vertex-70, Germany) was used to analyze the surface functional groups of catalysts.
2.3. Catalytic Test
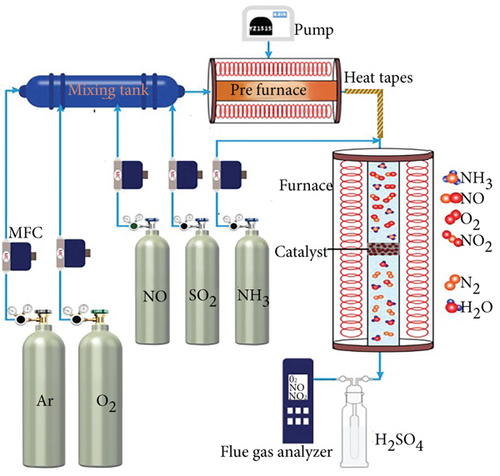
3. Results and Discussion
3.1. The Optimum Preparation Conditions of Composite Catalysts
The effect of MnOx/α-Fe2O3(400) with different Mn/Fe molar ratios on NO conversion is exhibited in Figure 2(a). The catalytic activity of α-Fe2O3 was inferior, and NO conversion efficiency could only reach 70% at a reaction temperature up to 350 °C, while NO conversion efficiency of catalysts loaded with MnOx was dramatically higher than that of α-Fe2O3 from 100 to 350 °C. Furthermore, the catalytic activity was enhanced and then weakened with an increment of MnOx loading, the optimum Mn/Fe molar ratio was 0.1, and NO conversion efficiency was above 90% at 200~350 °C with a space velocity of 72,000 h−1.
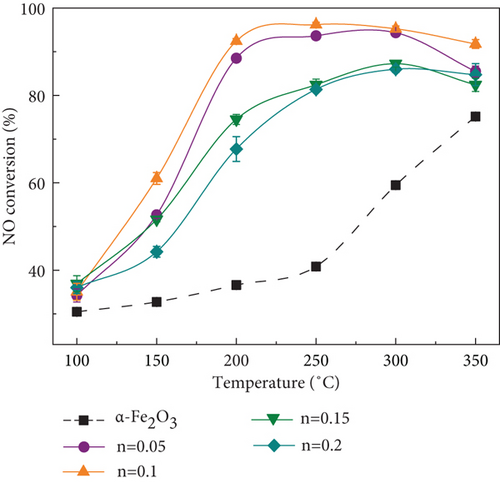
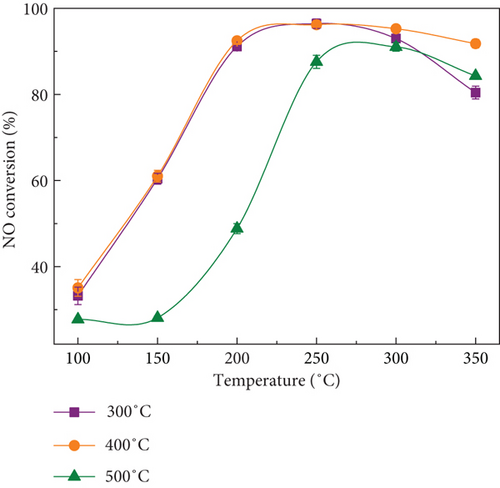
Figure 2(b) depicted NO conversion efficiency of MnOx(0.1)/α-Fe2O3 prepared at different calcination temperatures. Calcined catalysts at 400 °C exhibited the optimal catalytic activity and was followed by 300 °C. Once calcination temperature was higher than 400 °C, de-NO efficiency of catalysts declined significantly and the required activity temperature of reaction arose gradually, which may be related to the sintering and agglomeration and the reduction of the active sites of the catalyst; thus, calcination temperature should not be over-high [23]. Calcination temperature should not be excessively low either, as the precursor did not decompose completely at low temperatures, making it unfavorable for the formation of active components [24, 25]. Therefore, the optimal calcination temperature of composite catalysts was 400 °C.
After extensive testing of the prepared catalysts, the catalyst exhibited the optimal catalytic activity at the Mn/Fe molar ratio of 0.1 and a calcination temperature of 400 °C. The low-cost, easy-to-prepare MnOx(0.1)/α-Fe2O3(400) possessed excellent denitration performance at low to medium temperatures and was compared with previous researches of Fe-based and Mn-based catalysts as shown in Table 1. A follow-up experimental study was undertaken to explore structure and properties of MnOx(0.1)/α-Fe2O3(400) compared with α-Fe2O3(400).
| Catalyst | Preparation condition | Test condition | T90% (°C) | Ref. | |
|---|---|---|---|---|---|
| Preparation method, calcination temperature, and time | Concentration (ppm) NO, NH3, O2 |
GHSV (h−1) | |||
| FeOx-WO3 | Solid phase grinding, 400 °C, 3 h | 600, 600, 5% | 60,000 | 225 | [26] |
| Fe-SSZ-13 | Aqueous post-synthetic exchange, 500 °C, 12 h | 1000, 1100, 5% | 30,000 | 325 | [27] |
| Fe2-Sb1.9/TiO2 | Hydrothermal, 500 °C, 5 h | 800, 800, 3% | 60,000 | 250 | [28] |
| Fe0.8Mg0.2Oz | Co-precipitation method with microwave thermal, 400 °C, 5 h | 1000, 1000, 3.5% | 30,000 | 250 | [29] |
| Cu-Fe/BEA | Solid-state ion exchange, 380 °C, 12 h | 1000, 1000, 8% | 250,000 | 262 | [30] |
| CeO2-Fe2O3/Al2O3 | Microwave hydrothermal, 500 °C, 4 h | 500, 500, 3% | 6,000 | 200 | [31] |
| CuMnFeO4 |
|
500, 500, 4% | 40,000 | 250 | [32] |
| Mn–Ce/FeBeta | Incipient wetness co-impregnation, 550 °C, 4 h | 380, 330, 10% | 36,000 | 250 | [33] |
| MnOx/α-Fe2O3 | Impregnation, 400 °C, 2 h | 500, 500, 3% | 72,000 | 200 | This work |
3.2. Characterization
3.2.1. XRD
XRD patterns of MnOx and MnOx/α-Fe2O3 (400) with different Mn/Fe molar ratios are depicted in Figure 3(a). α-Fe2O3 was formed after calcination of goethite, in connection with the dehydroxylation of goethite at high temperatures [34]. The major diffraction peaks of MnOx at 2θ = 18.000°, 28.880°, 32.315°, 36.085°, 58.510°, and 59.840° were attributed to Mn3O4, 2θ = 34.910° and 40.547° were assigned to MnO, and 2θ = 23.131°, 32.951°, and 55.189° were ascribed to Mn2O3, respectively [35–37]. Products of manganese acetate calcined at 400 °C were mixtures of various MnOx, including Mn3O4 and trace MnO and Mn2O3, which agreed with the conclusion of Miao et al. [38]. With an increase of Mn/Fe molar ratio, the reflection peaks intensity of α-Fe2O3 weakened while that of Fe3O4 enhanced. At Mn/Fe molar ratio of 0.1, there were only little Fe3O4 and without MnOx diffraction peaks, indicating that MnOx was highly dispersed on α-Fe2O3 and promoted conversion of a small amount of Fe2O3 to Fe3O4. The coexistence of Fe2+ and Fe3+ led to unbalanced and unsaturated chemical bonds and then added the amount of surface chemisorbed oxygen, which was beneficial to improve catalytic performance [39].
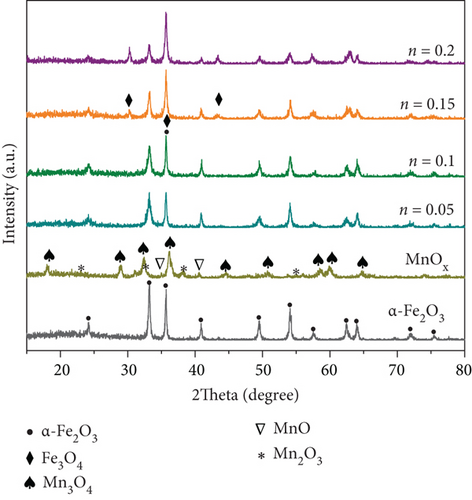
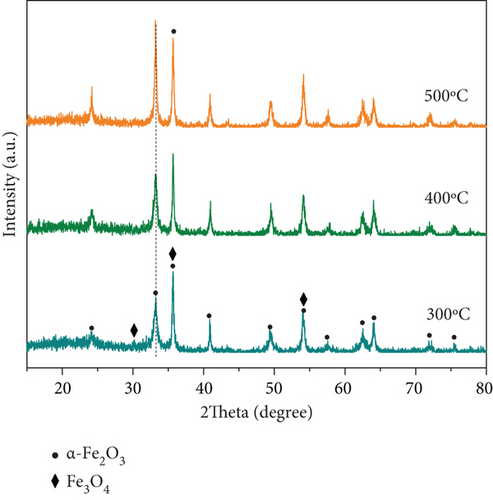

XRD patterns of MnOx(0.1)/α-Fe2O3 at different calcination temperatures are displayed in Figure 3(b). Catalysts calcined at 300 °C and 400 °C exhibited the same XRD pattern. As the temperature was higher than 400 °C, the intensity of the reflections of α-Fe2O3 enhanced with increasing calcination temperature, demonstrating an enhancement in crystallinity, it associated with gradual growth and development of α-Fe2O3 with the rise of calcination temperature. Excessive crystallinity was not conducive to the distribution of active sites [40], and the absence of Fe3O4 reflection peaks at the point suggested that type of catalyst might have changed. To investigate the reason, the products of manganese acetate at different calcination temperatures are shown in Figure 3(c).
The main product of manganese acetate at 300 °C and 400 °C calcinations temperature was Mn3O4, and the products at 500 °C were mainly Mn2O3. It revealed that with the increase of calcination temperature, the main MnOx species on the surface of the composite catalyst changed accordingly, and the oxidation degree increased, resulting in the disappearance of Fe3O4. Lou et al. [25] reported that Mn3O4 had a high SCR activity, while Mn2O3 was detrimental to the SCR process. The change in MnOx species was an obvious reason for the abrupt decrease in denitration efficiency of MnOx (0.1)/α-Fe2O3 at calcination temperatures higher than 400 °C.
3.2.2. BET
The specific surface area of catalysts had great significance in adsorbing NH3 and providing active sites [1]. The BET results of goethite, MnOx, and MnOx/α-Fe2O3 with different molar ratios and calcination temperatures are displayed in Table 2. It could be observed that calcination and appropriate load with MnOx could effectively enlarge the specific area of goethite. With an Mn/Fe molar ratio of 0.1, the specific area reached a maximum of 89.6 m2/g, suggesting that the addition of MnOx could change the structure and augment the specific area of α-Fe2O3, favoring improvement in catalytic activity [41]. However, excessive MnOx (n > 0.1) caused blockage of pore inside catalyst, hence reducing the specific surface area [42]. It led to a reduction in the active site and a decrease in the denitration activity of the catalyst. As calcination temperature increased, the specific area over MnOx(0.1)/α-Fe2O3 enlarged and then dropped reaching a maximum of 400 °C. This was attributed to the ongoing decomposition of the precursor as calcination temperature rose, thereby expanding the specific area of catalysts. Nevertheless, excessive calcination temperature causes sintering and collapse of calcined products, resulting in a reduction of specific surface area and an increase of average pore size. The specific area of optimal composite catalyst by nearly 4 times compared to α-Fe2O3, inferring the size of the specific area, was an important factor affecting the de-NOx activity of the catalyst.
| Sample | Surface area/m2·g−1 | Total pore volume/10−2·cm3·g−1 | Average pore radius/nm | |
|---|---|---|---|---|
| Goethite | 13.4 | 7.78 | 11.60 | |
| MnOx | 27.0 | 3.66 | 2.72 | |
| α-Fe2O3 | 25.4 | 8.11 | 6.40 | |
| n = 0.05 | z = 400 | 66.4 | 9.14 | 2.76 |
| n = 0.1 | 89.6 | 7.58 | 1.70 | |
| n = 0.15 | 31.8 | 6.35 | 3.99 | |
| n = 0.2 | 16.2 | 5.98 | 7.41 | |
| n = 0.1 | z = 300 | 62.4 | 12.11 | 3.88 |
| z = 500 | 47.0 | 9.99 | 4.25 | |
| z = 600 | 25.6 | 6.91 | 5.40 | |
Combined with XRD and BET results, the optimal activity of MnOx(0.1)/α-Fe2O3(400) was closely related to the presence of multiple valence states of Fe; Mn3O4 highly dispersed on catalyst surface with the largest specific area under this condition.
3.2.3. SEM
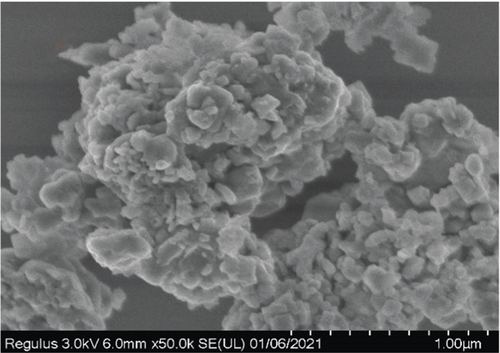
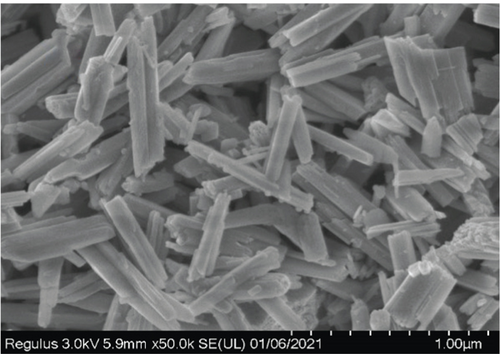
Figure 4 displayed SEM images of samples. Calcined goethite (Figure 4(a)) had a porous and unsmooth rod-like structure stacked on top of each other into a solid structure; the morphology of calcined products of manganese acetate (Figure 4(b)) was flake-like and granular stacked into a three-dimensional structure. MnOx(0.1)/α-Fe2O3(400) (Figure 4(c)) still maintained a rod-like structure, demonstrating that the loading of MnOx did not destroy the structure of goethite. MnOx (0.1)/α-Fe2O3 (400) was also found to have a smoother rod-like structure with uniformly dispersed particles protruding from its surface, which of MnOx was not found, implying that MnOx was evenly loaded on α-Fe2O3, this being an essential reason for its superior de-NO efficiency.

3.2.4. XPS
Fe 2p spectra are displayed in Figure 5(a); two main peaks at about 710.6 eV and 724.5 eV were assigned to Fe 2p3/2 and Fe 2p1/2, respectively; the peak 8 eV higher than Fe 2p3/2 was the satellite peak of Fe2O3 at Fe 2p3/2; and weak peak at 732.7 eV was probably the satellite peak of Fe 2p1/2 [43, 44]. The binding energies at 710.8 eV and 712.7 eV of Fe 2p3/2 and 724.2 eV and 726.3 eV of Fe 2p1/2 were attributed to Fe3+ [23, 45].
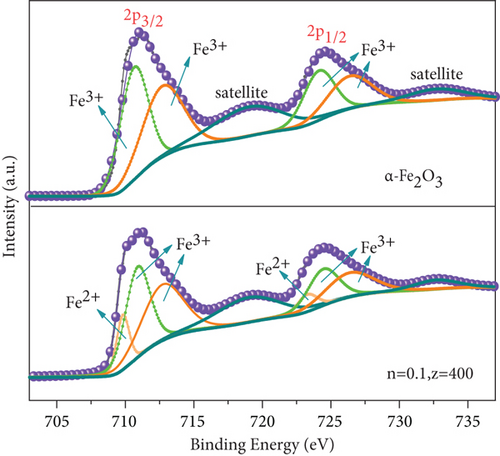
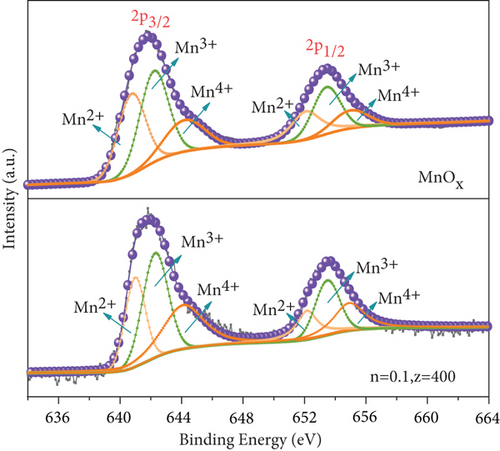
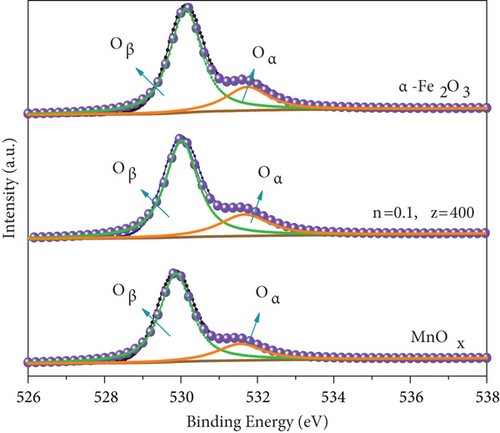
The difference in the Fe 2p spectra of two catalysts lay in that MnOx(0.1)/α-Fe2O3(400) had two weak peaks of Fe2+ at a binding energy of 709.8 eV and 723.3 eV [46], indicating that the composite catalyst was a mixture of Fe3+ dominated with a small amount of Fe2+. It confirmed the formation of Fe3O4 on the surface of catalyst, which was consistent with the result of XRD. Figure 5(b) exhibited the Mn 2p spectra. Two principal peaks observed at 641.6 eV and 653.2 eV were attributed to Mn 2p3/2 and Mn 2p1/2, respectively; both of them could be divided into three peaks: Mn2+ (640.8 eV and 652.1 eV), Mn3+ (642.2 eV and 653.4 eV), and Mn4+ (644.1 eV and 654.9 eV) [47–49]. The ratios of different Mn states calculated are shown in Table 3. The content of Mn3+ and Mn4+ in catalysts was significantly greater than that of MnOx. This was due to the reaction between Mn2+ and Fe3+ during catalyst preparation, Fe3+ + Mn2+ → Fe2+ + Mn3+, Fe3+ + Mn3+ → Fe2+ + Mn4+, that led to augment of high-valence Mn and formation of Fe2+. Mn3+ and Mn4+ played significant roles in the de-NO efficiency of catalysts. The higher content, the better redox performance facilitated NO conversion [39, 50]. XPS spectra of O 1s of catalysts are displayed in Figure 5(c). Single peak at low binding energy of 529.87~530.12 eV corresponds to lattice oxygen (Oβ), and high binding energy of 531.55~531.73 eV was surface adsorbed oxygen (Oα, including O2−, O22−) [51, 52], Oα had higher electron mobility making it presented better catalytic activity [49]. Compared with the two raw materials, MnOx(0.1)/α-Fe2O3(400) had the highest content of Oα, demonstrating that it had better redox performance and higher activity [50], which was another vital reason for its high de-NO efficiency.
| Sample | Ratio (%) | Ratio (%) |
|---|---|---|
| Oα/(Oα + Oβ)·100% | (Mn3++Mn4+)/Mn | |
| α-Fe2O3 | 23.7 | / |
| MnOx | 21.3 | 62.1 |
| MnOx(0.1)/α-Fe2O3(400) | 25.5 | 79.6 |
3.2.5. H2-TPR
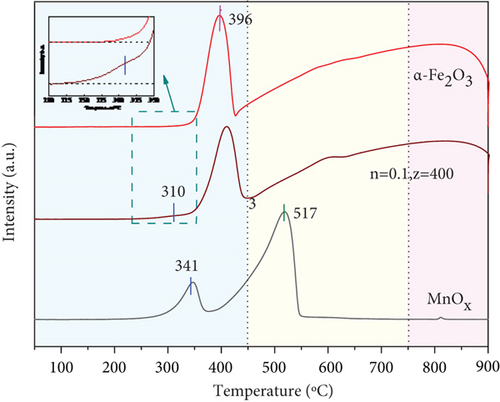
Redox performance of catalysts is one of the critical factors impacting the catalytic activity, and H2-TPR is an effective means to study it. Figure 6(a) exhibited H2-TPR profiles of catalysts. The reduction peak of α-Fe2O3 at 396 °C responded to a reduction of α-Fe2O3 to Fe3O4, and broad reduction peak at 450~850 °C corresponded to the process of Fe3O4 → FeO → Fe [53, 54]. MnOx showed reduction peaks at 341 °C, 400~545 °C, corresponding to the reduction of MnO2 → Mn2O3 → Mn3O4 → MnO [55, 56]. The maximum peak area at 517 °C manifested the largest consumption of H2, combined with analysis of XRD results. It further demonstrated that the product of manganese acetate calcined at 400 °C was mainly composed of Mn3O4 and contained MnO, Mn2O3, and MnO2, which was a mixture of various MnOx. Various active species of Mn were more favorable to the de-NO efficiency of catalysts, accounting for an essential reason for improved NO conversion of composite catalysts [41]. The peak of MnOx(0.1)/α-Fe2O3(400) at 310 °C was the conversion of MnO2 to Mn2O3. Earlier reduction peak position and lower reduction temperature indicated that the catalyst had stronger redox ability [19, 57]. Around 400 °C had an overlap reduction peak of Fe2O3 → Fe3O4 and Mn2O3 → Mn3O4; 450~850 °C were assigned to Mn3O4 → MnO and Fe3O4 → FeO → Fe reduction peaks [58]. The overlap of multiple reduction peaks made it greater H2 consumption than α-Fe2O3, signifying that MnOx(0.1)/α-Fe2O3(400) had more surface absorbed oxygen and better oxygen storage capacity [50, 59]. The addition of MnOx gave α-Fe2O3 stronger redox capacity and improved oxygen storage capacity, enhancing its low-temperature catalytic activity.
3.2.6. NH3-TPD
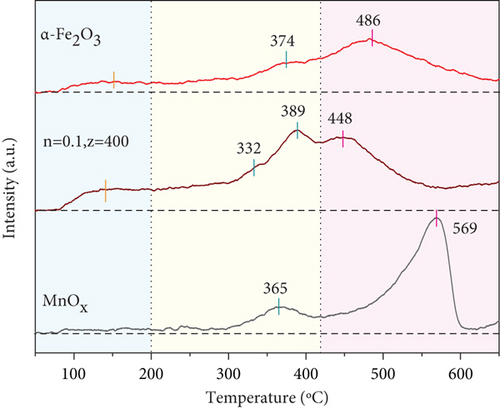
In the NH3-SCR process, since the first step of NH3 oxidation is adsorption on acid sites, the de-NO efficiency of catalysts is intimately related to the density and strength of acid sites [60, 61]. NH3-TPD was used to evaluate surface acidity of catalyst, and spectra are shown in Figure 6(b). 80~160, 160~410, and 410~600 °C were the peaks of desorption of physically absorbed NH3, Bronsted acid sites adsorbed NH3, and strongly Lewi acid sites adsorbed NH3, respectively [53, 62, 63]. α-Fe2O3 had a small desorption peak at low temperature, meaning that the content of Bronsted acid was minor; this might be an obvious reason for its poor low-temperature de-NO efficiency. MnOx only owned desorption peaks at medium and high temperatures of 365°C and 569°C, but the peak area in the high-temperature region was large. The addition of MnOx shifted the NH3 desorption peak of α-Fe2O3 to low temperature, manifesting that MnOx(0.1)/α-Fe2O3(400) generated more Bronsted acid. Bronsted acid was a key factor affecting the low-temperature de-NO efficiency of catalysts [60, 64], which was conducive to adsorption of NH3, and thus enhanced the low-temperature de-NO efficiency of catalysts. Enlargement in desorption peaks area of MnOx(0.1)/α-Fe2O3(400) meant high adsorption of NH3, demonstrating a high density of acidic center and adsorption capacity of catalyst [65]; it facilitated NO conversion. The addition of MnOx enhanced acid sites of α-Fe2O3 and boosted the adsorption capacity of NH3, and that was one of the vital reasons for the outstanding low-temperature de-NO efficiency of composite catalyst.
3.3. Catalytic Activity Tests
3.3.1. Effect of GHSV
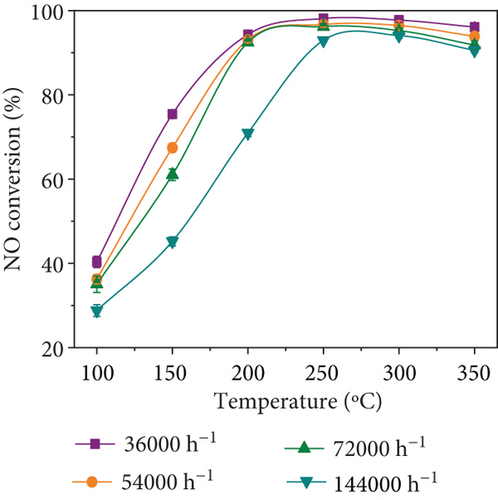
NO conversion of MnOx(0.1)/α-Fe2O3(400) catalysts at different space velocities are displayed in Figure 7(a). They differed slightly in de-NO efficiency at space velocity ranging from 36,000 to 72,000 h−1, and all exhibited outstanding catalytic activity; as space velocity reached 144,000 h−1, the activation temperature of catalyst ascended and catalytic activity dropped, but NO conversion efficiency was still able to reach over 90% at 250~350 °C. It revealed that MnOx(0.1)/α-Fe2O3(400) had superior catalytic activity, which facilitated its application in practical plants.

3.3.2. Effects of SO2 and H2O
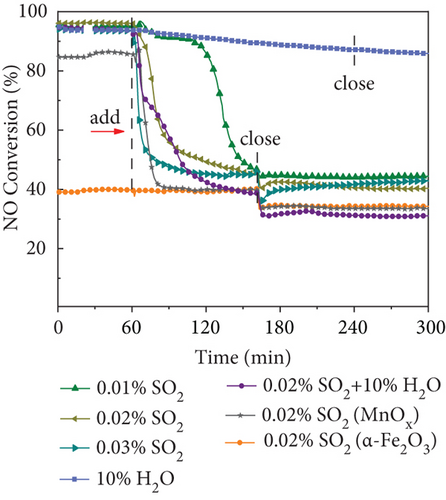
The widespread SO2 and H2O vapor in practical factory flue gas has a toxic impact on catalysts, further limiting the catalytic activity [4, 5]. Thus, it should be tested the tolerance of SO2 and H2O performance with MnOx (0.1)/α-Fe2O3 (400) catalyst under 0.05% NO, 0.05% NH3, and 3 vol.% O2 at 250 °C (Figure 7(b)). When 200 ppm SO2 was introduced into α-Fe2O3, NO conversion efficiency remained stable, and it had fine sulfur resistance. Under the same conditions, the catalytic activity of MnOx decreased rapidly with NO conversion rate dropping from 84% to 40% under 20 mins and then stabilized at 33%; de-NO efficiency could not be recovered after turning off SO2. It illustrated that Fe-based catalysts had good sulfur resistance, whereas Mn-based catalysts were greatly impacted by SO2, which was consistent with previous studies [66, 67].
NO conversion changed slightly during 1 h with 100 ppm SO2, maintaining over 90% with excellent sulfur resistance, and then decreased to 46% in 40 mins of MnOx(0.1)/α-Fe2O3(400) (Figure 7(b)). With an increase of SO2 concentration, the catalyst was poisoned for a progressively shorter time, and NO conversion efficiency all eventually stabilized at around 42% and was still higher than α-Fe2O3. When 10% H2O was injected, de-NO efficiency of MnOx(0.1)/α-Fe2O3(400) exhibited a slower decrease, with NO conversion efficiency remaining up to 85% after 3 h and excellent water resistance. The coexistence of 10% H2O and 200 ppm SO2 made NO conversion of MnOx(0.1)/α-Fe2O3(400) decrease more rapidly than that of 200 ppm SO2 alone, showing that a synergistic effect occurred between H2O and SO2 co-inhibiting catalytic activity.
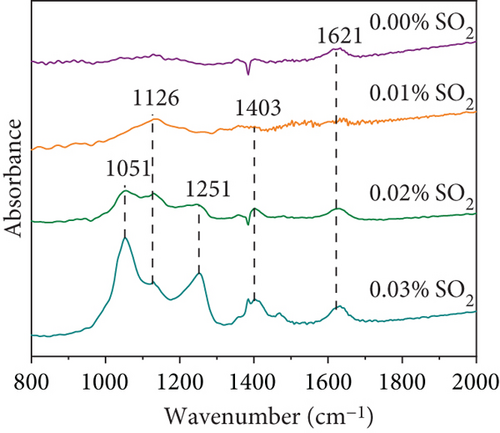
To investigate the poisoned mechanism of MnOx(0.1)/α-Fe2O3(400), tested catalysts were evaluated by XRD and FTIR. Figure 7(c) depicted XRD patterns. Catalysts poisoned with 100 and 200 ppm SO2 were not significantly different from fresh catalysts, while 300 ppm SO2 showed obvious reflections of Fe3O4, suggesting that part of Fe2O3 was reduced to Fe3O4. Catalysts co-poisoned by 10% H2O and 200 ppm SO2 not only contained the reflections of Fe3O4 but also had MnSO4, yet MnSO4 and large quantities of Fe3O4 were detrimental to NO degradation. FTIR spectra are displayed in Figure 7(d). The characteristic bands at 1000~1200 cm−1 and 1251 cm−1 were attributed separately to SO42− and sulfates, such as NH4HSO4 and (NH4)2SO4 [18]. The bands at 1403 cm−1 and 1621 cm−1 ascribed to NH4HSO3 and nitrate/nitrite species formed by the oxidation of NH3, respectively [57, 68]. A decrease in absorption peak intensity at 1621 cm−1 of 100 ppm SO2-poisoned catalyst revealed that SO2 inhibits oxidation of NH3. The intensity of bands at 1000~1200 cm−1, 1403 cm−1, and 1621 cm−1 enhanced with an increasing SO2 concentration, indicating a gradual increase in the number of sulfate species on the catalyst surfaces. XRD and FTIR indicated that the catalyst poisoning was mainly due to the following reasons: Firstly, the oxidation of NH3 was inhibited by the competitive adsorption of SO2 and NH3; secondly, SO2 and NH3 react to form ammonium salts covering active sites; thirdly, SO42− was generated during poisoning process and the active component Mn of catalysts generated MnSO4, which both consumed active components and generated sulfate to cover active sites of catalysts; and finally, a massive transfer of Fe2O3 to Fe3O4 in the denitration process, and four reasons jointly led to the reduction of NO conversion of MnOx(0.1)/α-Fe2O3(400).
3.3.3. Catalyst Stability
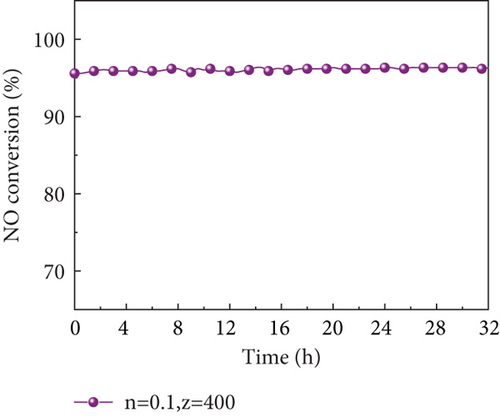
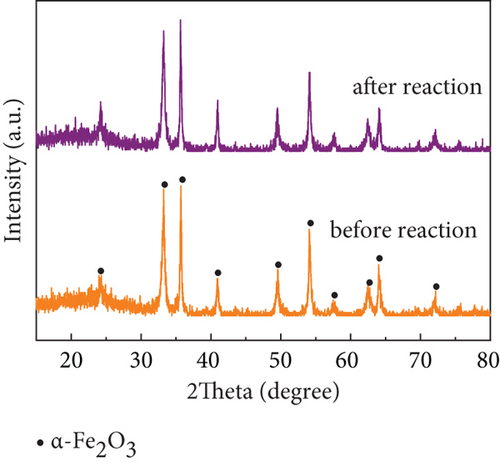
Catalyst stability is another important criterion to judge its applicability in practical plants. Fang et al. [69] tested the stability of the studied Mg-Mn/TiO2, Co-Mn/TiO2, and Cu-Mn/TiO2 catalysts, and all three catalysts showed a slowly decreasing trend in a short period of 12 h; the stability was a problem. While the denitration efficiency of MnOx(0.1)/α-Fe2O3(400) prepared in this study was almost invariable, and NO conversion efficiency remained above 95% with remarkable stability within 32 h (Figure 8(a)) at the reaction temperature of 250 °C and space velocity of 100,000 h−1. XRD patterns (Figure 8(b)) of the catalyst before and after the 32 h reaction was found no change, indicating that it has excellent stability performance and potential for practical plant applications.
4. Conclusions
In this study, low-cost goethite and manganese acetate were used to prepare MnOx/α-Fe2O3 composite catalysts by the simple impregnation method, and de-NO efficiency and transition law of catalysts under different conditions were studied. Compared with α-Fe2O3, NO conversion rate of MnOx/α-Fe2O3 was greatly improved, when the molar ratio of Mn/Fe was 0.1 and calcination temperature was 400 °C, MnOx(0.1)/α-Fe2O3(400) had the best de-NO efficiency, and NO conversion rate was above 90% at 200~350 °C. This was mainly because the addition of MnOx increased the specific surface area of α-Fe2O3 and types of active components changed the valence state of Fe and number of acid sites, improved Oα content and redox performance of catalysts, and thus enhanced catalytic activity of α-Fe2O3. α-Fe2O3 had excellent sulfur resistance; MnOx was greatly affected by SO2; MnOx(0.1)/α-Fe2O3(400) exhibited good water resistance and certain sulfur resistance; and a decrease of catalytic activity in the presence of SO2 was mainly due to the formation of ammonium sulfate covering active sites, loss of active component Mn to generate MnSO4, and transfer of Fe2O3 to Fe3O4.
Conflicts of Interest
The authors declared that they have no conflicts of interest to this work.
Authors’ Contributions
Huimin Zhou was assigned in the conceptualization, methodology, investigation, formal analysis, data curation, and writing—original draft. Lili Qian and Bo Du were assigned in the investigation. Ting Cheng was assigned in the validation and methodology. Fengjie Xia was assigned in the resources. Chengzhu Zhu was assigned in the supervision, methodology, conceptualization, writing-review and editing, and project administration.
Acknowledgments
The authors thank for the financial support from the major science and technology projects of Anhui Province of China (201903b06020016 and 201903a07020023) and Hefei key generic technology research and development projects (2021GJ064) for supporting this study.
Open Research
Data Availability
The data is included with the manuscript.


