Vision-Based Dynamic Displacement Measurement of Isolation Bearing
Abstract
The existing computer vision-based structural displacement measurement method can only obtain structural displacement when the camera is fixed or the pose of the camera is known at all times. However, the aforementioned conditions cannot be met when an earthquake occurs. Therefore, this study presents a method to achieve a dynamic displacement measure of an isolated bearing from a video without the known camera motion: two cameras are set up along the horizontal orthogonal direction, and circular targets are set at the upper and lower connecting plates of the isolation bearing. A combination of HSV color space, Canny edge detection, and Hough transform circle detection is used to obtain the dynamic displacement of the isolation bearing. This task is done by measuring the relative displacement between the upper and lower target points. A basic mechanical performance test of LRB500 isolation bearing is used to verify the proposed method. The result shows that the horizontal displacement time history of the isolation bearing obtained by this method is almost the same as the result obtained by the displacement meter whether the camera is moving or fixed. However, compared with the results measured by the displacement meter, the absolute error of the peak horizontal and vertical displacements are both less than 1 mm, which indicates that the proposed method can be used in displacement monitoring under long-term load and earthquake action of isolation bearing.
1. Introduction
The isolation bearing in the seismic isolation structure is used as a vertical load-bearing component and consumes structural vibration energy. Therefore, the isolation bearing is the key part that is most prone to damage. If the damage is not found and continues to accumulate to a certain extent, the entire structure may suddenly fail. Thus, seismic monitoring of the isolation bearing is necessary. Monitoring can effectively track and evaluate the performance status of the isolation bearing. Monitoring can also provide a reference for the safe operation and maintenance of seismic isolation structures and bearings in complex environments and during earthquake disasters. However, among nearly 10,000 earthquake-isolation buildings in China [1], only a few have carried out seismic monitoring on their isolation bearings. The main reason is that the current monitoring system is basically composed of acceleration sensors, displacement sensors, and corresponding data acquisition equipment [2–5]. As a result, the current monitoring system is expensive and complex to maintain. In particular, the displacement of the isolation bearing and interstory drift ratios is crucial in evaluating the isolated structure state and is traditionally measured with linear variable differential transformers (LVDTs), string potentiometers, or dial gauges; however, these contact methods require a connection to a fixed attachment point, which is difficult for most applications. Alternatively, displacements can be computed from double integrated acceleration measurements, but the acceleration-based measurements are typically distorted due to low-frequency noise. Therefore, most building owners cannot accept this additional project expenditure. Therefore, developing a low-cost, high-precision seismic monitoring system for isolation bearing is important in the performance evaluation of the isolation bearing as well as in the improvement of isolation technology and isolation bearing products.
In recent years, with the increasing development of computer vision technology and image acquisition equipment, computer vision-based structural monitoring methods have been used in bridge deformation monitoring [6], structural displacement measurement [7, 8], cable vibration [9], fan blade vibration [10], and so on. This method has numerous advantages, such as multipoint monitoring, low cost, and high precision. Therefore, computer vision-based methods can be tried for seismic monitoring of isolation bearings. However, most of the existing displacement measurement methods based on computer vision require a fixed camera position and use the camera position as a reference point to measure the vibration displacement of the structure.
To measure the displacement of the isolation bearing under the action of an earthquake, the camera also moves with the earthquake, and the camera position cannot be used as a reference point to measure the displacement of the bearings. To solve this problem, Global Position System (GPS) or inertial navigation systems (INS) [11] can be used to track the camera pose in real-time and then calculate the absolute displacement of the structure based on the camera position and relative displacement between the camera and the structure at each time. However, the isolation bearing is installed indoors, which results in a weak GPS signal. The INS system that meets the accuracy requirements for displacement measurement of isolation bearing is expensive, and therefore, the cost of the entire monitoring system has no advantage compared with the traditional monitoring system. Yoon et al. [12] and Tung et al. [13] proposed a method to track the pose of the camera in real-time without using GPS or INS and other equipment. A moving camera is used to photograph a fixed object near the object to be measured. The relative position of the object is used to calculate the camera’s pose. Although this method does not require GPS or INS, it still needs a fixed object near the measured object, but the entire structure and the ground will move and there will be no fixtures nearby when the earthquake happens. Therefore, the existing vision-based structural displacement measurement methods cannot be directly used in the deformation monitoring of isolation bearings under earthquakes.
Given the displacement measurement requirements and characteristics of the isolation bearing during earthquakes, this study proposes a computer vision-based dynamic displacement measurement method for the isolation bearing. This method does not need to track the camera position and realizes the dynamic displacement measurement of the isolation bearing. Through the mechanical performance test of an isolation bearing, the feasibility and accuracy of the proposed isolation bearing deformation monitoring system are verified.
2. Dynamic Displacement Monitoring Method of Isolation Bearing
When the computer vision method is used to measure the dynamic displacement of the isolation bearing, the camera should be set on the isolation layer, and the specific setting mode is shown in Figure 1. The camera is either fixed to the upper structure or fixed to the ground.
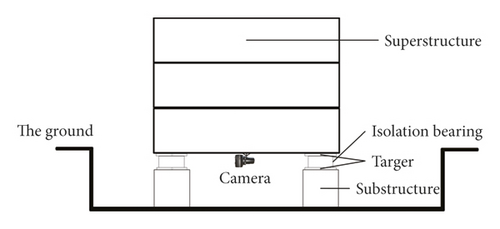
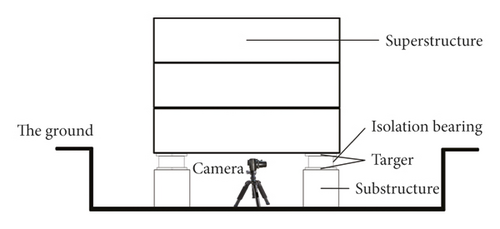
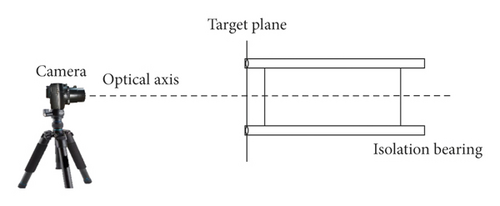
When an earthquake occurs, the camera moves with the ground or the upper structure, and the projection relationship between the image captured by the camera and the object is always changing and unknown. However, the displacement of the isolation bearing is the relative displacement of the upper structure and the ground, which can be expressed by the relative deformation of the upper and lower connection plates of the isolation bearing. Therefore, along the two orthogonal directions x and y of the building axis, targets are set on the upper and lower connecting plates of the isolation bearing, and cameras are placed along the x and y directions. To ensure that the projection of the target in the image has the same depth of field and accurately obtains the object-image relationship in the image, the optical axis of the camera and the target plane is perpendicular to each other [14], as shown in Figure 2.
The two cameras simultaneously capture the dynamic video of the isolation bear through the following process: the camera focuses on the x direction, generates still pictures continuously in frames, and preprocesses the pictures. Then, the center coordinates of the upper and lower targets, are identified, as well as the radius and .
Then, the camera video in the y direction is processed in the same way to obtain the y-direction horizontal displacement ΔYi and vertical displacement of the isolation bearing at the same time i, obtained by the camera videos in the two directions . The accuracy of the displacement calculation of each point of the isolation bearing is verified by comparing the vertical displacement of the isolation bearing .
- (1)
Considering that the deformation measurement accuracy of the isolation bearing is relatively high, the target is used for measurement. As the circular target has the advantages of simple production, high precision, and clear geometric meaning, the circular target is used. As the connecting plate of the isolation bearing does not deform during the entire movement of the isolation bearing, the target is set on the upper and lower connecting plates of the isolation bearing.
- (2)
The object-image ratio in the image is determined by the ratio of the target pixel to the physical size of the target and has nothing to do with the relative distance between the target and the camera. The optical axis of the camera and the plane of the target is set to be perpendicular to each other, so the object-image ratio of each frame can be determined by the scaling factor method.
- (3)
The horizontal and vertical displacements of the isolation bearing in one direction are obtained by measuring the relative displacement of the upper and lower targets in this direction. Therefore, this method does not need to track the camera movement and can directly determine the displacement of the isolation bearing at each time.
- (4)
To eliminate the initial relative displacement error of the upper and lower target points, the displacement of the isolation bearing is obtained by superposing the relative displacement of the isolation bearing at each time. In practical applications, the camera must be set in an isolation layer, usually indoors. Compared with the outdoor environment, the isolation layer’s environmental change is small and controllable. In the actual measurement, the camera and target material can be selected according to specific environmental conditions such as different air humidity and light brightness. Therefore, this method is still applicable to actual seismic isolation projects.
3. Target Center and Radius Detection Method
The method proposed in this paper aims to accurately identify the center coordinates and radius of the target. According to the features of the measurement environment, the center coordinates and radius of the target are identified through a combination of HSV color space, Canny edge detection, and Hough transform circle detection. Furthermore, the dynamic displacement measurement of the isolation bearing is realized. The specific process is shown in Figure 3.

3.1. HSV Color Space
Since the seismic isolation layer is usually indoors and only used as a space for equipment maintenance, the entire space has low brightness, uneven brightness distribution, and contains a small number of colors, especially less green interference objects. Therefore, the target color is selected as green. The HSV color space is based on the intuitive characteristics of the color in the image, and the image color is represented by the three components of hue, saturation, and lightness [15]. HSV color conversion is performed on each frame of the isolation-bearing image. The green color of the target is extracted, then the interference information is removed effectively, and the target in the image is accurately identified.
3.2. Canny Edge Detection
When the target in the image is recognized, the edge of the target needs to be detected. Canny edge detection is a multi-level detection algorithm based on zero-crossing, which has the advantages of being less susceptible to noise interference, having a low error rate, and having no false edges. The Gaussian filter is first used to filter and smoothen the image, remove noise, and calculate the gradient and direction of each pixel in the image. Then, non-maximum suppression is applied to reduce the spurious response caused by edge detection, and finally, double-threshold detection is applied to determine the true edge and complete the detection by suppressing isolated weak edges [16].
3.3. Hough Transform Circle Detection
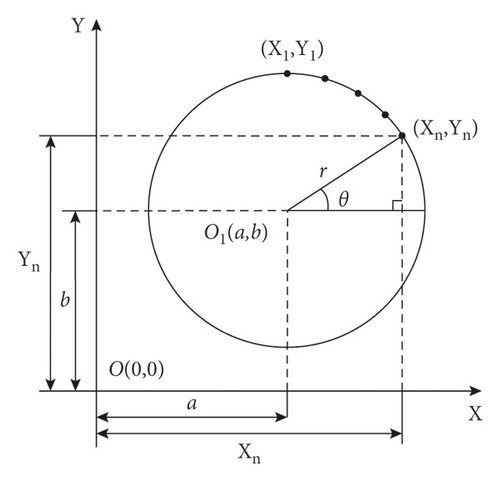
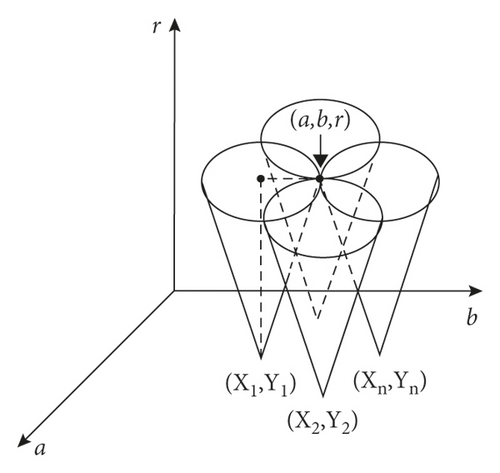
When the parameter space [a, b, r]T is used to represent any point on the edge of the target, the cones in the parameter space [a, b, r]T intersect at one point because the edge point of the target is constrained by the center and radius. As shown in Figure 4, this point is the center point of the target, and the radius is the largest among all the detected circles.
3.4. Detection Effect of Target Circle
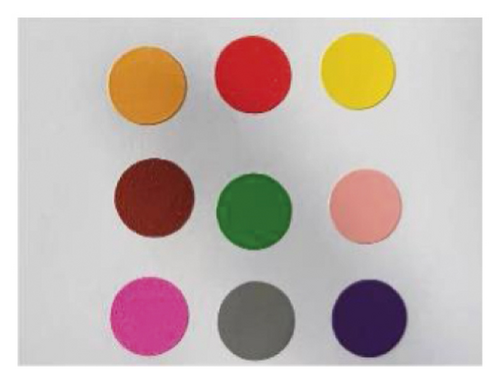
To verify the accuracy of the aforementioned method for detecting the center and radius of the target, we established an image composed of multiple colored circular targets and identified the green circular target. Image processing: the image is processing with Python and OpenCV. Firstly, the image is converted from RGB to HSV, and then the HSV image is performed by bilateral filtering. Secondly, select the color of the target threshold interval is defined as the green range, set it to 1 within the threshold ranges, otherwise set it to 0. The HSV image is converted to a binarized image, and the image is only the target circles. Thirdly, the Canny edge detection is performed to obtain the coordinates of each point on the edge of the target. Finally, the Hough circle detection is used to fit the edge of the target, and the center coordinate and the radius of the target circle are obtained. The verification result is shown in Figure 5.


4. Validation Experiment
The mechanical performance test of an LRB500 lead rubber bearing was conducted, and the entire test process was photographed to verify the feasibility and accuracy of the proposed method.
4.1. Experimental Equipment Setup
The loading equipment for the mechanical performance test of the isolation bearing adopts an electro-hydraulic servo press shearing machine with sine wave loading. The maximum vertical load is 15000 kN, the maximum horizontal load is 1000 kN, the maximum horizontal displacement is ±500 mm, and the maximum unidirectional displacement is 650 mm. With the displacement and force sensors, the displacement recording frequency is 10 Hz, and the accuracy is 0.01 mm.
Two types of video capture equipment are used. When the camera is fixed for shooting, the camera resolution ratio is 1920 × 1080, the shooting frame rate is 50 fps, the sampling frequency is 50 Hz, and the Nyquist frequency is 25 Hz. When the camera is in motion shooting, the rear camera of the mobile phone has a resolution ratio of 1920 × 1080 and a shooting frame rate of 60 fps, a sampling frequency of 60 Hz, and the Nyquist frequency of 30 Hz. The Nyquist frequency of both cameras is greater than the recording frequency of the displacement sensor.
The equipment for simulating earthquakes is a small shaking table WS-Z30-50 with the size of 516 mm × 380 mm and a weight of 11.4 kg. The table has a maximum load bearing of 35 kg and the maximum horizontal displacement of ±8 mm. It can be loaded with ground vibrations, sine waves, and other waveforms. The vibration occurs in one horizontal direction, and maximum acceleration is 2 g.
4.2. Experimental Pieces and Conditions
The test piece is a lead rubber bearing (LRB) 500. The main parameters of the bearing are shown in Table 1.
| Bearing outside diameter (mm) | Bearing height (mm) | Design compressive stress (N/mm2) | Vertical stiffness (kN/mm) | Stiffness before yield (kN/mm) | Postyield stiffness (kN/mm) | Yield strength (kN) | First shape coefficient | Second shape coefficient |
|---|---|---|---|---|---|---|---|---|
| 520 | 158 | 12 | 1916 | 11.59 | 1.159 | 65.5 | 27.5 | 5 |
The isolation bearings are tested in three conditions of horizontal shear performance = 100%, = 250%, and vertical compression performance. The test loading is based on Rubber Bearing Part III: Building Vibration Isolation Rubber Bearing (GB 20668.3), as shown in Table 2.
| Conditions | Mechanical performance | Loading situation |
|---|---|---|
| 1 | Horizontal shear, γ = 100% | Continuous vertical loading of 2355 kN, horizontal loading sine wave, loading frequency 0.05 Hz, maximum horizontal displacement 80 mm |
| 2 | Horizontal shear, γ = 250% | Continuous vertical loading of 2355 kN, horizontal loading of sine wave, loading frequency of 0.02 Hz, maximum horizontal movement of 200 mm |
| 3 | Vertical compression performance | Vertical reciprocating loading, 1648.5 kN–3061.5 kN |
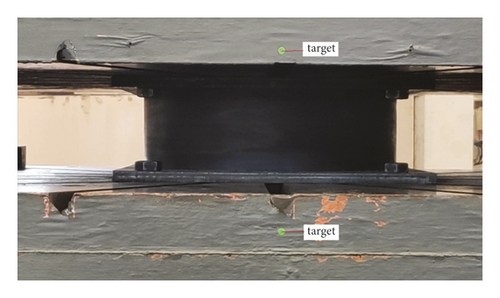
Since the horizontal mechanical performance of the isolation bearing is only one-way loading, the camera and target are only set in one direction during the experiment. A green circular target with a radius of 5.0 mm is used. As the location of the shock isolation bearing is in the center of the press, the light is blocked. To ensure clear capturing of videos, the target is attached to the upper and lower sides of the electro-hydraulic servo press during the test, as shown in Figure 6.
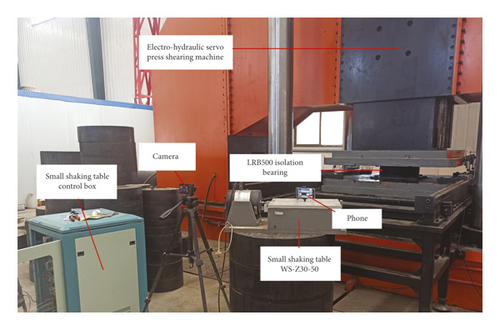
Two kinds of cameras are used to simultaneously shoot videos from the beginning to the end of the loading of each working condition of the isolation bearing. The mobile phone is fixed on the vibration table, and the vibration table continues to be repeatedly loaded with the same ground vibration from the beginning to the end of the shooting. The peak value of ground motion is adjusted to the maximum allowable displacement value of the vibration stable vibration. To simulate the movement of the camera in any direction, the vibration direction of the shaking table is set to be nonparallel to the horizontal displacement direction of the isolation bearing. The layout of the test site is shown in Figure 7.
4.3. Experimental Results
The aforementioned visual method is used to obtain the displacement time history of each working condition of the isolation bearing and compare it with the measurement result of the displacement meter. Figure 8 shows the time history of horizontal displacement when the shear deformation of the isolation bearing is 100%. Figure 9 shows the time history of the horizontal displacement when the shear deformation of the isolation bearing is 250%.
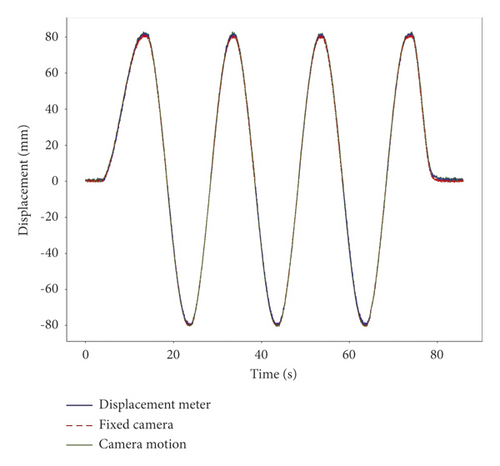
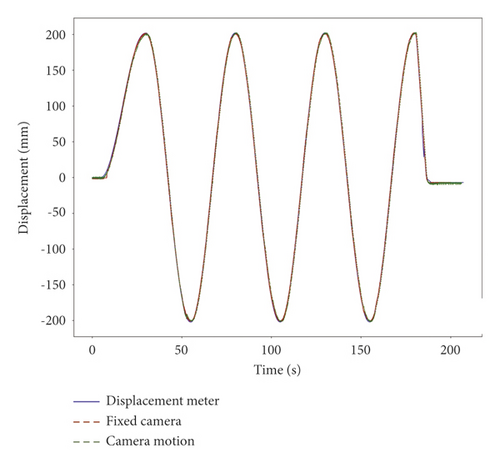
Figures 8 and 9 show that when the isolation bearing is deformed by 100% shear and 250% shear deformation, no matter whether the camera is fixed or moving, the horizontal displacement time history obtained by the visual method is basically the same as the result obtained by the displacement meter. The error of the peak value is shown in Table 3.
| Measurement method | Horizontal shear 100% | Horizontal shear 250% | ||||
|---|---|---|---|---|---|---|
| Peak value of displacement (mm) | Error value (mm) | Error ratio (%) | Peak value of displacement (mm) | Error value (mm) | Error ratio (%) | |
| Displacement meter | 80.955 | — | — | 202.278 | — | — |
| Fixed camera | 81.573 | 0.618 | 0.763 | 202.556 | 0.278 | 0.137 |
| Camera motion | 81.948 | 0.993 | 1.226 | 202.785 | 0.507 | 0.251 |
Table 3 shows that compared with the peak value of the horizontal displacement measured by the displacement meter, the measurement error using the visual method is less than 1.5%. When the camera is fixed, the maximum absolute error of the horizontal displacement peak is 0.681 mm; when the camera is moving, the absolute error of the horizontal displacement peak is 0.998 mm at most. The measurement error is larger when the camera is moved. These errors are caused by visual measurement methods. For example, after HSV color extraction, the image is subjected to morphological expansion and erosion calculations. These methods result in inconsistencies on the edges of the image. Furthermore, Hough circle detection cannot identify the optimal circle, measured radius, and coordinates of the center point. In addition, camera movement causes blurring of the image, which can also cause certain errors [18, 19]. However, the maximum absolute error of the peak horizontal displacement does not exceed 1 mm, which fully meets the accuracy requirements of the horizontal displacement measurement of the isolation bearing, indicating that the proposed visual method can complete the horizontal deformation detection of the isolation bearing under various conditions.
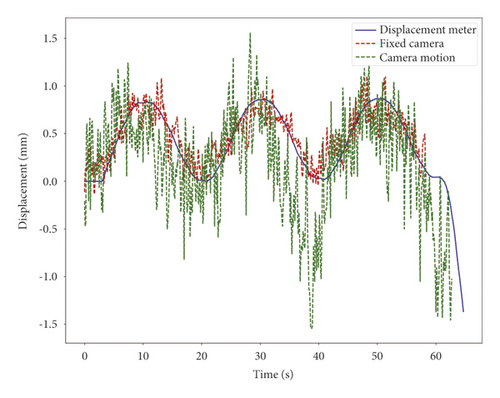
Figure 10 shows the vertical displacement time history of the isolation bearing. The figure also indicates that the waveform trend of the vertical displacement time history curve measured by the visual method is basically the same as the time history curve of the displacement meter. However, the vertical displacement time history curve measured by the visual method fluctuates continuously along with the time point, especially when the camera is moving. The reason is that, during the entire loading process, the vertical displacement of the isolation bearing is very small, and the maximum is only 0.854 mm. Compared with the absolute value of the vertical displacement, the system error caused by the aforementioned visual measurement method is more obvious. Table 4 shows the vertical displacement peaks obtained by different measurement methods.
| Measurement method | Peak of vertical displacement (mm) | Error value (mm) | Error ratio (%) |
|---|---|---|---|
| Displacement meter | 0.854 | — | — |
| Fixed camera | 1.066 | 0.212 | 24.824 |
| Camera motion | 1.545 | 0.691 | 80.913 |
Here, ΔZi is the error value of the vertical displacement at time i, is the vertical displacement result measured by the displacement meter at time i, and is the vertical displacement result measured by the vision method at time i. The results show that the maximum value of the absolute error of the vertical displacement when the camera is fixed is 0.488 mm, and the maximum value of the absolute error of the vertical displacement when the camera is moving is 1.851 mm. Under normal circumstances, the vertical displacement of the isolation bearing is less than 3 mm. Only when the isolation bearing has quality defects or the bearing is damaged can a large vertical displacement occur. Therefore, even if the measurement error of this method is approximately 1 mm, it can still identify the abnormal situation of the vertical deformation of the bearing.
5. Conclusions
- (1)
Regardless of the large or small deformation of the isolation bearing, whether the camera is fixed or moving, the horizontal displacement time history obtained by the visual method is almost the same as the result obtained by the displacement meter. The measurement error is larger when the camera is moving. However, compared with the result measured by the displacement meter, the absolute error of the peak horizontal displacement is less than 1 mm, and the error ratio is less than 1.5%, which meets the accuracy requirements of the horizontal displacement measurement of the isolation bearing. This result shows that the proposed visual method can complete the horizontal deformation detection of the isolation bearing under various conditions.
- (2)
The waveform trend of the vertical displacement time history curve measured by the visual method is basically the same as the time history curve of the displacement meter, but it fluctuates continuously along with the time point. The reason is that the vertical displacement of the isolation bearing is less than 1 mm. Compared with the absolute value of the vertical displacement, the systematic error caused by the visual measurement method is clear, but the maximum absolute error is only 1.851 mm.
Limited by the experimental equipment, the displacement of the camera in the experiment is ±8 mm. In the actual seismic survey, the camera is fixed on the ground or superstructure, the relative displacement between the camera and the isolation bearing is the horizontal displacement of the isolation bearing, and the range of displacement can be estimated in advance. Therefore, if the field of view of the camera is set to be wider than the horizontal displacement of the isolation bearing, then accurate measurement results can be obtained. This method is still applicable to actual seismic isolation projects.
Conflicts of Interest
The authors declare that they have no conflicts of interest.
Acknowledgments
The authors would like to acknowledge the financial support from the National Natural Science Foundation of China under contract nos. 51668043 and 62166025.
Open Research
Data Availability
The data used to support the findings of this study are available from the corresponding author upon request.


