A New Model for Microbial Desalination Cells: Model Formulation and Validation under Different Operating Conditions
Abstract
In this paper, a dynamic mathematical model was developed to simulate the processes in Microbial Desalination Cells (MDCs) operated in cyclic batch flow mode using ordinary differential equations found in the literature. In contrast to previous models, the proposed model was developed for fed-batch operations and considers the effects of temperature and substrate inhibition using simple equations for quick simulation. Local sensitivity analysis was performed to determine the parameters with the least impact on current, COD, and salt removal, which were then eliminated from the simplified model. These parameters were found to be the decay rates of anodophilic and methanogenic microorganisms (kd,aand kd,m) and the internal resistance parameters (Ranolyte and Rmembrane). In addition, the best-performing parameters based on the sensitivity analysis results were selected for reestimation for model fitting. The reestimated parameters were mediator yield (Y), membrane salt transfer coefficient (d), maximum substrate utilization rate by methanogenic microorganisms (μs, m, max), and maximum anodophilic growth rate (μa, max). The predictions of the model were consistent with both our previous experimental data and experimental studies found in the literature and can be easily used by experimentalists for the rapid simulation and prediction of an MDC’s performance under different operating conditions.
1. Introduction
In the present day, energy and water security are global challenges that have increased in importance due to increasing populations, rising energy demands, and water shortages. In addition, the growth of the economy and rapid urbanization around the world has led to high energy and water demands [1] According to the United Nations, 2.7 billion people will have difficulties accessing safe drinking water by 2025, and approximately 20% of countries will face serious water shortage problems [2]. Recently, water reclamation and desalination have become alternative sources of water to support the increasing demand for fresh water; however, traditional wastewater treatment and desalination technologies consume large amounts of energy. Conventional wastewater treatment systems, which are mainly based on activated sludge processes, are energy-intensive processes due to the high energy requirements of aeration. Although, energy recovery can be achieved using anaerobic wastewater treatment such as UASB [3]; however, it is a complicated process and required many steps such as gas treatment and fails at low temperatures and at low strength wastewater conditions. Regarding desalination, the most commercially used processes require large amounts of energy; for example, reverse osmosis requires 3–7 Kwh/m3 of energy [4]. Conventional desalination technologies are also a source of greenhouse gas emissions as they are mostly powered by fossil fuel sources [5]. Microbial desalination cells (MDCs) are one of the bioelectrochemical systems that desalinate salty water using current generated from the oxidation of organic matter, allowing it to achieve three primary goals: energy production, wastewater treatment, and desalination [6]. It is reported that an MDC can produce 1.8 kWh of bioenergy while desalinating 1 m3 of salty water with a desalination efficiency of more than 90% [7].
An MDC’s performance is controlled by operational, design, and biological parameters; hence, any large-scale applications require a strong understanding of the relationships between these various parameters to achieve optimal performance. MDC modeling is thus essential for studying this complicated system, which is affected by physical, chemical, biological, and electrochemical factors that are dynamically linked; doing so helps to optimize and scale up MDC operations [8]. Despite its relative importance, there are only a few MDC papers about modeling in the literature; the majority of these studies have been experimental. The Scopus database indicates that less than 178 articles have been published on MDCs as of 2020, and only a few of those were about MDC modeling [5].
One of the first well-established models was developed for continuous flow by Ping et al. [4]; this model was expanded by the same research group to include brackish water desalination [9]. These models aimed for a better prediction of the variations in salinity and the concentration of individual ions [9]. Both models [4, 9] were formulated based on ordinary differential equations (ODEs), which include mass balances for the substrate, microorganisms, mediators, and salt, as well as taking time into account; however, it does not consider spatial dimensions. In addition, the Monod model was used for microbial growth kinetics in both models; however, the first model assumed that salt removal occurred due to diffusion and potential gradients [4], while the improved model considered the dilution effect due to osmotic flow as an additional reason for salt removal [9]. In addition, the improved model incorporated current efficiency, restricted diffusion, and junction potential [9], leading to a more complex model. The first model was more appropriate for generating comprehensive predictions of the MDC’s three functions. Ping et al.’s models were expanded to study boron removal in different BEs [10] in a combined FO-MDC system [11] and to model predictive control [12–14].
This study was aimed at presenting a simple mathematical model that describes the important processes that occur in MDCs. The proposed model can help experimentalists rapidly predict the overall performance of the MDC, allowing them to optimize the system while carrying out experiments. The main difference between the proposed model and other previous models is that it was developed to predict the performance of fed-batch modes (cyclic batch flow). It also considers the effects of temperature and substrate inhibition, allowing the model to predict the performance of the MDC under different operating conditions. As the main goal of this paper was to propose a simplified model, the number of parameters was reduced via sensitivity analysis, eliminating the least effective parameters. The model was also validated using experimental data and the results of sensitivity analysis were used to determine the best-performing parameters that would be reestimated during model calibration and validation. The model was used to evaluate the effects of important operating parameters (external resistance, temperature, and salt and substrate concentrations) on key performance indicators of MDCs. The model predictions were subsequently compared with trends observed in experimental results.
2. Materials and Methods
2.1. Model Assumptions and Development
- (i)
the MDC is operated in fed-batch mode
- (ii)
the substrate in the anode chamber is homogenized, and microorganisms are uniformly distributed across the anode biofilm
- (iii)
the presence of anodophilic microorganisms, which are responsible for the release of electrons, as well as methanogenic microorganisms, which compete with anodophilic microorganisms for the substrate but do not contribute to current production
- (iv)
microbial growth kinetics as described using the Haldane model
- (v)
the intracellular electron transfer mediator is assumed to be constant
- (vi)
the pH is constant
- (vii)
salt removal in the middle chamber is due to both potential and the salt concentration gradient
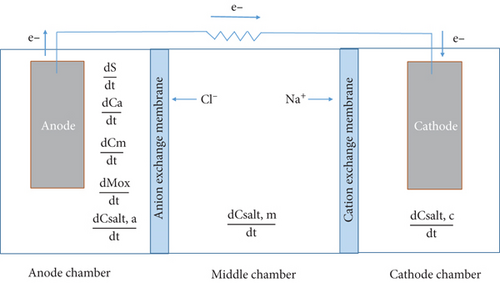
The structure of the model was developed using mass balance equations for the concentration of the substrate, microorganisms, and oxidized mediators in the anode chamber and salt concentrations in all chambers. The model was implemented in MATLAB using ode15s for solving stiff differential equations and DAEs. The equations that define the model are described in the following subsections. A conceptual schematic of an MDC is shown in Figure 1.
2.2. Mass Balance of the Substrate
2.3. Mass Balances for Microorganisms
2.4. Mass Balance of the Mediator
2.5. Microbial Kinetics Equations
2.6. Mass Balance for Salt Concentrations
2.7. Electrochemical Equations
2.8. Sensitivity Analysis
Based on the results of the sensitivity analysis, the best-performing parameters were reestimated using experimental data. The values of the other parameters were chosen based on a literature review. To determine the values of parameters to be reestimated during model fitting and validation, a criterion was used that minimized the error between the model predictions and the experimental results for COD removal efficiency, maximum current, desalination efficiency, and the Coulombic efficiency.
2.9. Analysis and Calculations
3. Results and Discussion
3.1. Model Reduction
3.2. Effect of External Resistance
External resistance is an important parameter that affects the amount of current produced and the competition between electrogenic and nonelectrogenic microorganisms [22]. Experimental literature data for cyclic batch flow MDCs from our previously published work [23], which was operated under a range of external resistances, were used to validate the MDC model developed in this study and evaluate its predictions across a range of external resistances. The model was fit at an external resistance of 10 Ω and then validated at the following external resistances: 100 Ω -500 Ω -5000 Ω -10000 Ω. The concentrations of the substrate (sodium acetate) and salt (NaCl) were 500 mg/l and 10 g/L during the three-day cycle, respectively. Any parameters that had been judged to be important based on sensitivity analysis, but could not be quantified from the experiments, were reestimated. The rest of the parameters were estimated based on values from the literature as shown in Table 1. Based on the sensitivity analysis, the reestimated parameters, which has the largest effect on MDC performance, were mediator yield (Y), membrane salt transfer coefficient (d), maximum substrate utilization rate by methanogenic microorganisms, and maximum anodophilic growth rate.
| Parameter | Value | Dimensions | Ref. |
|---|---|---|---|
| Y | 23 | [mg-M.- mg-S-1] | Estimated |
| d | 0.024 | [d-1] | Estimated |
| μa,max | 0.3 | [d-1] | Estimated |
| μs,m,max | 11.3 | [mg-S-mg-x-1 d-1] | Estimated |
| μm,max | 0.1 | [d-1] | [4] |
| μs,a,max | 5.32 | [mg-S -mg-x-1 d-1] | [4] |
| Ka | 20 | [mg-S L-1] | [4] |
| Km | 80 | [mg-S L-1] | [4] |
| KM | 0.2∗Mtot | [mg-M mg-x-1] | [16] |
| Ki | 3748 | [mg-S L-1] | [27] |
| θ | 1.07 | Unitless | [28] |
| R | 8.314472 | [J K-1 Mol-1] | Physical constant |
| T | 300 | [K] | Physical constant |
| ne | 2 | [mol-e-mol-mediator-1] | [16] |
| F | 96485 | [As mole-1] | Physical constant |
| Mtot | 0.05 | [mg-M mg-x-1] | [16] |
| Kr | 0.082 | [L mg-x-1] | [4] |
| γ | 663,400 | [mg-M molmed-1] | [16] |
The model results (Figure 2) were consistent with the experimental results across all external resistances except for COD removal efficiency. The experimental observations followed a nonlinear trend as the COD removal efficiency was semiconstant between 10 and 100 Ω, increased to a maximum at 500 Ω, and then decreased between 500 and 10000 Ω. The low COD removal efficiencies at high external resistances were attributed to the consumption of energy during the production of extracellular polymeric substances (EPS). In addition, the Coulombic efficiency followed a nonlinear trend between 10 and 500 Ω; this may be due to factors related to the operating conditions and uncontrolled interactions within the cell.
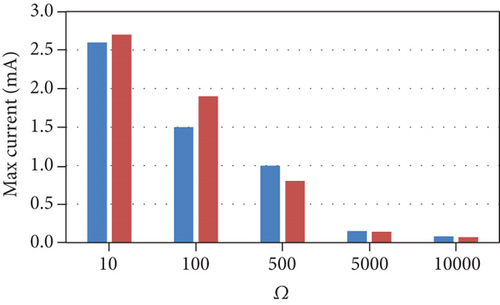
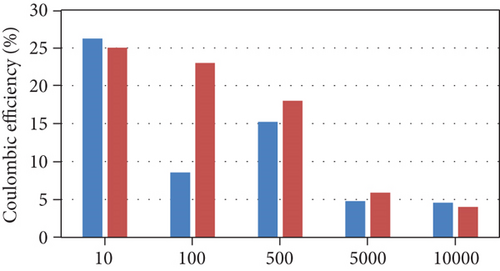
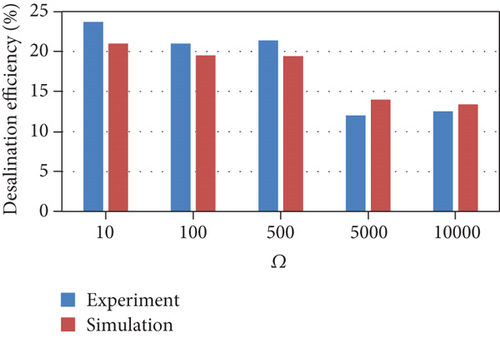
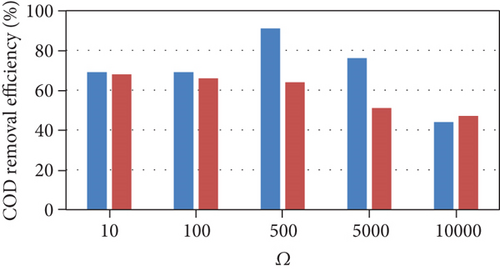
The current model indicates that an increase in external resistance causes a decrease in the current produced; consequently, the desalination rate decreases. The COD removal rate also decreases because the growth rate and substrate consumption rate of anodophilic microorganisms are a function of the concentration of the oxidized form of the mediator, which decreases as current decreases. As a result, the substrate becomes more readily available for methanogenic microorganisms, leading to a decrease in the Coulombic efficiency. This indicates that lower resistances are better for anodophilic microbial growth.
The model trends are consistent with many other experimental results. Lower external resistances lead to the generation of higher current due to high electron transfer to the cathode and high electrogenic activity [24, 25]. As the current produced from the oxidation of organic matter is the main driving force for the desalination process, lower resistances increase the speed of the desalination process [23, 24]. In addition, many experimental studies reported that COD removal efficiency decreases with increasing external resistance [25, 26]. Pinto et al. [16] reported that at higher external resistances, the methane production increases. A high external resistance also lowers the potential of the anode, allowing fermentative and anaerobic microorganisms to become dominant; conversely, lower external resistances are more favorable for electrogenic microorganisms, resulting in a decrease in the Coulombic efficiency as external resistances increase [26].
3.3. Effect of Temperature
Experimental literature data of cyclic batch flow MDCs from our previous published work [29] were also used to validate the proposed MDC model. The MDCs were operated under different temperatures (12, 27, and 45°C). The model was fitted at a temperature of 12°C; the model was subsequently validated at a temperature of 27°C, while substrate (sodium acetate) and salt (NaCl) concentrations were 1000 mg/l and 20 g/L over a two-day cycle, respectively. The reestimated parameters were mediator yield (Y), membrane salt transfer coefficient (d), maximum substrate utilization rate by methanogenic microorganisms, and maximum anodophilic growth rate; these were estimated to be 8 mg∙mg-1, 0.018 d-1, 11.3 mg∙mg-1∙d-1, and 0.3 d-1, respectively. The results of model fitting and validation are shown in Table 2.
| COD Removal Eff. % | Desalination Eff. % |
Max current mA |
Coulombic Eff. % |
|
|---|---|---|---|---|
| Temperature 12 Celsius | ||||
| Experiment | 46 ± 10 | 9.4 ± 4.3 | 0.08 ± 0.04 | 1.04 ± 0.56 |
| Simulation | 38 | 6.3 | 0.11 | 1.91 |
| Temperature 27 Celsius | ||||
| Experiment | 86 ± 5.7 | 9.7 ± 1.35 | 2.1 ± 0.55 | 10.22 ± 3.14 |
| Simulation | 89 | 10.9 | 2.1 | 9.65 |
The experimental and model results show that COD removal, Coulombic efficiency, salt removal, and current increase as temperature increases from 12 to 27°C. However, at 45°C, the experimental results exhibit a nonlinear trend as the maximum current density, COD removal, and Coulombic efficiency decrease; in contrast, the salt removal increases. These results were not consistent with the linear trend of the model, which used a modified Arrhenius equation, so it can be used until the optimum temperature.
Several experimental studies have evaluated the effect of temperature on bioelectrochemical systems to determine the optimal operating temperature. Feng et al. [30] observed a linear increase in the performance of fed-batch MFCs in terms of COD removal efficiency, voltage and power output, and Coulombic efficiency % as temperatures were increased from 15 to 30°C. Behera et al. [31] found that batch MFC achieved maximum COD removal efficiency, Coulombic efficiency, and power density at 40°C when operated across a range of temperatures between 20 and 55°C. Moon et al. [32] found that the performance of MFCs improved between 24 and 35°C and then decreased between 38 and 41°C. Gadkari et al. [8] observed that the MFCs achieved the maximum power density at 34°C when operated at temperatures ranging between 20 and 40°C. Li et al. [33] reported that fed-batch MFCs reached their maximum power density and COD removal efficiency at 37°C, and their maximum Coulombic efficiency at 43°C when operated within a temperature range of 10 to 55°C. Based on the results of the aforementioned experimental studies, and considering that the modified Arrhenius equation exhibits errors of around 15% at 40°C and 25% at 50°C [34], the model calibration indicates the model can be used within a temperature range of 12 to 35°C.
3.4. Effect of the Initial Concentration of the Substrate
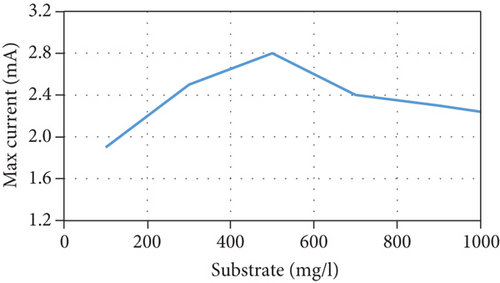
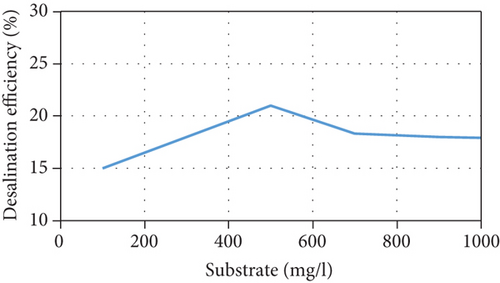
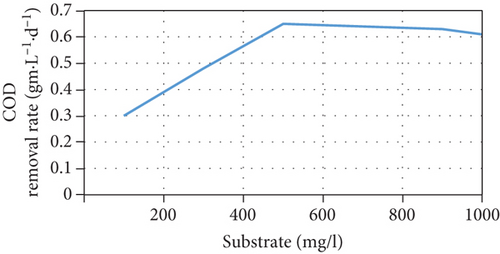
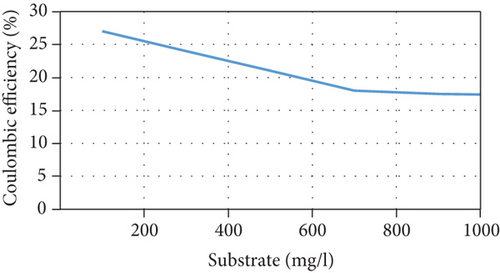
The current model suggests that at low substrate concentrations, the rate of substrate consumption and growth rate of microorganisms increases when the substrate concentration increases until they reach a maximum rate, following which they decrease due to the inhibition effect. In addition, the current increases due to an increase in the concentration of anodophilic microorganisms, which favors the migration of ions in the salt chamber. There is also an inverse relationship between the initial substrate concentration and Coulombic efficiency because the high availability of substrate causes an increase in the competition between the microorganisms. This affects not only the production of current by anodophilic microorganisms but also its consumption by methanogenic microorganisms. These trends are consistent with previous experimental results [35, 36]. However, at high substrate concentrations, the growth rate of microorganisms and the substrate consumption rate decrease, negatively affecting the performance of the MDC; this has been reported in several publications [23, 37]. The model’s predictions of MDC performance as a function of different initial substrate concentrations are shown in Figure 3.
3.5. Effect of the Initial Salt Concentration
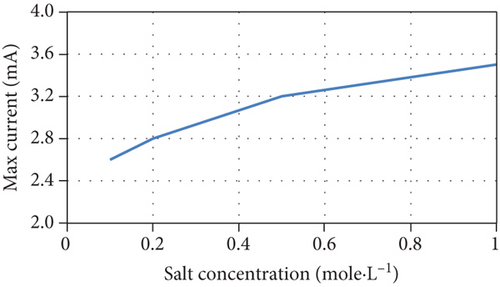
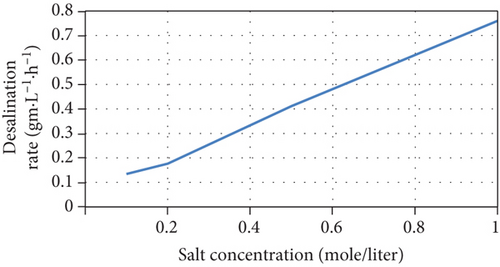
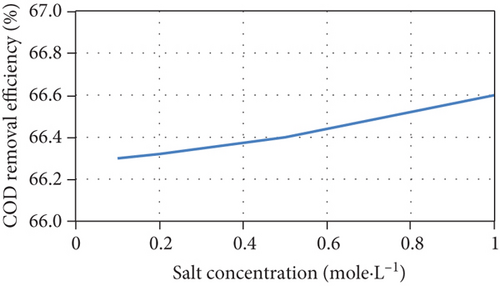
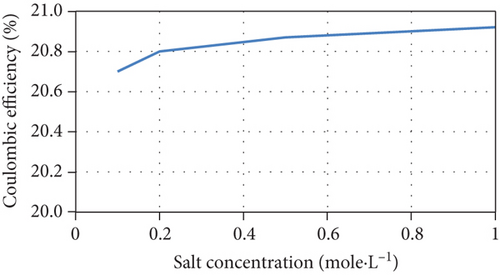
The current model indicates that an increase of initial salt concentrations results in the steepening of the concentration gradient between chambers, improving the desalination rate. In addition, the current increases due to the increase in junction potential, consequently increasing the removal of salts and the Coulombic efficiency, as well as a slight increase of COD removal efficiency. The model’s predictions are consistent with experimental results [38, 39]. The model’s predictions of the performance of the MDC as a function of different initial salt concentrations are shown in Figure 4.
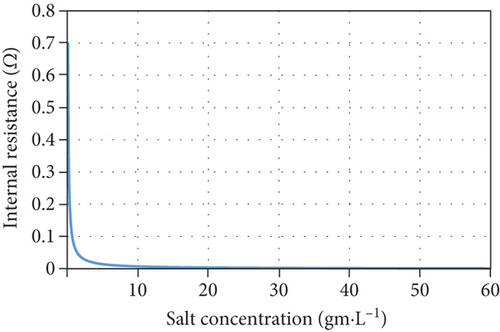
However, it was reported that another reason for the increase in salt removal and current production is the increase in electrical conductivity and the corresponding decrease in internal resistance when salt concentrations increase [40]. Although the model considers salt resistance to be a function of salt concentration, Equation (16) cannot be used for all MDC configurations and middle chamber volumes as it underestimates the effect of salt concentration on internal resistance as shown in Figure 5 when compared with other experimental data in literature [41, 42].
4. Conclusion
This work represents an attempt to understand the complicated system of MDCs through the use of a simple yet comprehensive mathematical model. The model was used to predict the performance of MDCs under different operating parameters; the outputs of the model were evaluated and compared with experimental results. The predictions of the final MDC model were found to be mostly consistent with the results of experimental studies; this suggests that the model can evaluate the performance of MDCs under different operating conditions. The proposed model can be used by experimentalists to rapidly predict the performance of MDCs in terms of current, COD, and salt removal and can be used to understand the processes involved in MDC before performing detailed numerical studies. While the model predictions were consistent with the experimental results under most different operating conditions, there were still some trends that differed between the two. These could be due to factors related to the design and configuration of the MDC, or due to complex interactions within the MDC that require further experimental and numerical studies to fully understand. Future studies should be focused on improving the accuracy of the proposed model. The equations that describe the effects of temperature should be modified such that their range can be extended to predict the performance of the MDC at temperatures greater than the optimum. A study on the effects of pH on the MDC is also recommended, as this is a parameter that can affect microbial activity, which consequently affects the current production and desalination rate. In addition, cathode reactions and their effect on the performance of MDC should be considered. Also, the effect of fouling of exchange membranes on the performance of MDC should be considered for better model predictions in the long run.
Conflicts of Interest
The authors declare that they have no conflicts of interest.
Open Research
Data Availability
All the data used to support the findings of this study are included within the article.


