Carbon Quantum Dots-Based Fluorescent Hydrogel Hybrid Platform for Sensitive Detection of Iron Ions
Abstract
In this study, we prepared novel fluorescent carbon quantum dots/hydrogel nanocomposite material (CQDsHG) with good adsorption and stable fluorescence detection of Fe3+. The materials were subsequently characterized according to their morphological features, chemical composition, adsorption, and optical properties. The carbon quantum dots (CQDs) were prepared using a microwave-assisted hydrothermal method in no more than 15 min, and the as-prepared CQDs exhibited excellent water solubility, as well as emitted strong bright blue fluorescence with an ultrahigh quantum yield of 93.60%. The CQDs were then loaded into a hydrogel (HG) using the sol-gel method to obtain a functional CQDsHG. The CQDsHG exhibited high adsorption amounts (31.94 mg/g) and a good quenching response for Fe3+, thus, it could be used as a sensor to selectively detect Fe3+ in the linear range of 0–150 μM with a detection limit of 0.24 μM. We observed minimal difference in the fluorescence lifetimes between the CQDsHG with and without a quencher (Fe3+), with values of 5.816 ns and 5.824 ns, respectively, confirming that Fe3+ was statically quenched on CQDsHG. The results indicated that the innovative combination of CQDs and HG can improve the synergistic performance of each component for the adsorption and quantitative detection of heavy metal ions in the aqueous environment.
1. Introduction
Iron (Fe3+) is one of the most abundant and essential trace elements for humans and animals [1]. In humans, insufficient or excessive Fe3+ levels can induce a variety of diseases including hemochromatosis, diabetes, liver damage, heart failure, anemia, and Parkinson’s disease [2, 3]. Therefore, Fe3+ detection has attracted attention from researchers, and currently, a variety of well-established Fe3+ detection methods have been reported, such as atomic absorption [4], inductively coupled plasma mass spectrometry (ICP-MS) [5] and electrochemical analysis [6]. However, most of these techniques require large instruments and complex procedures, which greatly limits their applications. In recent years, fluorescence analysis has attracted significant attention, as it offers advantages such as simple operation, high sensitivity, and a fast response time [7, 8].
Recently, there has been an increase in the use of carbon quantum dots (CQDs) as fluorescent probes for chemical sensing, including Hg2+, Zn2+, Pb2+, and Fe3+ [9–12], due to their unique optical properties, good biocompatibility, excellent water solubility, low cost, and low toxicity [13–15]. In addition, they can be used for a wide range of applications, including photocatalysis, bioimaging, and fluorescent textiles [15–19]. However, the main issue with carbon quantum dots-based sensors is that the fluorescent probes have to be mixed with aqueous solutions for subsequent fluorescence determination of the samples, which is not favorable for rapid in situ detection. Many CQDs applications can only be effectively implemented when they are embedded in solid matrices. Therefore, a quasi-solid platform that preserves the properties of CQDs in solution prevents fluorescence quenching due to self-aggregation of CQDs [20] and is used for CQDs dispersion and immobilization is necessary [21]. Among the various solid matrices, hydrogels are the preferred framework for CQDs, because they offer transparency, semi-wetting characteristics, simple processing, and a highly tunable 3D porous structure [22]. Furthermore, the high specific surface area allows the hydrogels to accommodate a variety of micro and nanoparticles. This effectively prevents quantum dots clustering and greatly improves the fluorescence stability of the quantum dots. Several studies on the loading of CQDs into hydrogel networks have been reported [23–26], and CQDs/hydrogel composites have become important soft materials, with shared polymer and CQDs properties for use in interesting applications.
In this study, we fabricated a carbon quantum dots-based fluorescent hydrogel, which was used as a solid sensor for optical Fe3+ detection. The CQDs, with an ultrahigh fluorescence quantum yield of 93.60%, were prepared using a microwave-assisted hydrothermal method with citric acid. Then, the synthesized CQDs were introduced into the hydrogel framework via physical crosslinking. We then investigated the properties, structures, adsorption models, and photoluminescence characteristics of the CQDsHG, and the sensing properties of the CQDsHG for Fe3+ were explored. The results showed that the CQDsHG had potential applications as an effective bifunctional sensor with Fe3+ detection and adsorption properties.
2. Materials and Methods
2.1. Materials
Citric acid monohydrate (CA), urea, aqueous ammonia (NH4OH, 25%), glycine, and ethylenediamine (EDA) were provided by the Sinopharm Chemical Reagent Co. In addition, sodium dodecylbenzene sulfonate (SDBS), acrylic acid (AA), stearyl methacrylate (SMA), acrylamide (AM), potassium persulfate (KPS), CuSO4, MgCl2, FeCl3, BaCl2, CoCl2, Pb (NO3)2, CaCl2, CdCl2, ZnCl2, and HgCl2 were provided by the Aladdin Industries. All reagents were analytical reagent grade and ultrapure water was used throughout the experimentation process.
2.2. Apparatus
The CQDs were prepared using a microwave-assisted-hydrothermal synthesizer (MD20H, Oprah Technology Group, Inc.). X-ray powder diffractograms were obtained using an X-ray diffractometer (D8-FOCUS, Bruker, Germany). Materials chemical compositions of the materials were measured using an X-ray photoelectron spectrometer (ESCALAB Xi+, Thermo Fisher Scientific, USA). The infrared spectra in KBr were obtained using a Fourier transform infrared spectrometer (FTIR BXII, Perkin-Elmer, USA). Raman spectra were recorded using a Raman spectrometer (LabRAM HR Evolution, HORIBA Scientific, France) with a 514 nm laser beam. The morphologies were observed by high-resolution transmission electron microscopy (JEM-2100F, JEOL Ltd., Japan). Fluorescence experiments were performed on a fluorescence spectrophotometer (FL-7000, Hitachi, Japan), and samples fluorescence lifetime measurements were obtained using steady-state transient fluorescence spectrometry (FL-7100, Hitachi, Japan). The UV/Vis spectrum was determined by a spectrophotometer (T6, Pu-Analysis General Co., Ltd., China and Cary series UV-Vis-NIR, Agilent Technologies, Inc.). Moreover, a flame atomic absorption spectrophotometer (FAAS, A-6300C, Shimadzu, Japan) and an inductively coupled plasma mass spectrometer (ICP-MS, 2030LF, Shimadzu, Japan) were used to detect the metal ions. Photographs were obtained with a quadruple UV analyzer (WFH-203C, Shanghai JingKe Industrial Co., Ltd., China). Lastly, compression tests were performed on HG and CQDsHG using a microcomputer-controlled electronic universal testing machine (104B-EX, Shenzhen Wan Xiao Testing Equipment Co., Ltd., China).
2.3. Design and Analysis of the Orthogonal Experiment
The orthogonal experiments were used to investigate the fluorescent quantum yield of the CQDs (details are presented in supplementary materials). The three-level four-factor orthogonal experiment was designed to investigate the effects of various reaction conditions, such as the citric acid dosage, reaction temperature, reaction time, and microwave power on the carbon quantum dots, and optimize the basic conditions (Tables S1–S3). Secondly, we designed the orthogonal experiments to determine the effects of nitrogen doping type and nitrogen doping amount on the fluorescence quantum yield (Tables S4–S6).
2.4. Synthesis of Carbon Quantum Dots (CQDs)
In this study, the CQDs were synthesized using the microwave-assisted hydrothermal method. The citric acid (0.005 mol) was dissolved in water (10 mL) while stirring, followed by the addition of ethylenediamine (0.005 mol). The mixture was ultrasonicated for 3 min and then transferred to a 100 mL microwave digestion tank. The reaction was carried out at 700 W and 160°C for 15 min in a microwave-hydrothermal synthesizer, and the resulting CQDs solution was cooled to room temperature and filtered using a 0.22 μm filter membrane to remove any macromolecular impurities. Afterward, the solution was dialyzed for 9 h using a dialysis bag (MW500) and freeze-dried for 36 h to obtain the light-yellow N-doped CQDs.
2.5. Synthesis of the Fluorescent Hydrogel (CQDsHG)
In this study, 2.30 g of SDBS and 12.80 g of AM were added to 60 mL (0.6 g/L) of CQDs solution. Then, 2.44 mL of AA and 1.15 g of SMA were added to the above solution, the mixture was stirred in a water bath at 40°C until the SMA was completely dissolved, and then, the initiator KPS was added (0.5 wt% of the total monomer mass). After stirring for another 10 min at room temperature, the solution was injected into a custom-made sealed model, and nitrogen bubbling was employed for 10 min to eliminate oxygen from the solution. Finally, the prepared solutions were placed in a water bath at 60°C for 12 h to obtain the fluorescent hydrogel (CQDsHG), and the resulting hydrogel was repeatedly rinsed with ultrapure water to remove excess reactants and a neutral pH was obtained. For the control, the blank hydrogel (HG) was synthesized following the same procedures as described above, but without the addition of CQDs during synthesis. The CQDsHG and HG were then stored in the dark before use.
2.6. Determination of Fluorescence Quantum Yield
2.7. Pressure Performance Test
The CQDsHG was fabricated into a cylindrical specimen, and the diameter and original thickness of the specimen were measured with vernier calipers. The specimen was compressed at a uniform speed, with a load of 500 N and a speed of 50 mm/min, until the deformation reached 85%. The data were then saved to produce a graph.
2.8. Hydrogel Adsorption Experiments for Fe3+
where Ce (mg/L) is the equilibrium Fe3+concentration, qmax (mg/g) denotes the theoretical maximum adsorption amount, b (L/mg) is the Langmuir adsorption constant, KF (L/g) is the Freundlich constant that indicates the adsorption amount, and n is the heterogeneity factor representing the adsorption intensity.
2.9. Real Sample Analysis
To evaluate the practicality of the CQDsHG for real sample analysis, Fe3+ concentrations in tap water and lake water were analyzed using the spiked recovery method with CQDsHG as a sensor. The lake water was sampled from the local Beichuan Lake, and all water samples were filtered through a 0.22 μm membrane before analysis.
3. Results and Discussion
3.1. Preparation Route of CQDsHG
The preparation route of the fluorescent hydrogel is shown in Figure 1. Citric acid and ethylenediamine were mixed to create N-doped CQDs with a uniform size using the microwave-assisted hydrothermal method in a remarkable 15 min. The quantum yield (QY) of the as-prepared CQDs reached 93.60%, which was higher than the reported results shown in Table S7. In order to find the mechanism for the ultrahigh quantum yield, we studied the synthetic condition of the CQDs by designing orthogonal experiments, which gives the result as follows: EDA (0.005 mol) and citric acid (0.005 mol) at 160°C for 15 min at 700 W. The results show that N-doping is very important to improve quantum yield (QY). The highest QY of CQDs without N-doping was only 16.26%. After N-doping optimization, the QY of CQDs was improved a lot.
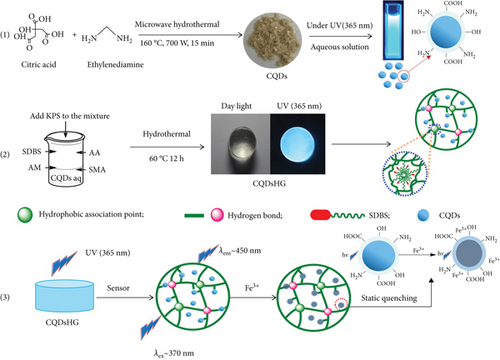
Then, the CQDsHG was successfully prepared using irregular free radical copolymerization, where the CQDs were used as the fluorescence source; AA and AM were the hydrophilic monomers; SMA was the hydrophobic monomers; SDBS was the surfactant, and KPS was the initiator. The CQDs could be dispersed and immobilized in the hydrogel through extensive hydrogen bonding to avoid leakage in water. Thus, the resulting CQDsHG exhibited synergistic performance of polymers and CQDs and emitted blue light under UV irradiation (365 nm) as shown in Figure 1. Follow-up studies showed that the CQDsHG could be used for quantitative detection of Fe3+ based on fluorescence quenching.
3.2. Characterization of the CQDs and CQDsHG
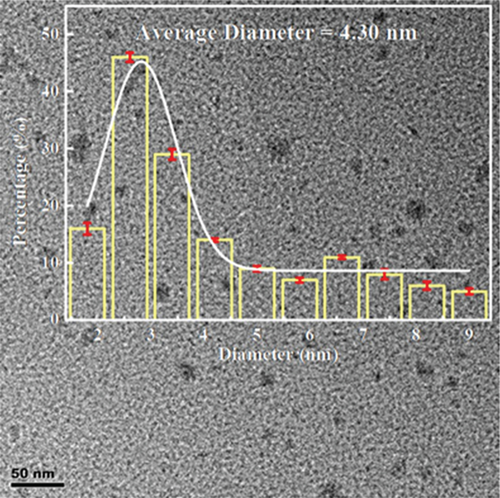
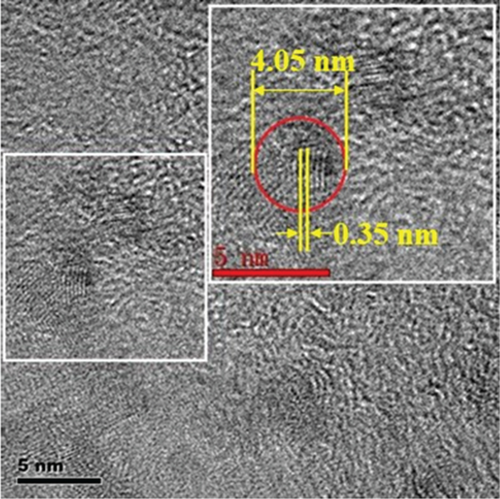
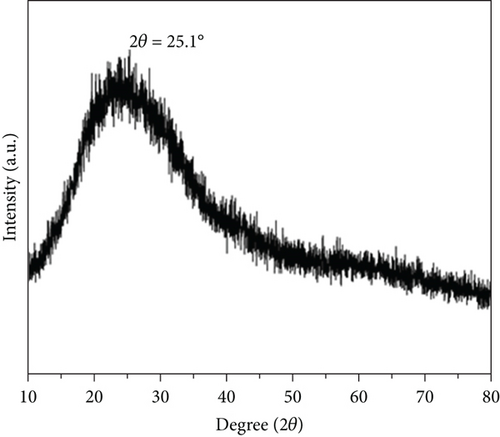
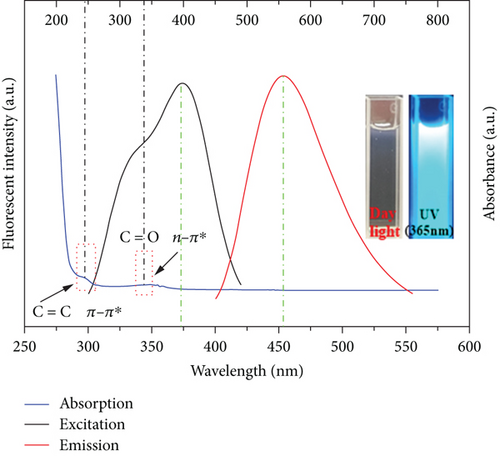
The obtained CQDs were almost spherical in morphology, with a particle size distribution mostly between 2 and 3 nm, and an average diameter of about 4.30 nm (Figure 2(a)). Furthermore, the HRTEM image showed a crystalline surface spacing of 0.35 nm (Figure 2(b)). As shown in Figure 2(c), the XRD pattern for the CQDs had a broad diffraction peak at 2θ = 25.1°, which corresponded to the (002) crystalline spacing of graphitic carbon, indicating that the synthesized CQDs had an amorphous structure. The calculated layer spacing d for the CQDs was 0.35 nm, which was consistent with the HRTEM result. The Raman spectrum of the CQDs (Figure S1) showed the characteristic G band (related to a crystalline sp2 carbon network) at 1588 cm-1 and the D band (related to disordered graphite or glassy carbon) at 1348 cm-1, with an intensity ratio ID/IG of 1.00. The intensity ratio indicated defects of the CQDs with a partially disordered crystal structure, arising from the small sp2 cluster size [31, 32]. In the UV/Vis spectra of the CQDs aqueous solution (Figure 2(d)), two typical absorption peaks at 238 nm and 346 nm were observed, corresponding to the π − π∗ transition of the aromatic sp2-hybridized domains and n − π∗ transition of the sp3-hybridized domains, respectively [23]. Upon excitation at 370 nm, the fluorescence spectra of the aqueous CQDs exhibited a strong blue emission at 450 nm, which confirmed that the CQDs had a larger Stokes shift [25].
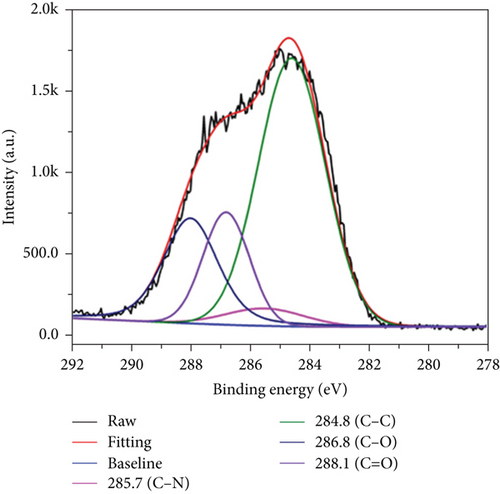
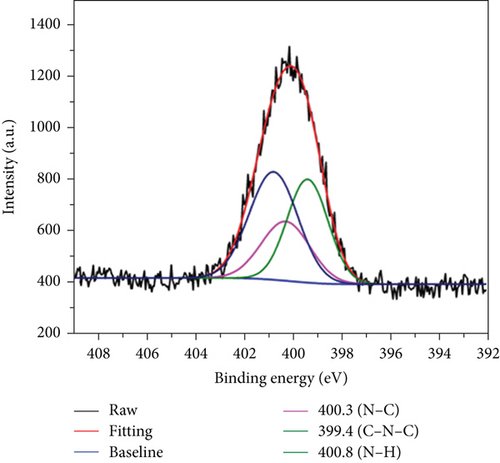
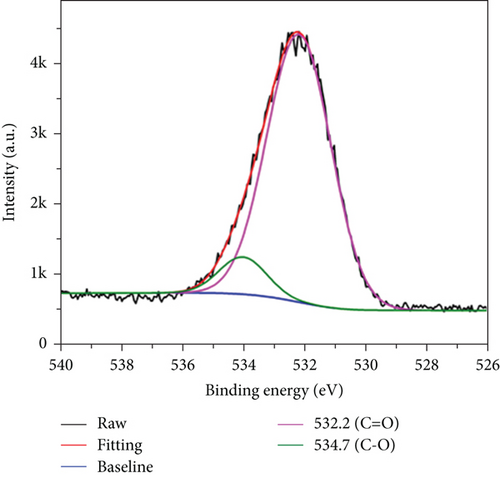
XPS was used to determine the functional groups and elemental composition on the CQDs surfaces. In the wide-scan XPS spectrum of the CQDs (Figure 3(a)), three major peaks at 284.6, 399.9, and 532.4 eV were observed, which were attributed to C1s, N1s, and O1s, respectively. The contents of carbon, nitrogen, and oxygen were calculated to be 57.48%, 11.82%, and 30.70%. Furthermore, the high-resolution XPS spectra of C1s (Figure 3(b)) had four constitute of carbon bonds, corresponding to C-C at 284.8 eV, C-N at 285.7 eV, C-O at 286.8 eV, and C=O at 288.1 eV, respectively [33]. As shown in Figure 3(c), the N1 spectra could be curve fitted with three peak components at 399.4, 400.3, and 400.8 eV, which were attributed to the electron binding energies of C-N-C, C-N, and N-H [34]. In the O1 spectra (Figure 3(d)), the two peaks at 532.2 and 534.7 eV were attributed to the electron binding energies of C=O and C-OH [33, 35]. Thus, the XPS results confirmed that the synthesized CQDs contained a large number of hydrophilic groups, which enhanced the hydrogen-bonding interaction between carbon dots and hydrogels.

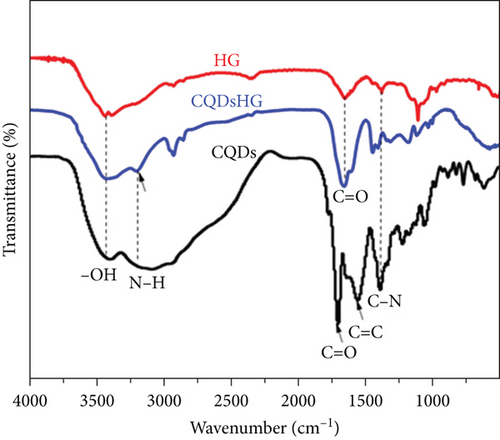
FTIR spectrum of the CQDs, HG, and CQDsHG are shown in Figure 4(a), showing characteristic bands of -OH, C=O, C=C, and N-H at 3443 cm-1, 1710 cm-1, 1560 cm-1, and 3209 cm-1, respectively [36–38]. The FTIR and XPS results supported that the CQDs were successfully incorporated into the HG framework.
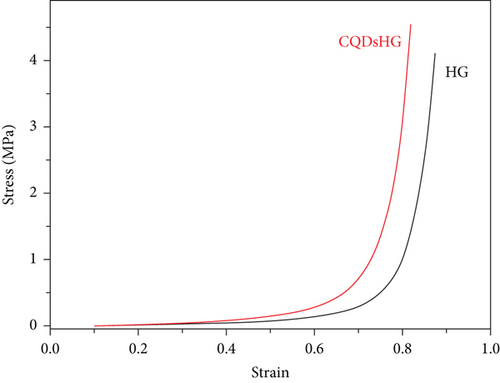
The effect of CQDs addition on the mechanical strength of the hydrogel was examined by a pressure test and the results were shown in Figure 4(b). The hydrogel was compressed by applying pressure using an electronic universal compressor. Approximately 180 kPa and 120 kPa of pressure were required to compress the CQDsHG and HG from 1 to 0.5 cm (50% deformation), respectively. When the pressure was removed, both hydrogels recovered completely, indicating that the CQDsHG and HG exhibited good elasticity. With increasing pressure, the HG produced irreparable cracks at 85% deformation, but the CQDsHG did not. This indicated that the addition of CQDs improved the mechanical strength of the CQDsHG to a certain extent [25].
3.3. Fe3+ Ion Adsorption Experiments
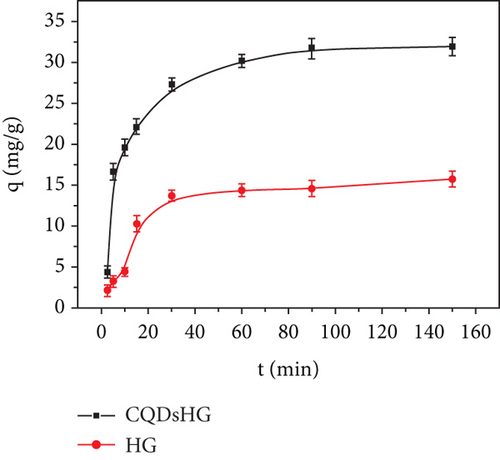
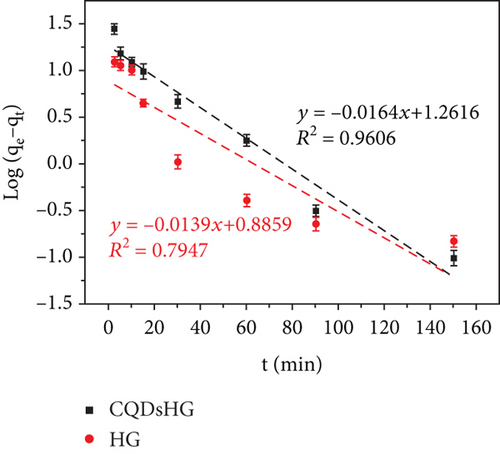
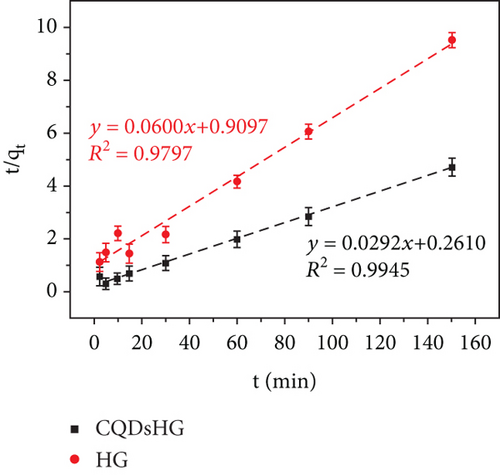
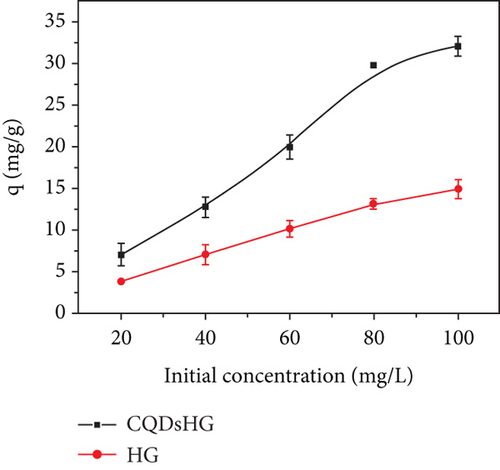
Figure 5(a) shows the Fe3+ adsorption amounts of the HG and CQDsHG. Compared to the HG (15.74 mg/g), CQDsHG had a higher adsorption amount for Fe3+ (31.94 mg/g), indicating that the addition of CQDs had an effect on the adsorption amount of the hydrogel [39]. This was because CQDs addition increased the crosslinking point of the polymer, allowing more functional groups to chelate and absorb Fe3+. Therefore, the hydrogel can provide mechanical and chemical stability to CQDs. Conversely, the introduction of CQDs also improved the structure and performance of the hydrogel to some extent. To better understand the adsorption mechanism of the hydrogel, quasi-first-order kinetics Equation (3) and quasi-second-order kinetics Equation (4) were fitted to the adsorption data, respectively. The fitting results are shown in Figures 5(b) and 5(c), and the calculated parameters are given in Table 1. The results showed that Fe3+ adsorption on the CQDsHG could be modeled using the quasi-second-order kinetic model, and that the adsorption control mechanism of CQDsHG for Fe3+ was chemical adsorption.


| Adsorbents | qe, exp | Quasi-first-order | Quasi-second-order | ||||
|---|---|---|---|---|---|---|---|
| qe (mg/g) | k1 (min-1) | R2 | qe (mg/g) | k2 (g/mg·min-1) | R2 | ||
| CQDsHG | 31.94 | 18.2642 | 0.0378 | 0.9606 | 34.2465 | 0.0009 | 0.9945 |
| HG | 15.74 | 7.6895 | 0.0320 | 0.7947 | 16.6667 | 0.0040 | 0.9797 |
We also investigated the effects of initial Fe3+ concentration on the adsorption amount of the hydrogel (Figure 5(d)). In the solutions with different Fe3+ concentrations, the CQDsHG showed a higher adsorption amount than the HG. The adsorption data were then fitted using the Langmuir isothermal adsorption model (Equation (5)) and the Freundlich isothermal adsorption model (Equation (6)), respectively. According to the determination coefficients (Figures 5(e) and 5(f)), the Freundlich adsorption isotherm model was more suitable for the Fe3+ adsorption isotherm of CQDsHG, indicating that the adsorption of Fe3+ by CQDsHG was limited by multilayer coverage.
3.4. Fluorescent Measurements of the CQDsHG
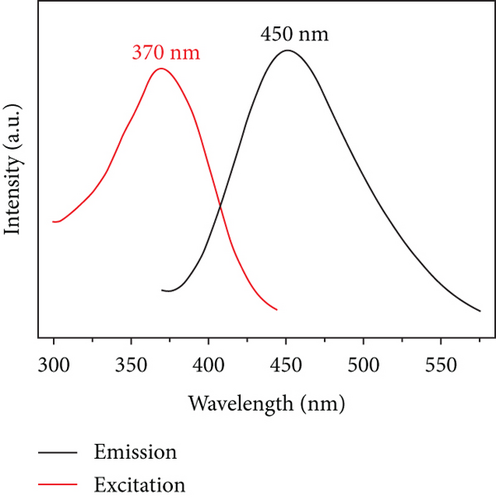
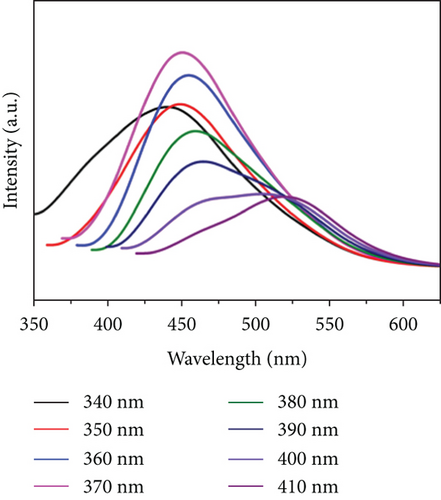
Figure 6(a) displays the optimal excitation and emission trait of the CQDsHG, under 370 nm excitation, where the strongest emission peak appeared at 450 nm. We observed that the emission of the CQDsHG was dependent on the excitation wavelength, which shifted toward the long-wavelength direction with increasing excitation wavelength (Figure 6(b)). This phenomenon is common in fluorescent carbon materials, which is due to the surface state affecting the energy bandgap of CQDs [40, 41].
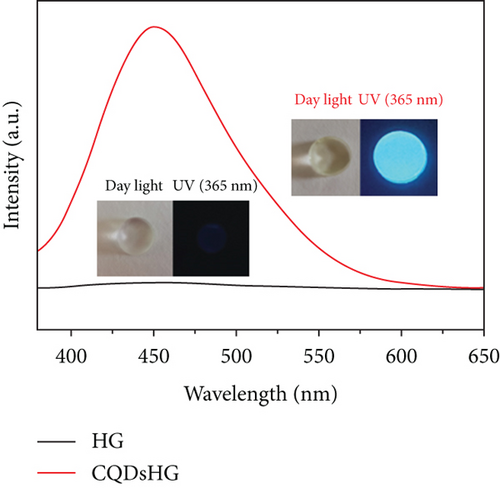
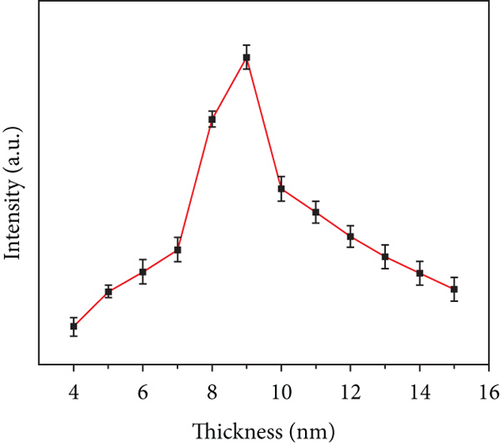
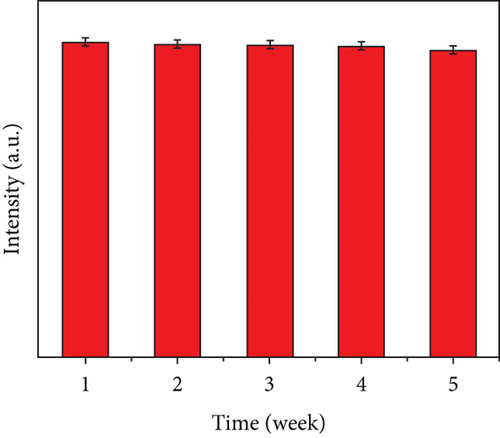
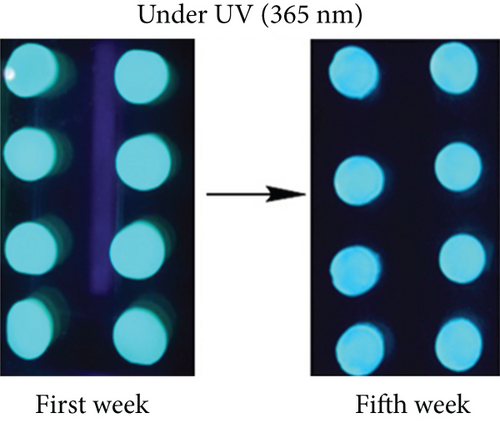
The photographs of the HG and CQDsHG under day light and ultraviolet light (Figure 6(c)) showed that the HG had no obvious fluorescence emission under 370 nm excitation, while the CQDsHG displayed a strong blue emission band centered at 450 nm, indicating that the CQDs exhibited fluorescent behavior even if they were crosslinked into the polymer. The highest fluorescence intensity was obtained when the CQDsHG thickness was 9 mm (Figure 6(d)). The CQDsHG was stored in a sealed dark environment at 4°C, and fluorescence measurements were obtained at one-week intervals, and the results are shown in Figures 6(e) and 6(f). After five weeks, no chalking or cracking of the CQDsHG was observed, and the change of fluorescence intensity was less than 6%, indicating that the CQDsHG has storage stability.
3.5. Fluorescence Detection of Fe3+
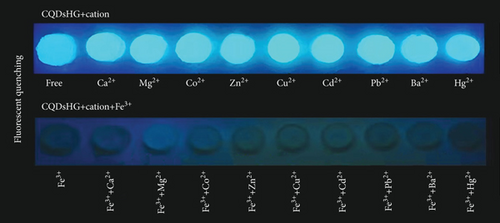
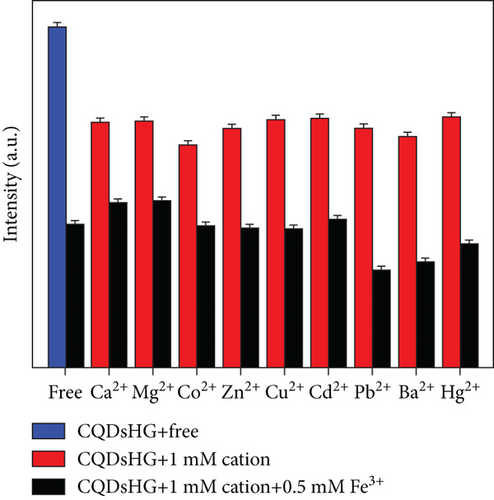
To evaluate the detection performance of the CQDsHG for metal ions, fluorescence quenching experiments were performed in the presence of interfering ions, specifically Ca2+, Mg2+, Co2+, Cu2+, Zn2+, Cd2+, Pb2+, Ba2+, and Hg2+, at 1 mM. Compared to the other metal cations, a remarkable fluorescence quenching for Fe3+ on CQDsHG was observed (Figures 7(a) and 7(b)), suggesting that the CQDsHG could be used as a fluorescence sensor for Fe3+ detection. We also studied the fluorescence intensity of the CQDsHG in a 0.5 mM Fe3+ solution (25 mL) at different times (Figure 7(c)). The fluorescence intensity decreased with prolonged time and stabilized between 15 and 60 min. Therefore, in the following experiments, the detection time of the CQDsHG for Fe3+ is controlled to 15 min.

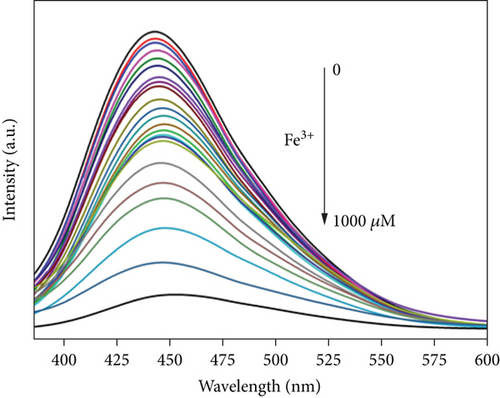
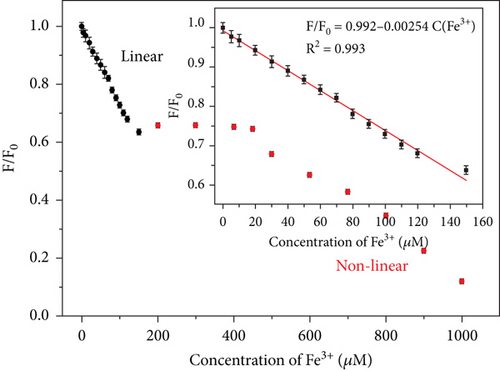
The relationship between the fluorescence intensity of the CQDsHG and Fe3+ concentration (0 to 1000μM) was measured by Fe3+ titration experiments, and the results are shown in Figure 8. The fluorescence intensity steadily decreased with increasing Fe3+ concentration, and fluorescence quenching did not cause an emission peak shift. We also observed a good linear relationship (0–150μM, R2 = 0.993) between the Fe3+ concentration and fluorescence quenching ratio (F/F0) of CQDsHG, where F0 denotes the initial fluorescence intensity of the solution without Fe3+, and F denotes the fluorescence intensity after Fe3+ addition. The limit of detection (LOD) was calculated as 0.24μM, according to the triple standard deviation rule [42]. A comparison of CQDsHG with various published materials is presented in Table 2, showing that CQDsHG had better detection and removal capabilities.
| No. | Probe | QY (%) | Linear range | Detection limit | Adsorption amount (mg/g) | Ref |
|---|---|---|---|---|---|---|
| 1 | CQDs from pear juice | 18.00 | 0–50μM | 2.28μM | —— | [11] |
| 2 | Chitosan hydrogel | —— | 0.12nM | —— | [43] | |
| 3 | PNIPAAm-CQD hydrogel | —— | 1μM–1mM | 0.27μM | 208.25 | [25] |
| 4 | Smart hydrogel with CQDs | 28.00 | 10–100μM | 0.06μM | —— | [23] |
| 5 | Acrylamide hydrogel | —— | 0–50μM | 1.10μM | —— | [44] |
| 6 | Graphene oxide derived from Quercus ilex fruits | 3.03 | 0.1–1μM | 34.50nM | —— | [45] |
| 7 | A pyrene fluorescent probe | —— | 0–200μg/L | 9.00μg/L | —— | [12] |
| 8 | Pyridinyl conjugate of UiO-66-NH2 as chemosensor | —— | —— | 0.19μM | —— | [46] |
| 9 | Bimetallic Ln-MOFs | —— | —— | 4.47μM | —— | [47] |
| 10 | Hydrophilic P(Am-CD-AMPS) microgel | —— | 0–5mM | 3.20μM | 102.13 | [48] |
| 11 | High luminescent Eu3+doped nanoparticle | —— | 10μM–90μM | 63.20nM | —— | [49] |
| 12 | CQDsHG | 93.60 | 0–150μM | 0.24μM | 31.94 | This work |
To further verify the practical applications of the prepared CQDsHG, the Fe3+ contents in tap water and river water were analyzed using the spiked recovery method with CQDsHG as the fluorescence sensor. The detection results were compared with those obtained by a flame atomic absorption spectrometer (FAAS). As shown in Table 3, the recovery rates obtained from fluorescence spectrometry were between 104.60% and 108.84%, which has no significant difference compared to the FAAS method. This showed that the fluorescence sensor could be used for certain practical applications.
| Sample | Spiked amount(μM) | CQDsHG Founda (μM) | Recovery (%) | FAAS Founda(μM) | Recovery (%) |
|---|---|---|---|---|---|
| Tap water | 0 | 7.36 | —— | 6.50 | —— |
| 5 | 12.63 | 105.40 | 11.56 | 101.20 | |
| 50 | 61.78 | 108.84 | 60.38 | 107.76 | |
| Beichuan River water | 0 | 5.46 | —— | 4.13 | —— |
| 5 | 10.69 | 104.60 | 9.22 | 101.80 | |
| 50 | 59.19 | 107.46 | 58.87 | 109.48 |
aAn average response value from three measurements for each sample.
3.6. Fluorescence Quenching Mechanism
In order to explore the quenching mechanism, the average fluorescence lifetime of the CQDsHG without (τ0) and with (τ1) the addition of Fe3+ was also examined (Figure S3), and the results were τ0 = 5.816 ns and τ1 = 5.824 ns. Apparently, the addition of the quencher (Fe3+) did not significantly shorten the fluorescence lifetime of the CQDsHG, which proved that the existence of the static quenching process [15, 51].
In addition, The UV/Vis absorption spectrum of the CQDsHG was also investigated to further confirm the fluorescence quenching mechanism. As shown in Figure S4, when Fe3+ was added to the CQDsHG, the absorption peak of the CQDsHG at 329 nm disappeared. This phenomenon may be due to the combination of Fe3+ and functional groups (amino, hydroxyl, and carboxyl groups) on the surface of the CQDsHG. The difference further proves the mechanism of static quenching [37, 51].
4. Conclusions
In this study, a fluorescent hydrogel nanocomposite with Fe3+ adsorption and sensing capability was fabricated based on CQDs. The easily prepared hydrogel nanocomposite improved the synergistic performance of the CQDs and HG. The CQDs were dispersed and immobilized in the hydrogel through extensive hydrogen bonding, which avoided leakage in water. The hydrogel nanocomposite was stable and exhibited a higher adsorption property and mechanical strength than the HG. Furthermore, the fluorescence intensity of the CQDsHG at an excitation wavelength of 370 nm was significantly quenched upon the addition of Fe3+, and it could be used to quantitatively detect Fe3+ in the range of 0-150 μM, with the detection limit of 0.24 μM. Thus, the satisfactory detection results in real samples demonstrated that the CQDsHG could be used as a bifunctional platform to qualitatively detect and remove trace metal ions.
Conflicts of Interest
The authors declare that they have no conflicts of interest.
Acknowledgments
This research was financially supported by the National Natural Science Foundation of China (No. 21766028) and the Natural Science Foundation of Qinghai (No. 2018-ZJ-912).
Open Research
Data Availability
The data used to support the findings of this study are included within the article, and any further information is available from the corresponding author upon request.


