Study of Thermal Decomposition of the Copolymer Based on Polyethylene Glycol Fumarate with Acrylic Acid
Abstract
Thermal decomposition of the copolymer based on polyethylene glycol fumarate with acrylic acid (p-EGF:AA) at four different heating rates in a nitrogen atmosphere has been investigated by the dynamic thermogravimetry (TGA) method. The TGA curves show that the decomposition process occurs in several stages. The experimental data processed by the Kissinger–Akahira–Sunose and Friedman isoconversion methods made it possible to calculate the activation energy of the main decomposition stage. According to the calculations results, one can see that the values found by these methods do not strongly depend on the conversion. The Achar–Brindley–Sharp method has been applied to determine the compensation parameters. Then, using the compensation effect, the invariant kinetic parameters of the decomposition processes have been found. An experimental curve has been plotted to find the reaction model in comparison with theoretical ones.
1. Introduction
Thermal analysis is one of the most rapidly developing methods for studying physicochemical and chemical transformations in the substance. According to the International Confederation for Thermal Analysis and Calorimetry (ICTAC), thermal analysis methods include a group of measurement methods in which the dependence of the mass, heat flux, and heat capacity of the test substance on temperature under programmed heating conditions is established. Thermal analysis methods have found the most widespread use in scientific research, and interest in them is steadily growing, due to the speed of obtaining information [1–3].
Thermal analysis is also widely used in the study of high molecular weight compounds and is an extremely valuable tool in the study of their thermal stability [4–6]. Unsaturated polyester resins are among poorly studied ones and have practical interest as objects of research. Solutions of unsaturated polyester resins in monomers have an increased viscosity, and the presence of unsaturated maleate or fumarate groups makes them capable of entering into copolymerization reactions with vinyl monomers. For the first time, the interaction reactions of unsaturated polyester resins with vinyl monomers were called copolymerization reactions by Boenig [7]. At the same time, prior to our studies [8–10], there was no information on the copolymerization of unsaturated polyester resins with hydrophilic monomers, which were tested as moisture sorbents and matrix-bases for creating metal-polymer complexes.
The literature contains data on the study of the thermal stability of copolymers of unsaturated polyester resins with hydrophobic monomers in a wide temperature range [11]. The results of thermogravimetric analysis have shown that these copolymers are thermally stable up to 250–300°С, after which thermal degradation occurs, which proceeds in several stages [12].
We have previously investigated the thermal decomposition of some copolymers of unsaturated polyester resins with ionic monomers, in which the influence of copolymers composition on their thermal stability has been shown. The basic kinetic parameters of thermal degradation of copolymers have been found using integral and differential methods [13–15]. Although, as noted in [16], there is no unified approach to determine the kinetic triplet, the use of different methods and their comparison allows to obtain a mathematical explanation describing the complex reactions during thermal decomposition of solids.
In this work, for the first time, studies on the thermal degradation of copolymers of polyethylene glycol fumarate with acrylic acid have been carried out in an inert medium at different heating rates with a description of the reaction model.
2. Experimental Part
2.1. Synthesis of Copolymer
Polyethylene glycol fumarate (p-EGF) was obtained by the polycondensation reaction of fumaric acid with ethylene glycol in a stream of nitrogen with heating and stirring [17]. Copolymerization of unsaturated polyester resin with acrylic acid was carried out in the presence of a radical copolymerization initiator, namely, benzoyl peroxide. Copolymers were obtained in bulk at a temperature of 293 K [18]. The synthesized copolymers were washed with dioxane to purify them from the residues of the unreacted monomer mixture with further filtration, and then, the polymers were dried in a vacuum oven at a temperature of 313 K until a constant weight was established.
2.2. Thermal Analysis
Investigation of thermal properties of the p-EGF:AA copolymer was carried out on a device for synchronous thermal analysis Labsys Evolution TG/DTA from Setaram in a dynamic mode in the temperature range of 30–600°C. The samples were heated in an Al2O3 crucible at a rate of 2.5, 5, 10, and 20°C/min in a nitrogen atmosphere at a flow rate of 30 mL/min. The instrument for thermogravimetric studies and heat flux were calibrated using CaCO3 and in standards, respectively.
2.3. Kinetic Analysis
Integral and differential methods were used to obtain the activation energy (Eα).
2.3.1. The Kissinger–Akahira–Sunose Method
The activation energy can be obtained from the dependence graph from 1/Тα, for given value of the conversion degree α, where the slope is equal to Ea/R.
2.3.2. The Friedman Method
For each given α, the value of Еa is determined by the slope of the graph ln[βi(dα/dT)α,i] from 1/Tα,i. Index i is introduced to indicate the different temperature programs. Tα,i is the temperature at which the conversion degree α is achieved in the ith temperature program.
2.3.3. Model Fitting Method and IKP Method
| Reaction model | Code | f(α) | g(α) | |
|---|---|---|---|---|
| 1 | Power law | P4 | 4α3/4 | α1/4 |
| 2 | Power law | P3 | 3α2/3 | α1/3 |
| 3 | Power law | P2 | 2α1/2 | α1/2 |
| 4 | Power law | P2/3 | 2/3α−1/2 | α3/2 |
| 5 | One-dimensional diffusion | D1 | 1/2α−1 | α2 |
| 6 | Mampel (first order) | F1 | 1−α | −ln(1 − α) |
| 7 | Avrami–Erofeev | A4 | 4(1 − α)[−ln(1 − α)]3/4 | [−ln(1 − α)]1/4 |
| 8 | Avrami–Erofeev | A3 | 3(1 − α)[−ln(1 − α)]2/3 | [−ln(1 − α)]1/3 |
| 9 | Avrami–Erofeev | A2 | 2(1 − α)[−ln(1 − α)]1/2 | [−ln(1 − α)]1/2 |
| 10 | Three-dimensional diffusion | D3 | 3/2(1 − α)2/3[1−(1 − α)]1/3]−1 | [1−(1 − α)]1/3]2 |
| 11 | Contracting sphere | R3 | 3(1 − α) | 1−(1 − α)1/3 |
| 12 | Contracting cylinder | R2 | 2(1 − α) | 1−(1 − α)1/2 |
| 13 | Two-dimensional diffusion | D2 | [−ln(1 − α)]−1 | (1−α) ln(1 − α) + α |
3. Results and Discussion
3.1. Thermogravimetric Analysis
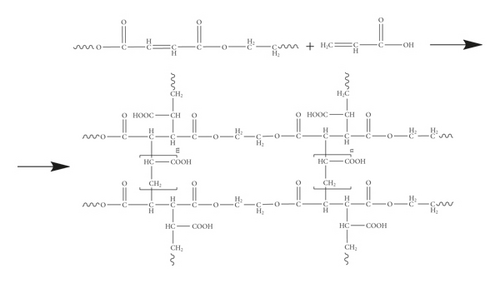
Previously, we synthesized copolymers with high moisture-absorbing properties at various compositions of the initial mixture by the radical copolymerization reaction of unsaturated polyester resins [18]. It has been shown that copolymerization proceeds according to the following scheme (Scheme 1).
The object of the study in this work is the p-EGF:AA copolymer of the composition 44.05 : 55.95 mol%. Thermogravimetric analysis was carried out under dynamic conditions at four different heating rates. Figure 1(a) shows the dependence of the sample mass on temperature at all analyzed heating rates, and Figure 1(b) shows the curves of the decomposition rate of the copolymer.
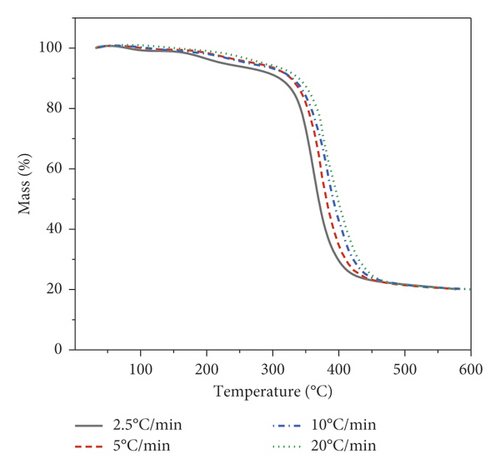
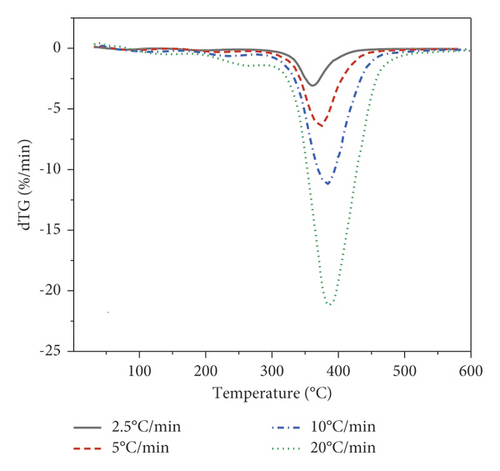
Figure 1 shows that at the initial stage, the sample masses undergo insignificant changes associated with the release of moisture in the copolymer. The decomposition process begins at a temperature of 150°С, followed by a gradual decrease in the mass of the samples with the release of volatile substances. The third stage of decomposition begins at a temperature of 261°C and ends at 434°C, at the lowest heating rate (Figure 1(a)). When the heating rate was 20°C/min, the initial and final decomposition temperatures shifted to 296 and 464°C, respectively. The same tendency is observed on the DTG curve (Figure 1(b)). The DTG curve has a maximum decomposition rate and a shift to a higher temperature range at the maximum heating rate. The weight of the residue at the end was approximately 19–20% of the total weight of the sample. Table 2 provides the temperatures of the beginning, peak, and end of the third stage of decomposition.
| β (°С/min) | Тinitial (°С) | Тpeak (°С) | Тfinal (°С) |
|---|---|---|---|
| 2.5 | 261 | 361 | 434 |
| 5 | 275 | 372 | 452 |
| 10 | 279 | 383 | 460 |
| 20 | 296 | 387 | 464 |
3.2. Kinetic Analysis
The data from Table 2 have been used to plot dependencies of the conversion degree on the temperature, as shown in Figure 2.
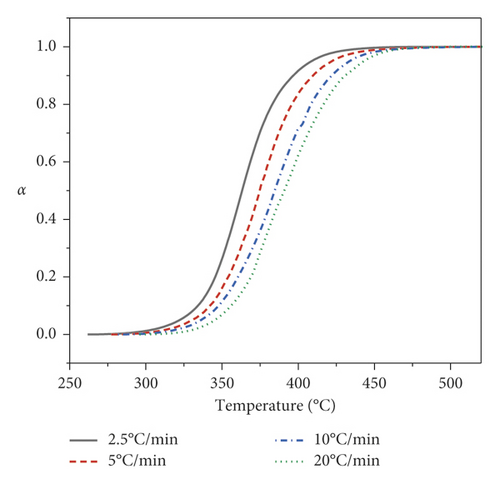
As shown in Figure 2, the curves shapes of the conversion degrees for all heating rates have a sigmoidal shape. The decomposition reaction with increasing temperature gradually accelerates and becomes more intense, followed by a slowdown. Also, it is possible to observe a shift of the curves by 10–15°C to the high temperatures region with an increase in the heating rate. The parameters dependences of the Kissinger–Akahira–Sunose and Friedman equations at various conversion degrees shown in Figures 3(a) and 3(b) were used to determine the kinetic parameters using the isoconversional principle.
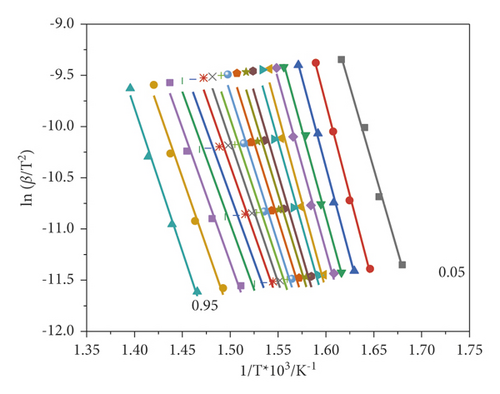

As can be seen from the graphs, the points obtained by the Friedman differential method have a greater scatter (Figure 3(b)) than in the Kissinger–Akahira–Sunose (KAS) method, and as a consequence, the latter are more parallel to each other. The choice of these methods is due to the possibility of comparing the activation energy obtained by integral and differential methods, which allow assessing the validity of the assumptions made when deriving these equations. Figure 4 shows a graphical dependence of the activation energy on the conversion degree.
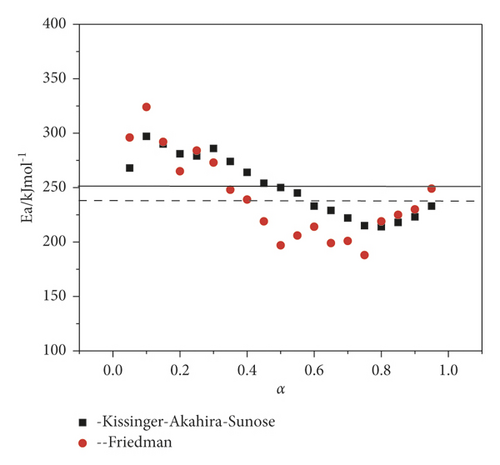
At the initial stage of decomposition, the activation energies found by two methods slightly increase and then tend to decrease. At a value of α > 0.3, the activation energy begins to decrease sharply and reaches a minimum at α = 0.75, with a subsequent increase until the completion of the thermal decomposition reaction. The dependence of the conversion degree on the activation energy is most informatively given in Table 3.
| α | Kissinger–Akahira–Sunose | Friedman | ||
|---|---|---|---|---|
| E, kJ/mol | R2 | E, kJ/mol | R2 | |
| 0.5 | 268 ± 17 | 0.9913 | 296 ± 15 | 0.9948 |
| 0.1 | 297 ± 20 | 0.9976 | 324 ± 17 | 0.9944 |
| 0.15 | 290 ± 10 | 0.9976 | 292 ± 9 | 0.9982 |
| 0.2 | 281 ± 13 | 0.9956 | 265 ± 13 | 0.9952 |
| 0.25 | 279 ± 16 | 0.9934 | 284 ± 45 | 0.9512 |
| 0.3 | 286 ± 29 | 0.9796 | 273 ± 63 | 0.9032 |
| 0.35 | 274 ± 33 | 0.9720 | 248 ± 53 | 0.9158 |
| 0.4 | 264 ± 36 | 0.9642 | 239 ± 48 | 0.9242 |
| 0.45 | 254 ± 34 | 0.9660 | 219 ± 34 | 0.9546 |
| 0.5 | 250 ± 27 | 0.9764 | 197 ± 19 | 0.9808 |
| 0.55 | 245 ± 22 | 0.9838 | 209 ± 28 | 0.9660 |
| 0.6 | 233 ± 30 | 0.9687 | 214 ± 26 | 0.9714 |
| 0.65 | 229 ± 21 | 0.9838 | 199 ± 17 | 0.9853 |
| 0.7 | 222 ± 20 | 0.9841 | 201 ± 15 | 0.9890 |
| 0.75 | 215 ± 20 | 0.9825 | 188 ± 40 | 0.9123 |
| 0.8 | 214 ± 18 | 0.9860 | 219 ± 12 | 0.9940 |
| 0.85 | 218 ± 18 | 0.9863 | 225 ± 18 | 0.9878 |
| 0.9 | 223 ± 18 | 0.9864 | 230 ± 15 | 0.9915 |
| 0.95 | 233 ± 13 | 0.9939 | 249 ± 26 | 0.9779 |
| Mean | 251 ± 21 | 0.9836 | 241 ± 27 | 0.9681 |
Table 3 provides that degrees of correlation for both methods have the highest values at the beginning of the thermal decomposition reaction. Values with low correlation values are observed at conversions of α = 0.3–0.45. Thus, the Kissinger–Akahira–Sunose and Friedman methods made it possible to estimate the activation energy throughout the entire process without the preliminary use of reaction models.
In continuation of the work, the Achar–Brindley–Sharp method and the method of invariant kinetic parameters were applied in order to determine the preexponential factor and the reaction model. It was stated in [24] that the ABS method was more accurate for calculating the kinetic parameters required to estimate the compensation parameters. Using equation (6), thirteen values of Ea and lnA (Figure 5) corresponding to the reaction models from Table 1 were obtained.
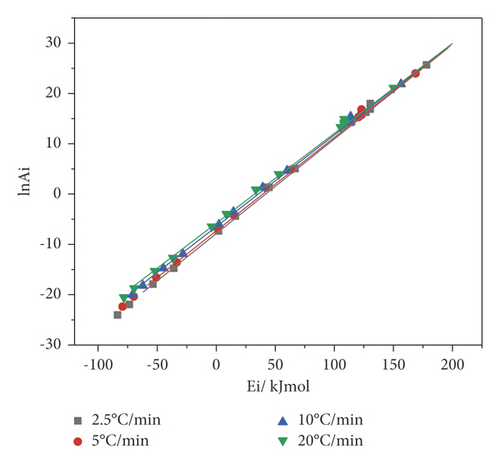
Figure 5 shows that the straight lines for all four heating rates lie very close and have a good correlation. The compensation parameters obtained by the Achar–Brindley–Sharp method are given in Table 4.
| β (°С/min) | a∗ | b∗ | R2 |
|---|---|---|---|
| 2.5 | 0.1979 | −5.8526 | 0.9989 |
| 5 | 0.1956 | −5.3131 | 0.9994 |
| 10 | 0.1922 | −4.6068 | 0.9994 |
| 20 | 0.1887 | −3.8044 | 0.9994 |
Figure 6 shows a graph of a∗ vs. b∗ dependence.
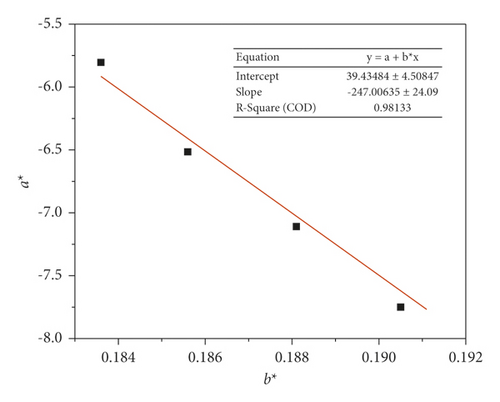
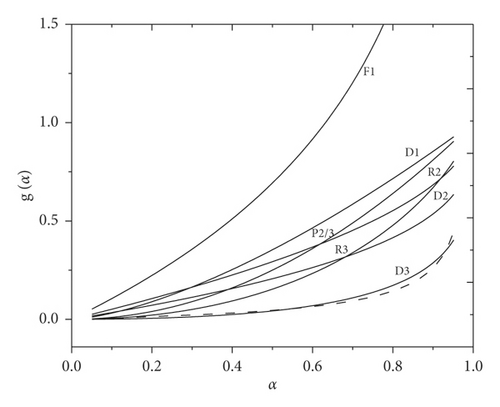
The invariant kinetic parameters of the copolymer decomposition were found from the slope and intersection of the graph, namely, Ea = 247 kJ/mol and lnA = 39. The activation energy is in good agreement with the values obtained using isoconversion methods. Equation (9) was used to obtain a set of numerical values g(α) for various conversion rates. The dependence graph of the reaction model on the conversion degree has a profile reminiscent of an accelerating reaction (F1, D1, and R3). Therefore, the calculated data were compared to the previously selected theoretical graphs g(α).
As shown in Figure 7, a good conformity was found for the D3 model.
4. Conclusion
A more in-depth study of the thermal decomposition of the copolymer based on polyethylene glycol fumarate with acrylic acid was carried out in this work. Analysis of TG and DTG curves showed sufficient thermal stability of those copolymers in a nitrogen atmosphere. The decomposition took place in two stages. The temperature range of the main stage was about 260–460°С.
The kinetic parameters of the decomposition reaction, which have good convergence, have been calculated using the Friedman and Kissinger–Akahira–Sunose isoconversion methods. It should be noted that the obtained data on the activation energy have close values at different heating rates. Using a combination of different methods, a kinetic triplet corresponding to Ea ≈ 250 kJ/mol, A ≈ 8.66∙1016 min−1, and g(α) = [1 − (1 − α)]1/3]2 was obtained. The dependences of g(α) on α using these parameters showed satisfactory agreement between the calculated and experimental curves. Thus, it can be said that the decomposition process of the p-EGF:AA copolymer is well described by the D3 model (three-dimensional diffusion).
Conflicts of Interest
The authors declare that they have no conflicts of interest.
Acknowledgments
This research was funded by the Science Committee of the Ministry of Education and Science of the Republic of Kazakhstan (Grant No. BR10965249).
Open Research
Data Availability
The data used to support the findings of this study are available from the corresponding author upon request.


