[Retracted] Differential Scanning Calorimetry Material Studies: Benzil Melting Point Method for Eliminating the Thermal History of DSC
Abstract
How to eliminate the thermal history present in differential scanning calorimetry, this question has been widely concerned. Benzil has a serious thermal history that is not well eliminated by conventional thermal history methods. Herein, using benzil as a target, we developed a freeze-gradient temperature rate heating up method to eliminate the thermal history of DSC. Compared with the conventional method, this method avoids the introduction of new thermal histories by new crystalline forms that may appear during the cooling crystallization process. The results show that the peak shape of the melting peak is sharper and the peak emergence position is closer to the theoretical melting point after the elimination of the thermal history by the freeze-gradient heating up method. Based on this method, we optimized other factors to establish a complete method for the determination of melting point by DSC, analyzed the uncertainty of the method, and obtained an extended uncertainty of 0.19°C for DSC in this method. The validation results show that the p-nitrotoluene of the melting point reference substance was 52.64°C, which is within its reference value of (52.53 ± 0.20) °C, showing that this method is reliable. This study provides a reference for other thermal analysis methods to eliminate thermal history.
1. Introduction
Differential scanning calorimetry (DSC), as a representative of modern thermal analysis methods, can accurately and quickly analyze the thermodynamic properties of samples, because of simple operations such as without the need to add internal or external standard substances. The DSC has been widely used in a diverse of different fields, such as environmental analysis [1, 2], drug purity determination [3], and rapid determination of melting point [4]. Among these applications, the accuracy of the melting point of samples is receiving growing attention from DSC. However, some samples show some malformed peaks during the determination process of DSC. The presence of malformed peaks interferes with the determination of melting point and purity. For example, Jalali et al. found malformed peaks caused by thermal history when studying the nucleation and crystallization of poly-lactic acid (PLA). Thermal history refers to the fact that during the production and processing of the sample, due to the difference in the molecular crystal form within the sample, some malformed peaks may appear in the DSC measurement curve, which affects the determination of the melting point. Because these malformed peaks may interfere with the selection of normal melt peaks, some studies suggest that the malformed peaks arise because of the presence of disordered crystalline patterns within the molecule [5]. It has been shown that some samples such as PLA exhibit two different crystalline phases, one is the ordered form and the other is the disordered form. Several studies confirm this conclusion, by means of FTIR and WAXD analysis [6]. The presence of a disordered form in the crystalline phase can induce thermal history occurrence. Due to the presence of these peaks, the uncertainty of DSC is not easily assessed systematically.
The uncertainty of the DSC is systematically evaluated by eliminating the thermal history of the DSC. For the elimination of thermal history, the heating and cooling method for the sample was used [5–9], and keeping the melting point temperature at a constant temperature is usually adopted. Multiple heating eliminates thermal history by first heating the sample to a predetermined temperature and then cooling it at a constant rate. Several studies have shown that the results of eliminating thermal history differ for different cooling rates [5]. When cooling rates are low, thermal history was eliminated. Decreasing the cooling rate led to an increase in the nuclei density, and this operation can make the crystal phase arrangement more orderly [9]. Due to the slow cooling rate, the molecules have enough time to move and adjust during crystallization to form an ordered arrangement [10–12], thereby eliminating thermal history in the sample [13–16]. It is also formed by the movement of intramolecular crystals to form an orderly arrangement. However, there are some problems with these two methods. For example, the analysis takes a long time [17, 18], and the thermal history of the sample cannot be completely eliminated in many cases [19–22]. Therefore, the development of a new method for the elimination of thermal history is highly desirable.
Benzil is a commonly used and important intermediate in organic synthesis and can be used in the preparation of many valuable organic intermediates [23, 24]. The benzil is particularly important in organic synthesis. Also, it was shown that the benzil’s enthalpy of fusion is important in the determination of gas-phase ion energetics [25]. For the determination of the purity of benzil, the commonly used methods are gas chromatography [26], liquid chromatography [27], and DSC [28]. During the use of benzil, the thermodynamic properties of benzil need to be characterized with the help of DSC. The melting point of benzil was used as a calibration for thermodynamic instruments [29]. Some studies have found that benzil has a serious thermal history phenomenon when using DSC to measure the thermodynamic parameters of benzil [26]. The reasons for the appearance of benzil’s thermal history and the method of elimination are similar to PLA, because they all have the presence of disordered crystalline patterns within the molecules. But this method also does not eliminate benzil’s thermal history very well.
In this study, we design a method of freeze-gradient heating up gradient heating to eliminate the thermal history of DSC, and we systematically analyzed the uncertainty of DSC. This study used the melting point reference substance p-nitrotoluene for comparison experiments to verify the accuracy of the method. An accurate determination method for measuring benzil melting point is established, which can provide a promising reference for improving the melting point determination level of organic high-purity substances.
2. Experiments
2.1. Materials and Instruments
Benzil was purchased from Acros Organics (USA). Indium and p-nitrotoluene were purchased from the National Institute of Metrology (Beijing, China).
A differential scanning calorimeter (DSC 8000, Perkin Elmer, USA) was used to determine the melting point of the sample. 20 μL crucible (Perkin Elmer, USA) was used to hold the sample. XP205 electronic balance (Mettler Toledo, Switzerland) was used to weigh the samples. KZY-1 tablet press (Shanghai Kaizheng Instrument Co., Ltd.) was used to seal aluminum pans. MERLIN compact field emission scanning electron microscope (Zeiss, Germany) was used for the characterization of sample surface morphology.
2.2. DSC Measurement
According to the relevant provisions of ISO 11357-3-2018, the DSC measurement method is set as follows: the benzil (5.0 mg) and indium (5.0 mg) were accurately weighed. The samples were put in a crucible and were used pressed. The furnace body of DSC was cleaned. The prepared samples were put into the DSC sample dish, and the same empty crucible was put into the DSC reference dish. The prepared indium sample was put into the DSC sample pan to be tested. The temperature was raised to 180°C at 10°C·min−1. The melting curve of indium was measured, and the DSC completed the calibration. After completing the calibration and cooling to 25°C, the benzil samples were placed in DSC sample dishes. The furnace was purged with high-purity N2 at a flow rate of 20 mL/min. The temperature was rapidly heated up to 20°C below the melting point and held for 2 min. Then, the temperature was heated at 1.0°C·min−1 to exceed the melting point. The melting point was automatically calibrated by Perkin Elmer’s software.
2.3. Effects of Different Experimental Conditions
2.3.1. The Influence of Thermal History Elimination
Four benzil samples of different masses including 1.0 mg, 2.0 mg, 3.0 mg, and 4.0 mg were used.
(1) Elimination of Thermal History by Constant Temperature near Melting Point. The temperature was kept at a constant temperature near the melting point for 5 min, cooled down to 60°C at the same rate, and then ramped up to above the melting point at 1.0°C·min−1. Other conditions are the same as the method mentioned in Section 2.2.
(2) Elimination of Thermal History by Repetitive Heating Up. The method in Section 2.2 was used. After heating above the melting point, the temperature was cooled to 25°C at the same rate. We repeated this process 3 times.
(3) Elimination of Thermal History by Freeze-Constant Temperature Rate Heating Up. The temperature was maintained at −40°C for 2 min, ramped up to above the melting point at 1.0°C·min−1, and the other operations were the same as in the methods mentioned in Section 2.2.
(4) Elimination of Thermal History by Freeze-Gradient Temperature Rate Heating Up. The temperature was maintained at −40°C for 2 min, ramped up to 60°C at 2.0°C·min−1 and ramped up to above the melting point at 1.0°C·min−1, and the other operations were the same as in the methods mentioned in Section 2.2.
2.3.2. The Influence of Sample Mass and Heating Rates
Four benzil samples of different masses including 1.0 mg, 2.0 mg, 5.0 mg, 7.5 mg, 10.0 mg, and 12.5 mg were used. The heating rates were set to 0.5°C·min−1, 1.0°C·min−1, 2.0°C·min−1, 5.0°C·min−1, 10.0°C·min−1, and 20.0°C·min−1, respectively. According to the optimized method in Section 2.3, the influences of different mass factors on the melting point were explored.
2.4. Experimental Method Verification
In this study, p-nitrotoluene was used to verify the experimental method on the optimized experimental method. The sample mass is 5.0 mg; other operations are similar to the methods in Section 2.2. According to the optimized experimental method, the method of eliminating the thermal history in Section 2.3.2 was used.
3. Results and Discussion
3.1. Thermal History Factor Optimization
3.1.1. Determination of Non-Eliminated Thermal History Samples
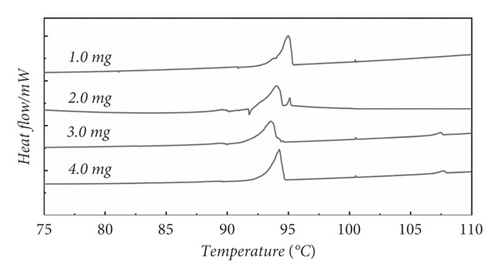
For most organic compounds, there was no processing before performing DSC experiments. The severe thermal history phenomenon was shown in the DSC curve. Figure 1 presents the DSC measurement curves of benzil without any treatment at four different masses. Figure 1 shows that the thermal history phenomenon occurred when the mass was 1.0 mg, 2.0 mg, 3.0 mg, and 4.0 mg, due to the presence of disordered crystalline patterns within the molecule when the mass was 1.0 mg, 2.0 mg, and 3.0 mg. The presence of disordered crystalline forms led to a thermal history during DSC testing of benzil. The DSC curve exhibited malformed peaks. The malformed peaks disappeared when the mass was 4.0 mg. Due to the fact that when the mass increases, the sample arrangement inside the pan becomes more compact, the proportion of disordered crystalline forms decreases, and the proportion of ordered crystalline forms increases. However, a peak occurred at 107°C. This may be due to the mixing of the two crystal phases, which caused a thermal history phenomenon. To eliminate the thermal history phenomenon, it is necessary to eliminate the disordered crystal phases in the molecule. Therefore, in order to accurately determine the melting point of benzil, it is important to eliminate the thermal history.
3.1.2. Elimination of Thermal History by Constant Temperature near Melting Point
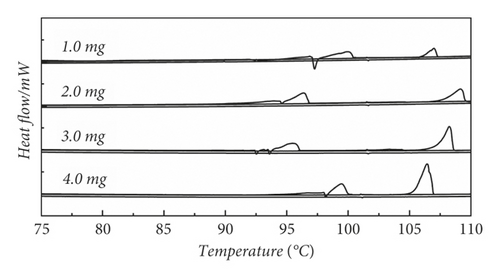
We designed the method of constant temperature near the melting point to eliminate the thermal history. Figure 2(a) presents the method of constant temperature mode near melting point to the elimination of thermal history at 1.0 mg, 2.0 mg 3.0 mg, and 4.0 mg, respectively. The peak that appears at 95°C undergoes a significant distortion. This is due to the fact that it is the first temperature rise and the distorted peak exhibited by not eliminating the thermal history [30], and the peak appearing at 105°C is the melting peak formed after the method of eliminating the thermal history by using the melting point thermostat method. It can be seen that at this time, the peak shape is significantly optimized compared to the first time, but the melting range grows significantly. This is due to the fact that after the first temperature rises to reach the melting point, the melting undergoes a phase change, and the ordered and disordered crystalline shapes within the molecule disappear. Then, due to the presence of a cooling crystallization process, new crystalline forms are formed again during this process, which makes the melting range grow [31]. Therefore, this method is not suitable for thermal history elimination.
3.1.3. Elimination of Thermal History by Repetitive Heating Up
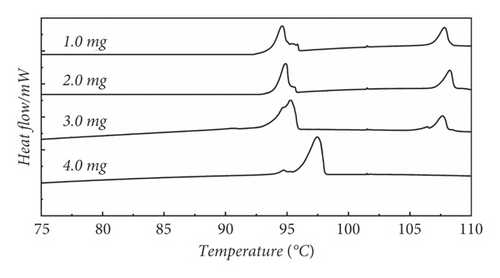
We designed another method of repetitive heating sample to eliminate the thermal history, because the abovementioned method not only did not eliminate the original thermal history but also introduced a new one. Figure 2(b) presents the method of repetitive heating to the elimination of thermal history at 1.0 mg, 2.0 mg 3.0 mg, and 4.0 mg, respectively. The malformed peaks occurred at 95°C at four masses. This is due to the fact that the repeated heating did not make the intramolecular crystalline arrangement neat, and there are still disordered crystalline shapes in the molecule, so the melting peak is preceded by a spurious peak. The appearance of the spurious peak at 105°C is probably due to the presence of a cooling crystallization process, new crystalline forms are formed again during this process [32]. The presence of the new crystalline form makes the DSC curve show the stray peak at 105°C. Therefore, repeated heating also does not eliminate the thermal history well.
3.1.4. Elimination of Thermal History by Freeze-Constant Temperature Rate Heating Up
The malformed peaks on the DSC curve are due to the disordered crystalline shapes. Therefore, to eliminate the thermal history, the disordered crystalline shape within the molecule has to be eliminated first. The key to the first two methods is to give the crystals within the molecule time to move and arrange themselves into a neat crystalline pattern. However, since there is a phase change, other crystalline patterns may appear when crystallizing again [33]. In order to allow enough time for the crystals within the molecule to align and not crystallize again, we devised a method to extend the heating range.
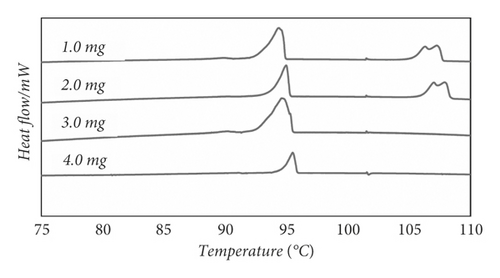
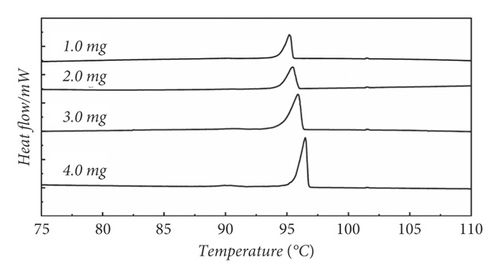
(Figure 2(c) presents the method of freeze-constant heating up to the elimination of thermal history at 1.0 mg, 2.0 mg 3.0 mg, and 4.0 mg, respectively. Compared with the two previous methods, the peak shape of the melting peak is significantly improved. The peak shape becomes sharper and the position of the peak emerges closer to the theoretical melting point. This is due to the longer melting range, which gives enough time for the molecules to arrange into neat crystalline shapes internally. Also, due to the absence of a cooling crystallization process, no spurious peaks appeared around 105°C for masses of 3.0 mg and 4.0 mg. But, when the mass is 1.0 mg and 2.0 mg, there are heterogeneous peaks. This is due to the presence of an inhomogeneous thermal field in the crucible with large sample voids when the mass is less, which makes some of the samples’ crystalline transformation slower. When the mass increases, the sample inside the crucible is packed compactly, which makes the heat transfer inside more uniform than that of 1.0 mg and 2.0 mg. Therefore, when the mass is increased, the crystalline shape is neatly arranged and the elimination of thermal history is better than in the first two. This method can better solve the elimination of thermal history when the mass is large. But, sometimes this method is problematic when the mass of the sample to be measured is small.
3.1.5. Elimination of Thermal History by Freeze-Gradient Temperature Rate Heating Up
Because the method of constant temperature heating does not solve the thermal history well when the masses are small, based on Section 3.1.4, we designed the method of freeze-gradient heating up gradient heating to eliminate the thermal history.
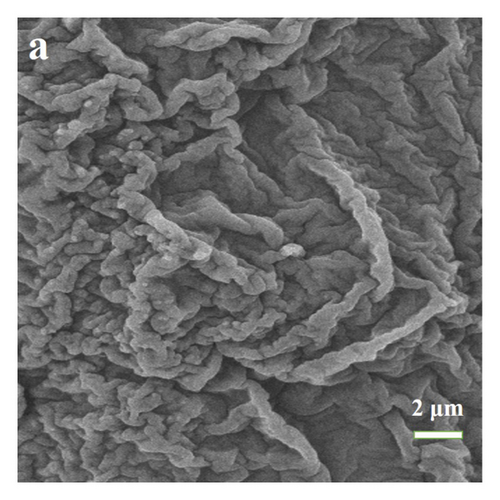
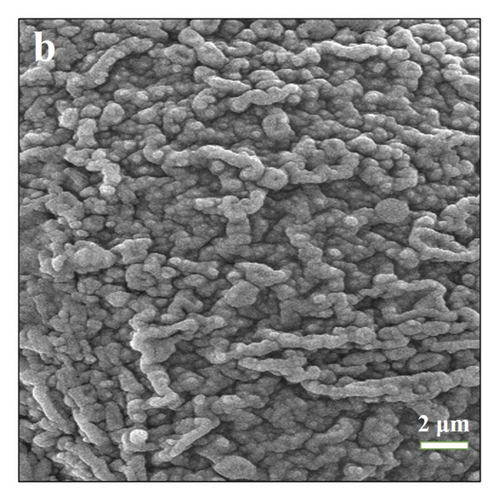
Figure 2(d) presents the method of freeze-gradient heating to eliminate thermal history at 1.0 mg, 2.0 mg 3.0 mg, and 4.0 mg, respectively. Figure 2(d) shows that using this method, the melting peak has a good peak shape and no spurious peaks appear, indicating that the thermal history is well eliminated. Because of the appropriately increased heating rate in the first section, the heat transfer inside the crucible is enhanced. When the mass is very small, there is a stronger thermal field making the intramolecular crystalline shape move. The thermal history of smaller masses at constant temperature can be well solved. Increasing the rate appropriately makes the test time decrease. To explain this approach, we performed scanning electron microscopy analysis on the samples. Figure 3(a) shows that untreated benzil samples were heated to 60°C. Figure 3(b) shows that benzil samples were heated to 60°C using a cooling gradient. The results clearly show that the untreated benzil sample heated to 60°C has a more chaotic arrangement inside the microperspective. This is because due to the high initial temperature, the molecule is not evenly aligned before they reach the melting temperature and start melting. In the beginning, due to the disorderly arrangement, this makes the temperature gradient still exist inside the crystal when the temperature is continued to increase, the temperature field inside the crystal is still not uniform, and the starting temperature of the crystal is different when melting. When the melting point is reached, it still shows the presence of thermal history. On the contrary, in the cooling-warming mode, there is enough time for a uniform arrangement within the molecules due to the different heating rates. Due to the internal alignment pattern, the samples are in a uniform temperature field, so the samples start at different temperatures during melting. Then, the thermal history can be effectively eliminated during melting. Therefore, the freezing gradient temperature rise method is used to eliminate the thermal history.
3.2. Optimization of Quality Factor and Heating Rate Factor
When the DSC was used, the quality of the sample and the heating rate are important factors that affect the results of melting point determination [34]. In order to further optimize the condition of the heating rate to eliminate the thermal history, and to explore the influence of the mass and the heating rate factors on the melting point determination, we designed an orthogonal experiment on the basis of optimized historical conditions. The experimental results are shown in Table 1. Table 1 shows the results of melting point determination for different masses of benzil samples at different heating rates. In order to visualize the changing trend more, we added the data in Table 1 into Figure 4.
| Quality (mg) | Heating rates (°C·min−1) | |||||
|---|---|---|---|---|---|---|
| 0.5 | 1.0 | 2.0 | 5.0 | 10.0 | 20.0 | |
| 1.0 | 95.04 | 95.43 | 95.89 | 96.13 | 96.77 | 96.93 |
| 2.0 | 95.43 | 95.55 | 96.17 | 96.32 | 96.58 | 97.51 |
| 5.0 | 94.44 | 94.57 | 95.31 | 95.79 | 96.26 | 98.55 |
| 7.5 | 95.53 | 95.72 | 95.84 | 95.94 | 96.07 | 98.55 |
| 10.0 | 95.26 | 95.51 | 96.55 | 97.90 | 98.18 | 100.27 |
| 12.5 | 96.12 | 96.27 | 97.03 | 97.41 | 98.28 | 101.52 |
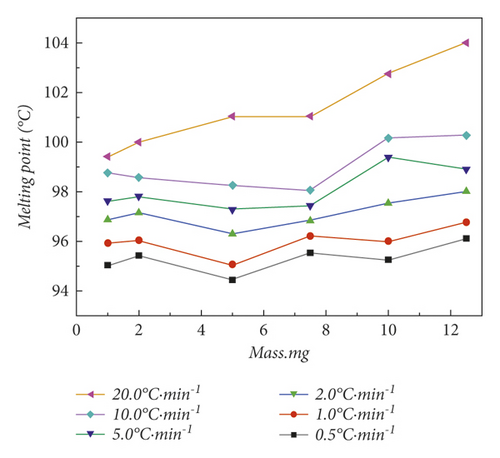
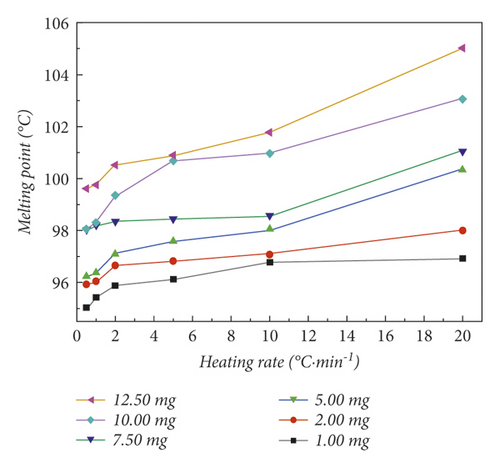
Figure 4(a) shows the results of melting point determination for different masses of samples at the same heating rate. At heating rates of 0.5°C·min−1, 1.0°C·min−1, 2.0°C·min−1, and 5.0°C·min−1, the shortest melting range is measured under the same heating rate and different weighing quantities. Some traditional theories believe that the smaller the mass, the shorter the melting range [12]. But, experiments have shown that when the masses were 1.0 mg and 2.0 mg, the melting range will increase instead. This is because when the sample amount is small, the sample is not uniformly distributed in the crucible. This starts the heat transfer process in an uneven temperature field, resulting in increased heat loss. When the masses are 7.5 mg, 10.0 mg, and 12.5 mg, the melting range will increase instead. Due to the increase of the sample mass, more heat needs to be transferred, so the melting range will also increase. When the heating rate is increased to 10.0°C·min−1 and 20.0°C·min−1, the melting range with a mass of 5.0 mg is not the shortest. This is because when the heating rate increases, the temperature rises too fast, and the temperature field inside the entire furnace body is not uniform, resulting in a longer melting range. Therefore, the most appropriate sample weight is about 5.0 mg.
On the basis of the optimized historical conditions by freeze-constant temperature rate heating up, the heating rate of the second segment was set to 0.5°C·min−1, 1.0°C·min−1, 2.0°C·min−1, 5.0°C/min, 10.0°C·min−1, and 20.0°C·min−1. The heating rate is for exploring the factor of the heating rate and further optimizing the condition of the heating rate to eliminate the thermal history. Figure 4(b) shows the results of melting point determination for different heating rates of samples at the same mass. Comparing the different heating rates at each quality point, it is not difficult to find that when the heating rate increases, the measured melting range of p-nitrotoluene also extends. This is because when the temperature rise rate is too fast, the sample does not have enough time to melt [35]. It will make the melting range increase greatly. To measure the most accurate melting range, we should choose the lowest heating rate. However, when the heating rate is 0.5°C·min−1 and 1.0°C·min−1, the measured melting range is similar, and the time required for the heating rate at 1.0°C·min−1 is shorter than the time required for 0.5°C·min−1. Therefore, 1.0°C·min−1 is the most suitable heating rate.
3.3. Thermal Lag Factor Optimization
3.4. Uncertainty Evaluation
| Category | Parameter | Meaning | Evaluation method | Standard uncertainty/u (°C) | Relative standard uncertainty/urel |
|---|---|---|---|---|---|
| Uncertainty introduced by the calibration process. | u1 | Uncertainty introduced by indium itself. | u1 = U/k | 0.13 | 8.30 × 10⁻⁴ |
| u2 | Uncertainty introduced by repeated measurements of indium. | u2 = In RSD | 0.0011 | 6.64 × 10⁻⁶ | |
| u3 | Uncertainty component introduced by instrument temperature error. | u3 = △Tmax/k | 0.0016 | 9.90 × 10⁻⁶ | |
| Uncertainty introduced by the sample itself. | u4 | Uncertainty introduced by repeated measurements of samples. | u4 = Benzil’s RSD | 0.0027 | 4.45 × 10⁻⁵ |
| u5 | Uncertainty component introduced by sample uniformity. | 0.045 | 2.47 × 10⁻⁴ | ||
| u6 | Uncertainty component introduced by short-term stability. | u6 = s (β1)·t | 0.0028 | 2.53 × 10⁻⁵ | |
| u7 | Uncertainty component introduced by sample mass. | u7 = △Tmax/k | 0.029 | 3.05 × 10⁻⁴ | |
| Uncertainty introduced by experimental conditions. | u8 | Uncertainty component introduced by heating rate. | u8 = △Tmax/k | 0.029 | 3.05 × 10⁻⁴ |
| u9 | Uncertainty component introduced by airflow rate. | u9 = △Tmax/k | 0.0016 | 1.21 × 10⁻⁴ | |
| u10 | Uncertainty component introduced by a thermal lag coefficient. | u10 = τ0’s RSD ∗dT/dt | 0.0027 | 1.21 × 10⁻⁴ | |
| Combination of uncertainties | uDSC,rel | Relative standard uncertainty of DSC. | 9.84 × 10⁻⁴ | ||
| uDSC | Combined standard uncertainty of DSC. | 0.0932 | |||
| U(k = 2) | Expanded uncertainty. | 0.19 | |||
3.5. Validation of Experimental Methods
To verify the accuracy of the method, we used the melting point reference substance p-nitrotoluene for comparison experiments. We conducted 30 experiments for melting point determination. The experimental results showed that the average value of p-nitrotoluene’s melting point was 52.64°C, which was within its reference value of (52.53 ± 0.20) °C. The RSD of the measured results was 0.11%. Therefore, the optimized method can be considered accurate.
4. Conclusions
In this study, we design a new method of freeze-gradient temperature rate heating up to eliminate the thermal history of DSC, using benzil as the study object. In the method of constant temperature near the melting point to eliminate the thermal history, after the first temperature rises to reach the melting point, a phase change occurs by melting and the ordered and disordered crystalline shapes within the molecule disappear. The new crystalline forms are formed in the process due to the presence of the cooling crystallization process. Another method of repeated heating of the sample to eliminate the thermal history has a false peak before the melting peak because the repeated heating did not result in a neat arrangement of crystallites within the molecule, and there are still disordered crystalline forms in the molecule. The artifactual peak at 105°C may be due to the presence of a cooling crystallization process in which a new crystalline form is formed again. This method avoids the introduction of a new thermal history by cooling the crystallization, and this method was able to eliminate the thermal history of benzil well, resulting in a sharper melt peak shape and no other spurious peaks appeared. Based on this method, we optimized other factors to establish a complete method for the determination of melting point by DSC and analyzed the uncertainty of the method. The result shows the extended uncertainty U (k = 2) of DSC at 0.19°C. The p-nitrotoluene was used to validate this method and the melting point value of p-nitrotoluene was within the reference range, indicating that this method is feasible. The method provides a reference for DSC to develop melting point standards for the accurate determination of the melting points of substances.
Conflicts of Interest
The authors declare that they have no conflicts of interest.
Open Research
Data Availability
The datasets used and/or analyzed during the current study are available from the corresponding author upon reasonable request.


