A Semantic Image Retrieval Method Based on Interest Selection
Abstract
There is a semantic gap between people’s understanding of images and the underlying visual features of images, which makes it difficult for image retrieval results to meet the needs of individual interests. To overcome the semantic gap in image retrieval, this paper proposes a semantic image retrieval method based on interest selection. This method analyses the interest points of individual selections and gives the weight of the interest selection in different regions of an image. By extracting the underlying visual features of different regions, this paper constructs two feature vector methods after users’ interest point weighting. The two methods are called interest weighted summation and interest weighting. Finally, this paper compares the accuracy of different image classification methods using a support vector machine classification algorithm. The experimental results show that the target classification accuracy of the classification algorithm based on interest weighted summation is higher than that of the traditional and interest weighted methods. The classification algorithm based on interest weighted summation has the highest overall effect on target object classification in the four experimental scenarios. Therefore, the interest point selection method can effectively improve the overall satisfaction of image recommendation and can be used as a novel solution to overcome the semantic gap.
1. Introduction
With the continuous evolution of artificial intelligence technologies, such as computer vision, speech semantics, and machine learning, society is entering a new era of intelligence. This will cause the transformation of image retrieval modes and reshape the process experience of information retrieval to promote the intelligent upgrading and functional reconstruction of traditional information retrieval.
Images are the most important and effective method for human beings to obtain information because images are intuitive, comprehensible, and informative. In fact, an individual’s understanding of an image not only is based on the visual similarity but also requires the semantic similarity of the image. Image processing algorithms are often used to extract underlying visual features, which cannot be used to fully describe the semantic information of an image [1]. People not only understand images through their accumulated experience, knowledge, and personal preferences from daily life but also understand images through a cognitive mode of thinking from a semantic perspective. This easily leads to a semantic gap between the image semantics and the underlying visual features. Relevant studies try to mimic the human visual attention mechanism to fundamentally solve the semantic gap problem [2–4]. The purpose of filtering redundant information from a large amount of visual information is to find useful information and obtain the high-level semantics of the image. Most of the methods were designed to model visual attention and have been evaluated by their congruence with fixation data obtained from experiments with eye gaze trackers. On the one hand, progress has been made in the construction of visual computing models to simulate the human visual attention mechanism, but these models are still in the simulation stage of human viewing scenes [5–7]. On the other hand, researchers use eye-tracking technology to obtain eye movement behaviour to depict the human visual attention mechanism [8–11]. It is difficult to collect individual eye movement information in large quantities because of the high cost and weak popularity of eye trackers.
In addition to the traditional visual attention calculation model and novel eye-tracking technology, scholars have tried to use other means to reflect and measure human visual attention phenomena, such as motion trajectory models and the click behaviour of a mouse cursor. Related research shows that users’ attention behaviour is related to the mouse cursor trajectory. Users’ interest selections are highly correlated with visual attention, and interest selection can be used to predict the location of the fixation point more accurately than the visual calculation model [12, 13]. Therefore, this paper takes users’ interest points as feedback information to study the problem of interest point weighting in image semantics. Finally, the algorithm is used to study the accuracy of the image retrieval results fused with interest selection.
2. Classification Method Based on Interest Selection
2.1. Feature Vector Based on Interest Point Weighting
2.1.1. Weight Matrix
Therefore, the one-dimensional weight matrix [ω1, ω2, …, ωT] is obtained to provide weight to the eigenvector of the grid object Ct.
2.1.2. Weighted Eigenvector
In this paper, the set of image eigenvectors extracted from grid objects in the experimental scene is expressed as Y = {yt|t = 1,2, …, T}, where yt is the underlying visual feature of the grid object Ct. On this basis, HSV (hue, saturation, and value) and LBP (local binary pattern) are combined to describe the underlying visual features of the grid objects, and a 1 × 131 dimensional visual eigenvector is obtained. This paper uses two methods to express the weighted eigenvector as follows.
The formulas of u(Y) and express the two weighted underlying visual eigenvectors and allow them to be studied with the classification algorithm to explore the impact of interest decisions on the accuracy of image classification.
2.2. Classification Algorithm
The SVM (support vector machine) is a supervised learning method that can be widely used in statistical classification and regression analysis [14–16]. The initial appearance of SVM comes from a linear classifier. Suppose there is a two-class classification problem, and the data points are set as n dimensional vectors x of categories y, where the value of y is +1 or −1. If f(x) = ωTx + b exists, y equals +1 and −1, which are separated on both sides of f(x). It can be assumed that the y value corresponding to x in f(x) < 0 equals −1, while the y value corresponding to x in f(x) > 0 is +1. In most cases, the data are not always linearly separable, so we need to consider how to solve this problem. The SVM method maps the vector to a higher dimensional space, in which a maximum interval hyperplane is established. On both sides of the hyperplane, which separates data, there are two parallel hyperplanes. The optimization goal of separating hyperplanes is to maximize the distance between the two parallel hyperplanes.
The above formula is the application of SVM in image classification by integrating the choice of interest.
3. Point of Interest Experiment
3.1. Purpose
According to the experimental requirements, the subjects needed to click on five points in the experimental picture that they were interested in, and the clicked positions represented the points of interest selected by the subjects. Based on this, the weighted eigenvector is brought into the classification algorithm to study whether the eigenvector based on points of interest has an impact on the accuracy of image classification.
3.2. Subjects
A total of 42 subjects (30 males and 12 females), aged 21 to 25, with an average age of 23, were invited. They had never participated in similar experiments before. They are right-handed and had a strong understanding of the experiment and completed the experiment well according to the requirements of the experimenter.
3.3. Experimental Equipment
The experiment used a desktop computer with a Dell OptiPlex 790 and a CPU frequency of 31 GHz. The capacity of the hard disk is 500 GB, and it runs on a Windows XP operating system.
3.4. Experimental Materials
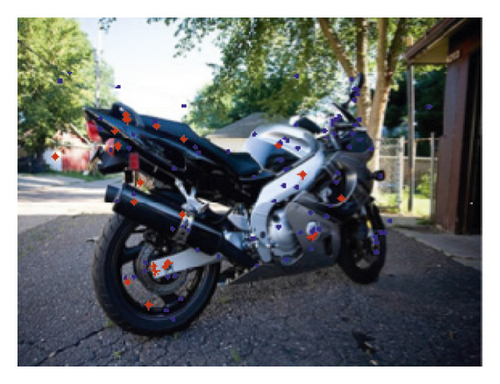
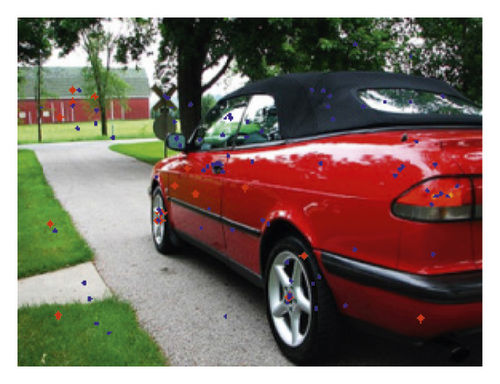
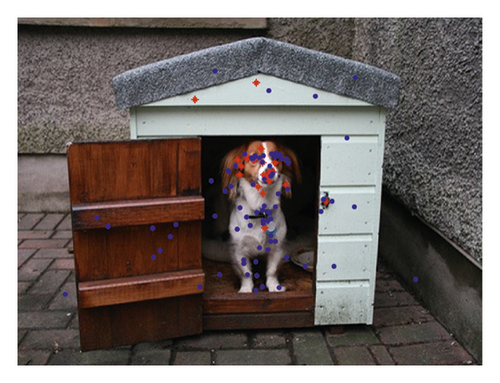
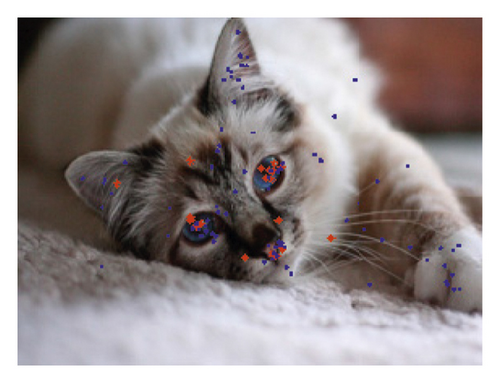
In the experiment, four kinds of pictures, including kitten, puppy, motorcycle, and car pictures, in the PASCAL VOC2007 database were selected. Fifteen pictures of each kind were randomly selected to form a material library of 60 pictures, and the pictures were numbered from 01 to 60 consecutively. According to the specific requirements and specifications of the experiment, the experimental pictures were uniformly adjusted to 500 × 375 pixels. Figure 1 shows examples of the pictures used in the experiments.


3.5. Experimental Results and Analysis
3.5.1. Data Screening and Description
Each subject completed an experimental task with 30 pictures by selecting 5 points of interest from each picture; eventually, an average number of 105 interest points for each picture were obtained. According to the inquiry and investigation after the experiment, interest points that were incorrectly chosen by subjects were eliminated from the experiment to ensure the objectivity and accuracy of the experiment. After removing the abnormal data, the interest point coordinates of each experimental image were derived from the screen coordinates and transformed into 500 × 375 pixel coordinates by a mathematical transformation. Therefore, we ensured that the image coordinates were within the pixel range, in which the value of the X axis ranged from 0 to 500 and that of the Y axis ranged from 0 to 375.
Figure 2 describes the effective distribution of the interest points of all subjects on the example pictures of motorcycles, cars, puppies, and kittens, in which the first points of interest selected by the subjects are marked with red asterisks, and the second to fifth points of interest are marked with blue dots. Figure 2 shows that the interest points are mainly distributed on the target object or foreground object rather than the picture background. The distributions of the interest points on the motorcycle and car target objects are relatively uniform, and the interest points on the dog and cat target objects are relatively concentrated. In particular, the first interest points on the puppy and cat pictures are mainly distributed on the faces.


3.5.2. Data Results and Analysis
First, object classification research is carried out according to the given standards for the four kinds of pictures of kittens, puppies, motorcycles, and cars. When studying the classification of a specific target, this paper takes one kind of picture as the target object and the other three kinds of pictures as interference objects. On this basis, the two classifications of sample objects are realized by combining the non-points of interest method, the IW method, and the IWS method with the SVM algorithm, and these methods are named SVM, IW-SVM, and IWS-SVM, respectively.
Second, in the case of different numbers of uniform grid object segmentations, the IW-SVM and IWS-SVM methods are used to study the average accuracy of target object classification. With the increasing number of regions obtained by uniform grid segmentation from 2 × 2 to 8 × 8, the average classification accuracies of the target objects of the two methods show a decreasing trend, indicating that the improvement in classification accuracy of the target objects is not consistent with the increase in the number of segmented regions. The study found that the average accuracy, which reached 0.8, was the highest in the case of a 3 × 3 segmented mesh.
Finally, according to the classification experimental results of the four kinds of target objects, this paper selects the 3 × 3 segmentation grid to explore the accuracy of target object classification in the four types of experimental scenes. We then randomly generate weights from a group of subject interest points. For example, the weights of the first to fifth interest points are [0.2, 0.2, 0.2, 0.2, 0.2]. This study finds that the weights of the first to the fifth interest points are [0.4, 0.3, 0.1, 0.1, 0.1], and the average accuracy of the target object classification result is the highest. It shows that the first and second interest points of the subjects better reflect the individuals’ intentions and needs, indicating that the first and second interest points selected by the subjects have high research significance and value for target object classification. Table 1 describes accuracies of classification algorithms obtained by the SVM, IW-SVM, and IWS-SVM methods, which are 0.78, 0.75, and 0.85, respectively. Among them, the IWS-SVM method has the highest average accuracy. This shows that the addition of the IWS method can provide high-level semantics to the target object and improve the accuracy of target classification. In this study, we introduce the interest point selection method which can improve the overall satisfaction which can be found in Table 1.
| Target objects | SVM | IW-SVM | IWS-SVM |
| Kitten | 0.80 | 0.74 | 0.85 |
| Puppy | 0.85 | 0.78 | 0.90 |
| Motorcycle | 0.70 | 0.72 | 0.84 |
| Car | 0.75 | 0.76 | 0.81 |
| Average | 0.78 | 0.75 | 0.85 |
4. Conclusion
To overcome the research disadvantages of visual attention computational models and eye-tracking technology in optimizing image recommendations, this paper proposes an image classification method based on interest selection. We focus on explaining the eigenvector of weighted interest points and complete relevant click experiments to realize the classification of experimental scene objects. The experimental results show that (1) the subjects’ first and second choices of interest have a great impact on the target classification in the experimental scenes; (2) the IWS-SVM method has the best overall effect on the target object classification in the four kinds of experimental scenes; (3) the accuracy of target classification combined with the IWS classification algorithm is higher than that of the traditional methods and the IW method; and (4) the interest point method can effectively improve image information retrieval. Our results have shown that the interest point selection can be used as a novel solution to overcome the semantic gap. Therefore, future work could use other information (e.g., eye movements and electroencephalogram) to improve the overall satisfaction of image recommendation.
Conflicts of Interest
The authors declare that they have no conflicts of interest.
Acknowledgments
This study was supported by the National Natural Science Foundation of China (no. 61903346), Postdoctoral Research Project in Jiangsu Province (nos. 2020Z034 and 2019K086), Natural Science Research Project of Colleges and Universities in Jiangsu Province (no. 18KJB520007), China Postdoctoral Science Foundation (no. 2020T130129ZX), and Research Project of Philosophy and Social Sciences at Jiangsu Universities (no. 2020SJA0767).
Open Research
Data Availability
The images used to support the findings of this study are available from the corresponding author upon request.


