Study on Backfill Acoustic Emission Characteristics and Source Location under Uniaxial Compressive
Abstract
This study investigates the acoustic emission (AE) characteristic of cemented tailings backfill (CTB) under uniaxial compressive loading. A classified tailings material source from Wushan Copper Mine was used to prepare cylindrical CTB samples. This study used an SLB10 loading machine for the uniaxial compressive test. A PCI-2 acoustic wave system was attached to the CTB specimen to measure the acoustic emission during loading. Overall, the backfill specimen’s uniaxial compressive strength (UCS) is 3.58 MPa. The failure modes of the CTB sample could be divided into five stages, including the pore microfracture compacting stage (stage-a), linear elastic deformation stage (stage-b), yield deformation stage (stage-c), failure stage (stage-d), and residual stage (stage-e). At each stage, the AE characteristic parameters such as the hits per second (HPS), the cumulative number of impacts, energy rate, and total energy vary a lot, which indicates the AE parameter reflects the internal failure evolution of the CTB sample. In stage-a, no apparent AE behavior was measured. In Stage-b, there is no evident macroscopic change in the specimen, while the AE parameters steadily and continuously increase. During stage-c, the number of AE impacts grows sharply, the energy rate increases significantly, and changes suddenly. The cumulative number of AE impacts is 31.3% in stage-d, and the cumulative energy rate is 49.4%, which is the most active stage of acoustic emission activities. The specimen has prominent crack propagation and bifurcation phenomena. In stage-d, the CTB sample was destroyed entirely, and the characteristic parameters of acoustic emission were significantly reduced. Finally, multiple regression analysis methods are introduced into the time difference positioning method to locate the AE source. The positioning results show that the technique can better invert the close relationship between the damage and destruction of the CTB and the generation and penetration of the internal cracks and describe it to a certain extent. The failure surface of the filler specimen has an excellent guiding value for the analysis of the interior failure characteristics of the sample.
1. Introduction
The filling mining method has developed rapidly because of its characteristics of green environmental protection, high resource recovery rate, and practical ground pressure control [1–5]. Especially with the continuous extension of underground mining depth, the advantages of the filling mining method have become more pronounced [6–8]. The strength of cemented tailings backfill (CTB) is a key indicator of the filling mining technology since it is directly related to the safety of subsequent mining operations, and it is a source of worry for mining researchers [9–12]. Wen et al. [13] studied the factors that affect the strength of cemented backfill. The results show that the strength of cemented backfill is affected not only by single factors such as aggregate gradation, solid mass concentration, and cement content but also by the interaction of these factors. Mu et al. [14] studied the relationship between the strength of backfill and ultrasonic wave velocity and established a prediction model for the uniaxial compressive strength (UCS) of backfill based on the ultrasonic pulse velocity. Ercikdi et al. [15] show the linear relationship with a high correlation coefficient that appeared to exist between the UCS and ultrasonic pulse velocity UPV for CTB samples. Therefore, it is of great significance to study the strength characteristics of the backfill and analyze the failure modes and failure laws at different stages to optimize backfill strength.
The CTB is a multiphase heterogeneous mixture with pores/cracks formed by mixing aggregate, cementing material, water, and solidifying after a certain curing age. It has complex mechanical properties. So it is necessary to study the damage and failure mode of backfill utilizing a new technology. At present, the scanning electron microscope (SEM) [16, 17], CT [18], UT (ultrasonic testing), and acoustic emission testing (AE) are used to study the internal failure mode of rock and soil specimens. When a material or structure is subjected to stress due to its microstructure’s unevenness and defects, local stress concentration occurs, resulting in macroscopic manifestations such as plastic deformation, phase transformation, and cracking. In this process, a portion of the strain energy is released in a stress wave. This phenomenon of releasing strain energy in the form of an elastic stress wave is called acoustic emission (AE) [19], and the place where the wave occurs is called the acoustic emission source. AE testing technology uses sensors installed on the surface of materials to receive part of the stress waves transmitted to the surface to form a detection signal. Damage evaluation and research of materials can be realized through the detection, recording, and analysis of these signals [20, 21]. Cheng et al. [22] studied the influence of particle size on the mechanical properties of cemented backfill and obtained the strength of CTB and the characteristic parameters of AE. Sun et al. [23] studied the relationship between the AE signal and the failure of the backfill and constructed the constitutive damage model of the backfill. Zhao et al. [24] studied the relationship between AE event rate, ringing count rate, and stress-time through uniaxial compression and splitting failure tests. Cao et al. [25] investigated the compressive strength behavior and AE characteristics of 180-day cured CTB samples by using four different loading rates. The essential findings provided a scientific reference for studying the dynamic characteristics of CTB samples.
The results show that the AE parameters contain the damage information of the CTB and can describe the damage evolution process of the backfill. Still, the AE detection technique is not used to analyze the AE source.
Considering that wave velocity is also an important index for measuring rock mass failure [26], to comprehensively analyze the failure process of backfill mass, the mechanical properties of Wushan Copper Mine tailings are tested under uniaxial compression conditions. The AE technique analyzed the mechanical and AE characteristics of the backfill, and AE parameters characterized the failure mechanism of the backfill. On this basis, the method of time difference location is used to locate the AE source and verify the failure mechanism of the backfill.
2. Test Analysis
2.1. Basic Physical Properties of Tailings
The tailings used in the test were taken from the flotation workshop of the Wushan copper concentrator. Its density is 3.1 g/cm3. Figure 1 shows the composition of grain size.
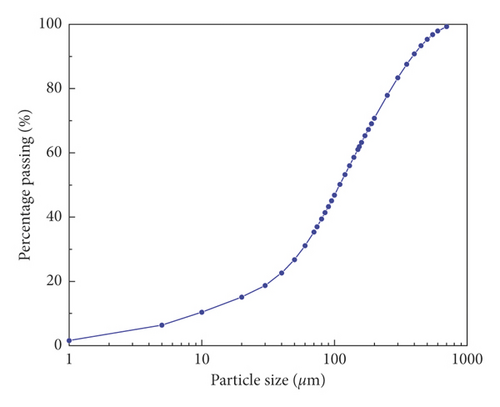
The grain size distribution of the tailings determined as per relevant ASTM D422 is summarized in Figure 1. The grain size analysis shows the tailings contain 60% of the particles finer than 145.6 μm (d60), 30% of the particles finer than 57.4 μm (d30), and 10% of the particles are than 9.4 μm (d10). The grain size analysis also shows it contains 37% of fine particles <74 μm and 22% of fine fractions <40 μm, which identifies the tailings as coarse sand. The calculated uneven coefficient, Cu is 15.54. As summarized in Figure 1, the grain size distribution curve slope is steep, and the curvature coefficient Cc is 2.4. The tailings particles are relatively uniform in size and are, however, poorly graded.
2.2. Sample Preparation
The cylindrical specimens were made according to the standard of ASTM D4832, and the dimensions were diameter × height: 55 mm × 110 mm. The specimen mass fraction is 74%, and the cement content is 20%. The prepared specimens were maintained in the YH-40B curing box with the curing parameters of 20°C, 95% humidity, and 28 days of age.
2.3. Sample Equipment and Method
The test instrument comprises an SLB100 press machine produced by Changchun Machinery and a PCI-2 AE system produced by PAC Company of the USA. Figure 2 shows the A.E. test system. The main shaft adopts displacement control in the experiment, and the loading rate is 0.003 mm/s. The PCI-2 AE system is connected to a computer, which can set, monitor, and store acoustic emission parameters and realize real-time control of AE signal collection. The AE probe contacts the specimen, and a preamplifier is connected between the probe and the acquisition card. The threshold value of the sensor signal acquisition is 45 dB.
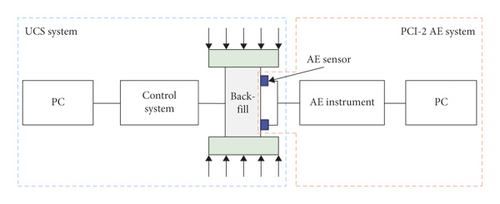
In order to reduce the end restraint, two pieces of abrasive reducing paper are placed at both ends of the specimen, and a little butter is put between the two pieces of paper. Four AE probes are fixed on the surface of the CTB according to the space “cross” arrangement. Figure 3 shows the AE test method. The AE measurement point area is smoothed, and the smoothed area is 16 mm × 16 mm. After installing the radial displacement extensometer in the middle of the specimen, the SLB100 press completes the uniaxial loading. The control system and the AE detection system are used to collect the data in uniaxial compression until the loading is completed.

2.4. AE Characteristic Parameters
The CTB is an elastoplastic material, and the stress wave will be released by the derivation and expansion of internal cracks during loading. The stress waves show different acoustic signals at different time intervals. An AE signal is a complex waveform containing a lot of information. Choosing the appropriate signal processing method to analyze acoustic emission signals is always a complex problem in developing AE detection technology. The characteristic parameter analysis is a standard method for AE signal analysis at present. The AE parameters commonly include impact (waveform) counting, ringing counting, energy, amplitude, lasting time, rise time, and threshold voltage. Figure 4 shows the specific meaning. The AE characteristic parameters are closely related to the signal of the same waveform; they appear or disappear simultaneously. Hence, they have similarities in describing the destruction mechanism of the specimen.
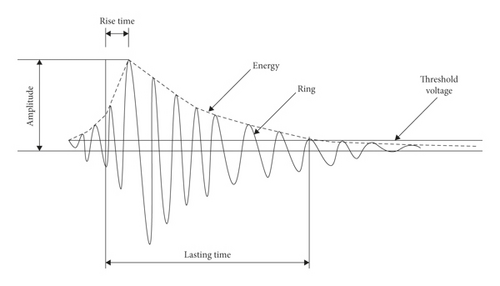
A hit is any signal that exceeds a threshold and causes a channel to acquire data. It reflects AE activities’ total amount and frequency. The change in hit number demonstrates the transformation of the internal structure of the specimen. It can be used to characterize microcrack evolution [23, 27]. In this paper, the total number of AE hits per second (HPS) is adopted as the AE parameter for study. Energy is the area under the envelope of signal detection, reflecting the intensity of the signal, and is an important parameter indicating the material failure of the specimen, providing a basis for predicting the material instability failure.
3. AE Test Results and Analysis
In order to study the mechanical properties of backfill under uniaxial compression, the AE characteristic parameters such as HPS, cumulative HPS, energy rate, and energy were investigated. Considering that several groups of filling blocks’ mechanical properties and AE characteristics are almost the same, only one group is selected as a type specimen for analysis.
-
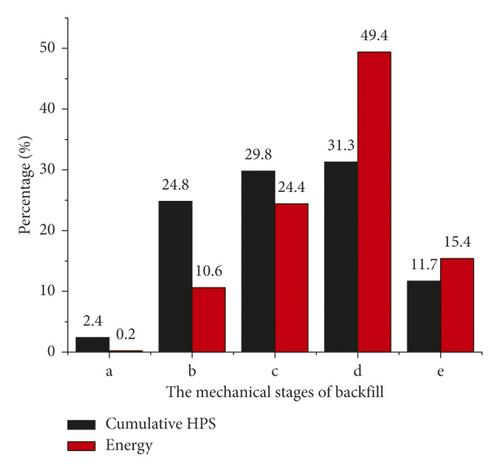
Stage-a: the stress-time curve of the backfill body is concave at the early stage of stress loading (0–53 s), and the number of hit times and energy rate in this stage are less. The cumulative HPS accounts for 2.4% of the total HPS number, and the energy accounts for 0.2% of the total energy. The results show that the AE activity is not active during stage-a, mainly because the CTB is artificially prepared and artificially stirred to ensure the excellent homogeneity and compactness of the filling body. There is less friction between the particles in the CTB during the compression process. There is no change in the appearance of the specimen.
-
Stage-b: with the increase of stress, in the 53 s–80 s period, the CTB enters the linear elastic stage, the loading curve is nearly straight, and the pressure is about 6.99 KN, reaching 82% of the maximum stress. At this stage, the pore/fractures in the backfill continue to compress, and microcracks begin to appear on the soft surface of the interior. The HPS and energy rate increase steadily. The cumulative HPS and energy rate account for 24.8% and 10.6%, respectively. From the experimental process, there is no noticeable change in the macroscopic structure of the CTB, only a slight abscission at the end.
-
Stage-c: during the 80 s–91 s, the slope of the stress-time curve gradually decreases until it becomes zero, the loading stress reaches its peak value, the backfill enters the yield softening stage, and plastic deformation occurs. The microcracks will cause the stress adjustment of the stress frame after the grain bond fracture, which will lead to an increase in the stress near the grain and failure when the pressure near the grain reaches bond strength. The change in the stress transfer path and the weakening of the mechanical framework showed that the number of HPS increased sharply and approached the maximum value. The energy rate also increased obviously. There were two significant, abrupt changes, and the AE activity was active, indicating that pores/fractures in the CTB were accelerated. The accumulative HPS accounted for 29.8% of the total hits, and the accumulative energy rate accounted for 24.4% of the total energy. From the perspective of the test process, at this stage, the filling body began to show cracks on a macro scale, and the cracks continued to expand, gradually showing a certain penetration tendency.
-
Stage-d: during the period of 91 s to 125 s, after the loading stress reaches its peak value, the backfill body decays sharply, the pressure drops significantly, and the slope of the stress-time curve becomes negative. The number of HPS has been significantly reduced but is still relatively strong. It is mainly due to the continuous accumulation of internal damage as the cracks in the CTB expand and increase, finally forming a macroscopic fracture surface that affects the propagation of elastic waves inside the filling body, resulting in the AE signal being reduced. But the rupture of the backfill will produce many elastic waves, which will make the energy rate abrupt many times and reach the highest value. From the test process, the appearance of the CTB has apparent crack growth and bifurcation phenomena, and the small cracks gradually penetrate the large cracks, causing apparent damage.
-
Stage-e: during the 125 s to 170 s, the speed of stress reduction is slowed down. Because the filling body still has a specific bearing capacity, the stress is maintained at a lower level and does not decrease to zero. At this stage, the AE HPS in the backfill reduces significantly, and the accumulative hits increase slowly, almost no more. The AE energy rate is a small peak of abrupt change, mainly caused by the sound produced by the partial breakage and shedding of the filling body. In this stage, the accumulative HPS accounts for 11.7% of the total hits, and the accumulative energy rate accounts for 15.4% of the total energy. The filling specimen mainly shows the block sliding along the macroscopic fracture surface from the test process until failure.
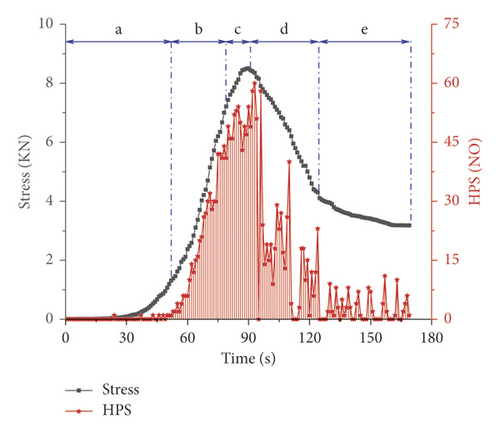
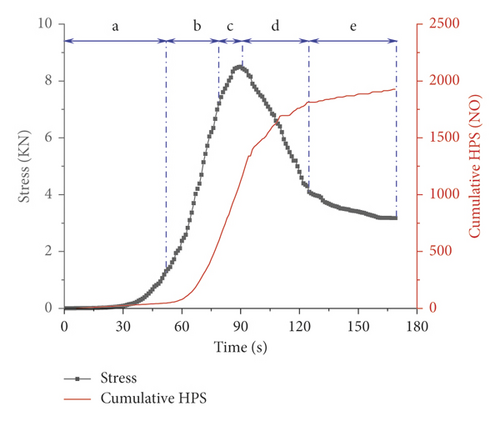
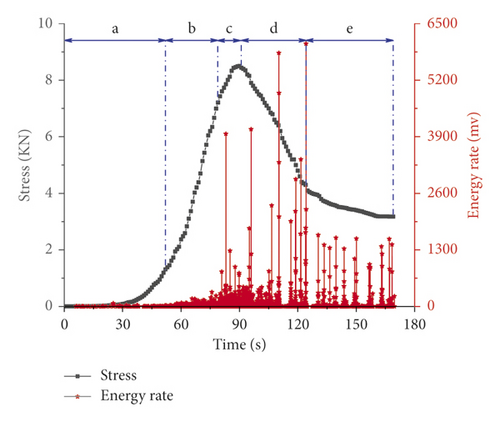
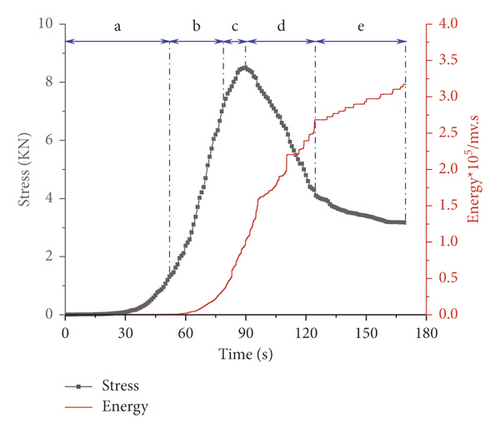
Based on the above analysis, there are five mechanical stages in the failure process of backfill under uniaxial compression, and each stage has a different form. The AE signal also shows prominent stage characteristics, indicating that the AE characteristic parameters can reflect the CTB’s internal failure evolution law.
Figure 9 shows the cumulative HPS and energy rate in different mechanical stages. In stage-d, the cumulative HPS is 31.3%, and the cumulative energy rate is 49.4%, all of which reach the maximum value. There are apparent crack propagation and bifurcation in the filling body. And many new cracks are produced simultaneously, which is the most active stage of AE activity. Therefore, it is verified that the characteristic emission parameters can characterize the evolution law of primary crack propagation and penetration in the filling body.
4. Exploration and Analysis of AE Source Location
4.1. Calculation Method for AE Source Location
AE source location is an essential work in the AE test, and it is also an important index in AE detection and evaluation. The main methods of location are time difference location and area location [28–30]. The time difference location is based on the time difference between the AE signals from the same AE source arriving at different sensors, combining the parameters such as wave velocity and the distance between sensors. [31]. Figure 10 shows the principle of source positioning in a two-dimensional plane. This paper studies the AE localization of the CTB under uniaxial compression using the time difference localization method.
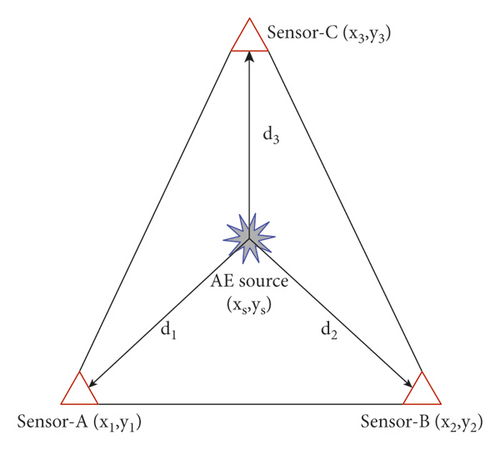
In the equation, XS and YS are the AE sources coordinate.
The location of the sound source can be obtained by obtaining multiple sensor data using formula (4) simultaneously. The mathematical method becomes more complicated when it extends to 3D or rolls up the envelope into a 3D object, but the basic principle remains the same.
The standard methods of time difference location are the least square method, Geiger linear location method, multievent location method, etc. [32]. This paper introduces multiple regression analysis to search for the most suitable location among all source location data.
The χ2 is called the fitness value, which depends on the coordinated value corresponding to the source location, and the calculation process is an iterative searching process. This article uses the simplex search method to write the locator code to find the minimum value of xs, ys, and zs.
4.2. Results and Analysis of AE Source Location
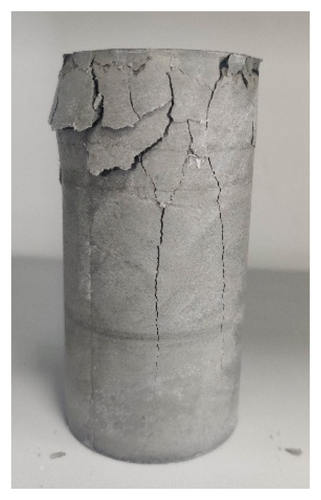
In order to study the internal failure characteristics of the filling material, the experiment was based on the improved time difference location method to conduct AE localization analysis. Before carrying out the AE test, the average velocity of the sound wave in the CTB was measured at 1147.9 m/s. This indicates that the velocity of wave propagation in the CTB is very fast, and the time from one end to the other end is only 95.8 μs. Therefore, on the basis of fixed acoustic velocity, the AE test is carried out, and the location of the AE source is analyzed. The analysis results are shown in Figure 11. It can be seen that the AE source points are concentrated on the top of the specimen, and the cracks are interspersed and penetrated complicatedly. Through the analysis of internal and external location points, it is deduced that the failure mode of the specimen is mainly splitting failure, which is in good agreement with the actual collapse. It is shown that the improved method can be used to inverse the close relationship between the damage failure of the CTB and the generation and transfixion of internal cracks.

Compared with Figures 11 and 12, some edge cracks of the backfill specimen are not reflected in the process of sound source localization. There are two main reasons for the analysis. First, because of the anisotropy of the backfill material, the acoustic signal will scatter and attenuate in the process of propagation, especially after cracks occur in the specimen. It limits the propagation of AE signals in the CTB.
5. Conclusions
- (1)
The UCS of the CTB is 3.58 MPa when the mass fraction is 74%, the cement content is 20%, and the curing age is 28 days. The whole compression process of the backfill can be divided into five stages: the pore microfracture compacting stage, linear elastic deformation stage, yield deformation stage, failure stage, and residual stage.
- (2)
In the failure stage, the cumulative HPS is 31.3%, and the cumulative energy rate is 49.4%, all of which reach the maximum value. The filling body has apparent crack propagation, bifurcation, and many new cracks, which are the most active stages of AE activity.
- (3)
The multiple regression analysis methods are introduced in the time difference location method. The positioning results are concentrated on the top of the specimen, and the cracks are interspersed and penetrated complex, which is more consistent with the actual situation. However, some cracks are not reflected in the positioning results, mainly due to the anisotropic characteristics of the CTB material and the iterative calculation with a fixed sound wave velocity.
- (4)
The AE characteristic parameters can reveal the evolution of the original cracks in the CTB, which indicates that the AE technique is of great value in the analysis of the failure characteristics of the CTB.
Conflicts of Interest
The authors declare that there are no conflicts of interest regarding the publication of this paper.
Acknowledgments
The authors would like to acknowledge the financial support from the National Key R&D plan Intergovernmental International Scientific and Technological Innovation Cooperation (Grant no. 2021YFE0102900), the Exploration fund of BGRIMM (no. 02-2127).
Open Research
Data Availability
The data used to support the findings of this study are available from the corresponding author upon request.


