Research on Interface Slip of Composite Reinforced Steel Truss-Concrete Test Beam and Its Calculation and Analysis Method
Abstract
In this study, a model of test beam in negative moment area is designed, and the slip characteristics of test beam under overlimit static load and variable amplitude cyclic load are studied, respectively. By constructing the relationship between shear stiffness and slip parameters of the test beam, the deformation calculation method of the test beam under different fatigue cycles is derived, and the accuracy of the calculation model is verified by experiments. The results show that the maximum slip value (0.038 mm) of static load after 10,000 times of limited fatigue load is increased by 58.3% compared with that before overlimit fatigue load is applied (0.024 mm). When the fatigue cycle is 0-2 million times, the total slip is between 0.019 and 0.026 mm and the residual slip percentage is between 4.17 and 8.33%. The maximum residual values are 0.022 mm, 0.027 mm, and 0.028 mm after 1.5 times, 2 times, and 3 times of overload and variable amplitude fatigue loads, respectively, and the slip values have no obvious fluctuation, all of which show good working performance. The average value of the ratio between the deformation value and the measured value of composite beams is 0.89, and the standard deviation is 4.86%. When the fatigue loading times are more than 2.8 million, the ratio between the calculated value and the measured value is less than 0.85, so the adaptability of the calculation model has certain limitations. On the whole, the calculation model proposed in this study fully considers the factors such as the stiffness and fatigue loading times of composite beams, and the error between the calculated results and the measured results is within 5%, with high accuracy, which can be used as a reference for the actual design.
1. Introduction
Steel-concrete composite beam is a new type of member with good mechanical performance, which is formed by connecting steel beam and concrete slab through different shear connection structures. It has the mechanical characteristics of steel structure and concrete structure and is widely used in bridge structure design [1, 2]. Steel-concrete composite beam bridge deck has good ductility and seismic performance. Steel truss girder and concrete bridge deck are mainly connected by various shear keys, and their structural forms include deck composite bridge, half-through composite bridge, and through composite bridge [3]. For bridge design, the main function of steel-concrete composite beam bridge deck is to bear the dynamic load of vehicles, so it is particularly important to carry out the fatigue design of steel truss-concrete composite beam reasonably [4, 5].
In the study of fatigue cycle characteristics of test beams, foreign scholars have carried out a lot of research [6, 7]. Gattesco et al. have found that the traditional load-fatigue life calculation method has good adaptability only when the assembly structure is in an elastic state, but for composite beams with shear connection structure under low cycle fatigue load, the relative slip between steel and concrete will cause inelastic deformation of the connectors [8]. In recent years, domestic scholars have also carried out a large number of researches on the slip characteristics between steel plates and concrete. Zhou et al. have studied the static and fatigue mechanical characteristics of steel-concrete composite bridge deck, and, respectively, adopted the combination method of converted section and stiffness reduction and then put forward the deflection calculation formula of composite beams [9]. Through multiple fatigue tests on composite beams with partial shear connection structures, it is found that the fatigue stiffness calculation method is only based on the fitting of test data and the adaptability of the model has yet to be investigated [10]. In addition, a new calculation model was developed for the deformation behavior of steel-concrete composite beams under fatigue loading, taking into account the cross-sectional stiffness, pegging performance, load amplitude, and load ratio of the composite beam [11, 12]. Jianjun has carried out many fatigue tests on composite beams with partial shear connections and deduced the calculation method of fatigue stiffness, but it is only based on the fitting of test data, so the adaptability of the model needs to be studied [10]. Nie and Wang studied the deformation behavior of steel-concrete composite beams under fatigue load and deduced their parallel calculation model. The proposed model considered the cross-sectional stiffness of composite beams, stress performance of studs, load amplitude, load ratio, and other factors [11]. Composite beams are prone to fatigue failure when subjected to repeated vehicle loads [12]. Fatigue load will increase the slip at the interface between concrete and steel beam, and the increase of slip will reduce the stiffness of composite beam [13, 14]. Therefore, in the actual design of steel-concrete composite beams, if only the stiffness of composite beams subjected to fatigue load is calculated according to the static method, the final deformation value of composite beams will be smaller than the actual value, which makes the design of composite beams unsafe [15].
In this study, based on Tsing Qi Chung Bridge of Guangzhou-Foshan-Zhaoqing Expressway, a test beam model with negative moment area is designed. Firstly, the interface slip characteristics of fabricated steel truss-concrete test beams are studied, and the slip characteristics of test beams under overlimit static load and variable amplitude cyclic load are tested, respectively. Secondly, based on the existing calculation and analysis method of interface residual slip of test beam under fatigue load, the deformation calculation method of test beam under different fatigue cycles is deduced by constructing the relationship between shear stiffness and slip parameters. Finally, the accuracy of the calculation model is verified by experiments, which provides theoretical guidance for the engineering application of new fabricated steel truss-concrete test beam.
2. Materials and Methods
2.1. Design of Test Beam
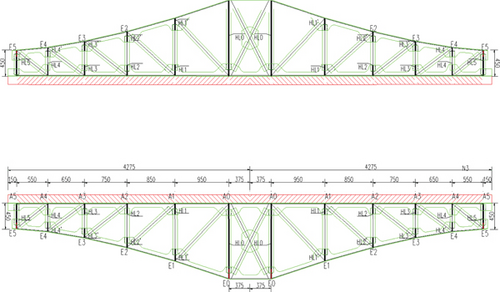
A variable cross-section test beam with negative moment (as shown in Figure 1) is designed and manufactured. The total length of test beam is 8.55 m, and its overall height is 1.44 m; the height of steel truss is 1.3 m, the height of concrete bridge slab is 0.14 m, the width of top slab of concrete bridge slab is 0.7 m, the width of bottom slab of concrete bridge slab is 0.26 m, and the spacing between steel web members is 0.22 m. The cube compressive strength of the concrete specimen was 71.39 MPa, the axial compressive strength was 47.6 MPa, the splitting tensile strength was 4.2 MPa, the modulus of elasticity of the concrete was 44796 MPa, and the modulus of elasticity of the steel was 210055 MPa. The top chord of steel truss beam is connected with the bottom slab of concrete by PCSS new shear key, and all joints of truss are connected by submerged arc welding. The test beam is designed refers to 4.3.7 of the general specification for design of highway bridges and culverts D60-2015 [16]. Fatigue load I (lane load model) is adopted, and the lane load is taken as 0.7 times, and multilane reduction is considered at the same time. In this experiment, the Midas/civil software is used to build the finite element model of Qingqiyong Bridge. The whole bridge has 3958 nodes and 4811 units. When the surface stress of bridge deck is 3.6 MPa, the load of test beam is 154 kN. When the surface stress of bridge deck is 4.8 MPa, the load of test beam is 220 kN. Therefore, the upper and lower limit of fatigue load in normal use stage are 154 kN and 220 kN, respectively.
2.2. Slip Characteristic Test of Test Beam
- (1)
Loading Schemes under Different Fatigue Loads. Bridges are often subjected to overload during actual operation. Firstly, the test beam is subjected to 10,000 times of overlimit cyclic loading, and the change rule between slip and load is discussed. After 10,000 times of overlimit cyclic loading, the test beam is subjected to constant amplitude cyclic loading for 2 million times, and static loading test is carried out after reaching a certain number of cycles. When the test beam has not been damaged under 2 million constant amplitude cyclic loads, the slip-load variation law of the test beam under variable amplitude cyclic loads is discussed by keeping the lower limit of fatigue load unchanged and increasing the upper limit of fatigue load. At first, 2 million times of fatigue cyclic loading with 154 kN-220 kN are carried out, and then, 1.5 times (154 kN-244 kN) vehicle overload after 500,000 times, 2 times (154 kN-272 kN) vehicle overload after 300,000 times, and 3 times (154 kN-320 kN) vehicle overload after 300,000 times are carried out, respectively. The American MTS equipment is used to load the test beam, and JM3812 static strain test and analysis system is used to test the deflection distribution of the test beam after different fatigue loading times.
- (2)
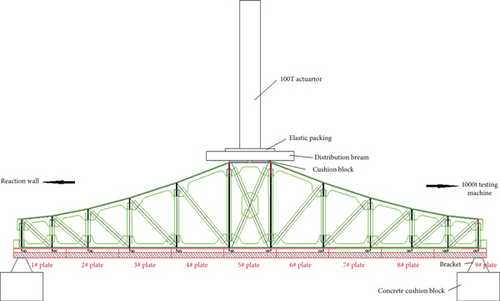
Test Scheme of Slip Distribution. In this test, a slip measuring point is, respectively, arranged in the middle of 1#-9# steel plates to obtain the change law of slip and load between steel plate and concrete. The specific test scheme is as follows: 10 deflection measurement points were arranged at the support position, quarter point position, and midspan position of the combined beam. Firstly, a plexiglass sheet is pasted on the concrete plate, and then, a steel seat is installed at the outer edge of the upper chord of the steel truss 2.5 cm away from the plexiglass sheet, so that the dial indicator passes through the reserved hole of the seat and abuts against the plexiglass sheet. Finally, the slip distribution between steel and concrete under different loading tonnage can be measured by the degree of dial indicator (the arrangement of measuring points is shown in Figure 2 below).
3. Results and Discussion
3.1. Slip Test Results of Test Beam under Overlimit Static Load
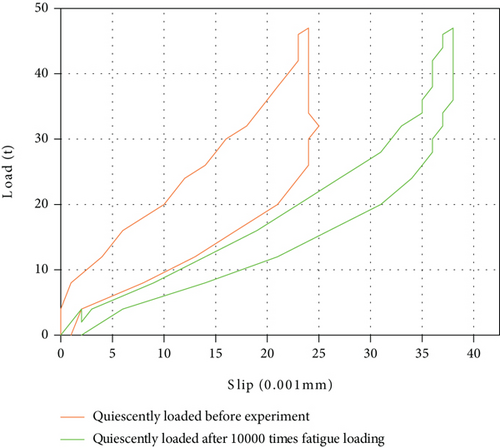
Figure 3 is the load-slip curves of No. 1 concrete slab before the application of overlimit fatigue load and after the overlimit fatigue load is applied for 10,000 times. It can be seen that the two curves show similar development trends. When the load is less than 36 t, the slip value generally shows a linear increase trend with the increase of load. When the load is further increased to 47 t, the slip growth slows down, because the stud is in a state of combined bending and shear stress, and there are tension side void zone and compression bonding zone between stud and concrete, so stud is in the stage of elastic-plastic deformation. When the load starts to decrease, the slip recovery lags behind, showing a trend of slow first and then accelerated decline. Further comparison shows that the maximum slip value is 0.024 mm when the load reaches 47 t during the static load before the overlimit fatigue load is applied. However, during the static load test after 10,000 times of overlimit fatigue loading, the increase rate is smaller than that before loading. When the load reaches 47 t, the maximum slip value is 0.038 mm, which increases by 58.3%. By comparison, it can be seen that the slip value between steel plate and concrete increases with the increase of fatigue load times. Under the same load, the slip value in the static load stage before the test is less than that in the static load stage after 10,000 overload fatigue loads. On the other hand, under the action of repeated load, the concrete near the stud will increase the void displacement between the stud and the concrete, resulting in the total slip amount of static load after 10,000 fatigue cycles under the same load is greater than the slip amount of static load before the test, which also indicates that the test beam has accumulated damage after the overlimit fatigue load [17, 18].
3.2. Slip Test Results of Test Beam under Variable Amplitude Cyclic Load
3.2.1. Static Load Slip Test Results after 2 Million Fatigue
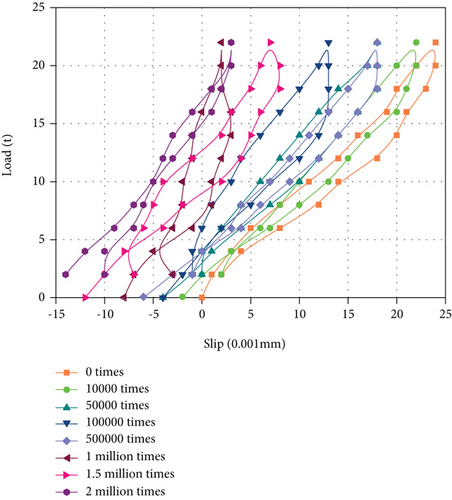
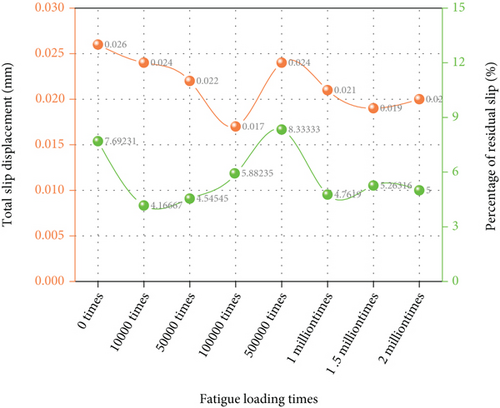
After 10,000 times, 50,000 times, 100,000 times, 500,000 times, 1 million times, 1.5 million times, and 2 million times of fatigue loading, the static load-slip curve of 2 million times of fatigue is obtained (as shown in Figure 4(a)). It can be seen from the figure that the static load curves after different fatigue loadings show an increasing trend as the load increases. When the load begins to decrease, the slip value first decreases slowly and then decreases rapidly. On the other hand, with the increase of cyclic fatigue loading times, the residual slip value is negative, which is mainly due to the relative displacement between steel truss and concrete after 10,000 times of overlimit loading, and the slip slowly recovers after fatigue loading. When the fatigue loading times are less than 500,000, the average residual slip is 0.001 mm, while when the fatigue loading times are 500,000-2 million, the average residual slip is 0.003 mm, which indicates that the residual slip will increase with the increase of fatigue loading times, but the increase is not obvious. Generally speaking, the residual slip of the test beam is small after 2 million times of fatigue from 154 kN to 220 kN, which indicates that the combined test beam has better elastic performance. Figure 4(b) shows the change of total slip and residual slip percentage of the test beam under different fatigue loading times. It can be seen from the figure that with the increase of fatigue loading times, both the total slip and residual slip percentage show a trend of first decreasing, then increasing, and then decreasing. The total slip is between 0.019 and 0.026 mm, and the residual slip percentage is between 4.17 and 8.33%. When the fatigue loading times are 500,000 times, the residual slip percentage reaches the maximum value (8.33%). Overall, the maximum slip of the test beam is relatively stable, indicating that the test beam is still in elastic working state after 2 million fatigue loads
3.2.2. Slip Test Results of Static Load after 1.5 Times Overload Fatigue
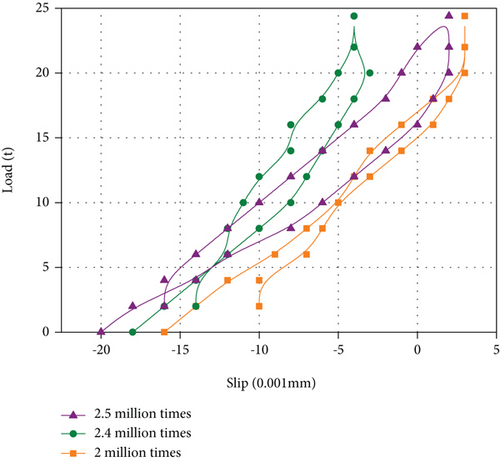
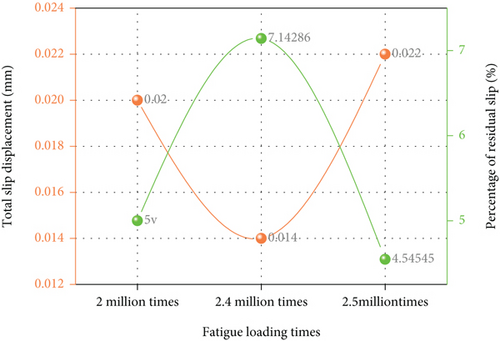
Figure 5(a) shows the static load-slip curve of the test beam after static load cycling after 2 million, 2.4 million, and 2.5 million fatigue loads, respectively. It can be seen from the figure that the residual slip value is negative after 2 million, 2.4 million, and 2.5 million cyclic fatigue loads, and the average residual slip increases with the increase of cyclic fatigue loads. Figure 5(b) shows the relationship between the maximum slip of concrete slab and fatigue loading times. It can be seen from the figure that when the load reaches 244 kN, the slip value between concrete slab and steel truss shows a trend of first decreasing and then increasing, ranging from 0.014 mm to 0.022 mm. However, with the increase of fatigue loading times, the percentage of residual slip first increases and then decreases. When the loading times are 2.4 million times, the percentage of residual slip reaches the maximum of 7.14%. Generally speaking, after 1.5 times overload loading, the maximum slip fluctuation of the test beam is not obvious, showing good working performance
3.2.3. Slip Test Results of Static Load after 2 Times Overload Fatigue
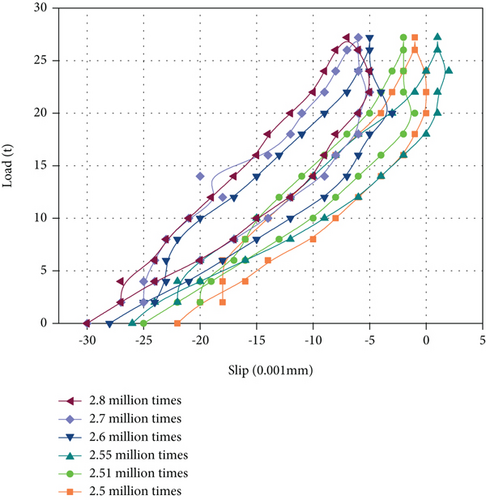
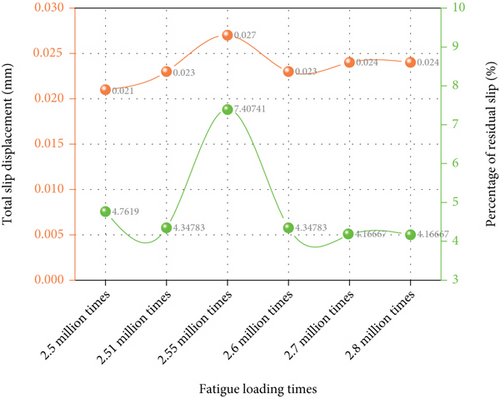
Figure 6(a) shows the static load-slip curve of the test beams after static load cycle and after 2.5 million, 2.51 million, 2.55 million, 2.6 million, 2.7 million, and 2.8 million fatigue loading, respectively, under the action of 2 times overload and variable amplitude fatigue load. It can be seen from the figure that the residual slip values are negative after different cyclic fatigue loads, and the average residual slip value increases with the increase of cyclic fatigue load times, but the increase is not obvious. Figure 6(b) shows the relationship between the maximum slip and the fatigue loading times of concrete slab. It can be seen from the figure that when the load reaches 272 kN, the slip value between concrete slab and steel truss is increased first and then decreased and finally reaches a stable trend, with the slip value between 0.021 mm and 0.027 mm, while the residual slip percentage decreases slightly and then decreases rapidly with the increase of fatigue loading times. When the loading times are 2.55 million, the maximum residual slip percentage is 7.40%. Generally speaking, the maximum slip and residual slip percentage of the test beam are not obvious after 2 times of overload loading, showing good working performance
3.2.4. Slip Test Results of Static Load after 3 Times Overload Fatigue
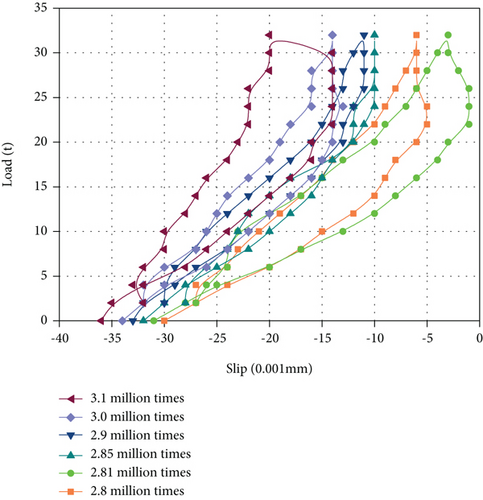
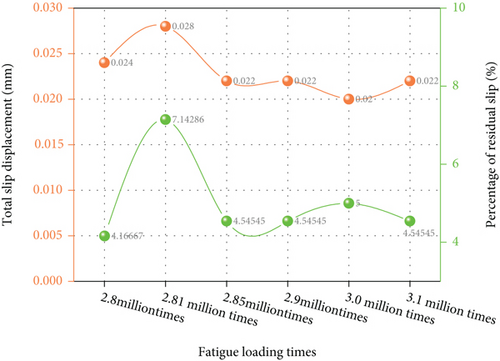
Figure 7(a) shows the static load-slip curve of the test beam after static load cycling and after fatigue loading of 2.8 million times, 2.81 million times, 2.85 million times, 2.9 million times, 3 million times, and 3.1 million times, respectively. It can be seen from the figure that the residual slip value is negative after different cyclic fatigue loads, and the average residual slip increases with the increase of cyclic fatigue loads. When the fatigue cycle is more than 3 million times, the average residual slip increases obviously. Figure 7(b) shows the relationship between the maximum slip of concrete slab and fatigue loading times. It can be seen that when the load reaches 320 kN, the slip value and residual slip percentage between concrete slab and steel truss show a trend of first increasing and then decreasing and finally reaching a stable level. The slip value ranges from 0.020 mm to 0.028 mm, and when the loading times are 2.81 million times, the residual slip percentage reaches the maximum of 7.14%. Generally speaking, after 3 times overload loading, the fluctuation of maximum slip and residual slip percentage is not obvious, and it still shows good working performance
3.3. Deformation Theory Calculation and Experimental Verification of Test Beam under Fatigue Load
3.3.1. Theoretical Calculation of Test Beam Deflection
where J is the longitudinal shear force, K is the shear stiffness of shear keys, m is the spacing of connectors, and W is the slip.
To solve the slip parameter W, the steel truss test beam is simplified (the simplified model is shown in Figure 8 below), and half of it is calculated according to its symmetrical structure and loading characteristics.
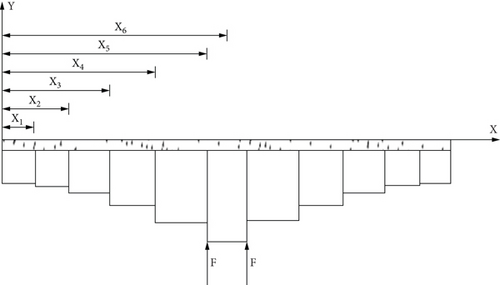
where W1 is the slip parameter of the interface between concrete and steel truss and α2 and β2 are the parameters of x1 - x2 section.
where W2 is the slip parameter of the interface between concrete and steel truss and α6 and β6 are the parameters of x5 - x6 section.
Among them, the values of α and β in each section of the test beam are obtained from the following Table 1:
| Parameters | 0-x1 | x1-x2 | x2-x3 | x3-x4 | x4-x5 | x5-x6 |
|---|---|---|---|---|---|---|
| α | 0.0167 | 0.0151 | 0.0118 | 0.0084 | 0.0060 | 0.0045 |
| β | 4.3591 | 4.3830 | 3.8526 | 3.2075 | 2.7048 | 2.4563 |
| Equivalent plate thickness | 4.39 | 2.48 | 1.35 | 1.15 | 0.96 | 0 |
3.3.2. Test Verification
The above calculation method is used to calculate the midspan deflection value of the test beam under fatigue loading of 154-220 kN for 0-2 million times, fatigue loading of 154-244 kN for 500,000 times, fatigue loading of 154-272 kN for 300,000 times, and fatigue loading of 154-320 kN for 300,000 times, respectively, and the comparison with the actual measured value is shown in Table 2. It can be seen from Table 2 that the average value of the ratio between the deformation value and the measured value of composite beams is 0.89, and the standard deviation is 4.86%. In addition, it can be found that with the increase of fatigue loading times, the calculation accuracy of the model decreases gradually. When the fatigue loading times are more than 2.8 million times, the ratio of the calculated value to the measured value is less than 0.85, and the calculation results are unsafe, so the adaptability of the calculation model has certain limitations. Generally speaking, the calculation model proposed in this study fully considers the stiffness and fatigue loading times of composite beams. Compared with the measured results, the error is within 5%, so the accuracy is high, which can be used as a reference for practical design
| Sample number | Loading times (10,000 times) | Deflection measured values-left site (mm) | Deflection calculation (mm) | Deflection calculation/deflection measured values |
|---|---|---|---|---|
| Combination beam with 2 million cyclic loads | 0 | 1.20 | 1.10 | 0.92 |
| 1 | 1.25 | 1.15 | 0.92 | |
| 1.5 | 1.25 | 1.17 | 0.94 | |
| 3 | 1.25 | 1.14 | 0.91 | |
| 5 | 1.27 | 1.07 | 0.84 | |
| 5.5 | 1.25 | 1.13 | 0.9 | |
| 10 | 1.30 | 1.22 | 0.94 | |
| 20 | 1.25 | 1.18 | 0.94 | |
| 50 | 1.22 | 1.21 | 0.99 | |
| 80 | 1.20 | 1.15 | 0.96 | |
| 100 | 1.23 | 1.18 | 0.96 | |
| 120 | 1.23 | 1.06 | 0.86 | |
| 140 | 1.18 | 1.04 | 0.88 | |
| 160 | 1.36 | 1.23 | 0.9 | |
| 180 | 1.30 | 1.12 | 0.86 | |
| 200 | 1.30 | 1.05 | 0.81 | |
| Combination beam with 2.5 million cyclic loads | 200 | 1.75 | 1.52 | 0.87 |
| 210 | 1.70 | 1.61 | 0.95 | |
| 220 | 1.70 | 1.58 | 0.93 | |
| 230 | 1.75 | 1.57 | 0.9 | |
| 240 | 1.65 | 1.62 | 0.98 | |
| 250 | 1.75 | 1.66 | 0.95 | |
| Combination beam with 2.8 million cyclic loads | 250 | 2.40 | 1.97 | 0.82 |
| 251 | 2.38 | 2.05 | 0.86 | |
| 255 | 2.35 | 2.02 | 0.86 | |
| 260 | 2.42 | 2.15 | 0.89 | |
| 270 | 2.38 | 1.99 | 0.84 | |
| 280 | 2.31 | 2.09 | 0.9 | |
| Combination beam with 3.1 million cyclic loads | 280 | 3.20 | 2.77 | 0.87 |
| 281 | 3.15 | 2.65 | 0.84 | |
| 285 | 3.25 | 2.70 | 0.83 | |
| 290 | 3.25 | 2.73 | 0.84 | |
| 300 | 3.30 | 2.80 | 0.85 | |
| 310 | 3.10 | 2.60 | 0.84 | |
| Statistical result | Mean | 0.89 | ||
| SD (%) | 4.86% | |||
4. Conclusion
- (1)
The slip test results of test beam under the overlimit static load show that the load-slip curve of the static load before and after the overlimit fatigue load is applied for 10,000 times shows a trend of linear growth first and then slows down. When the ultimate load is reached, the maximum slip values of the two are 0.024 mm and 0.038 mm, respectively, and the maximum slip value of the static load after the overlimit fatigue load is applied for 10,000 times is increased by 58.3% compared with that before the overlimit fatigue load is applied
- (2)
The slip test results of test beam under variable amplitude cyclic loading show that when the fatigue cycle is 0-2 million times, the total slip and the residual slip percentage first decrease, then increase, and then decrease. The residual slip increases with the increase of the number of fatigue loading, with the total slip amount between 0.019 and 0.026 mm and the residual slip percentage between 4.17 and 8.33%. When the loading times are 500,000, the residual slip percentage reaches the maximum value (8.33%).
- (3)
The test results under overload variable amplitude fatigue loads show that the maximum residual values are 0.022 mm (the maximum residual slip percentage was 7.14%), 0.027 mm (the maximum residual slip percentage was 7.40%), and 0.028 mm (the maximum residual slip percentage was 7.14%) after 1.5 times, 2 times, and 3 times of overload and variable amplitude fatigue loads, respectively, and the slip values have no obvious fluctuation, all of which show good working performance
- (4)
Fully considering the factors of shear stiffness and fatigue cycles, the deformation calculation model of the test beam is deduced. The average value of the ratio between the deformation value and the measured value of composite beams is 0.89, and the standard deviation is 4.86%. The error between the calculation results and the measured results is less than 5%, with high accuracy
Conflicts of Interest
The authors declare no competing interests.
Acknowledgments
This research was supported by the National Natural Science Foundation of China Youth Science Foundation Project (No. 52008066), Science and Technology Projects in TAR (XZ202001ZY0054G), State Key Laboratory of Mountain Bridge and Tunnel Engineering (No. SKLBT-2110), Research Project of education and teaching reform in Chongqing Jiaotong University, and the application of basic research projects of the Ministry of Communications (No. 2013 319814 040).
Open Research
Data Availability
The labeled dataset used to support the findings of this study is available from the corresponding author upon request.


