Effects of Variable Proportions of Concrete Fragments on Urban Soil Moisture Transport: An Experimental and Simulation Study
Abstract
In order to investigate the effects of typical anthropogenic concrete fragments on moisture infiltration and evaporation in urban soils, the effects of typical anthropogenic concrete fragments on wetting peak transport distance, cumulative infiltration, cumulative evaporation, evaporation rate, and soil profile moisture at four levels (0, 5%, 10%, and 20%) were investigated by indoor soil column experiments. The results showed that the presence of concrete fragments promoted the wetting peak transport distance and cumulative infiltration, and the promotion effect increased gradually with the increase of the ratio, but there was a threshold value, and the promotion effect was least when the ratio was 20%. When the evaporation period was 35 d, concrete fragment treatment can increase the cumulative evaporation and promote the evaporation of urban soil moisture; the promotion effect increases with the increase of the proportion, but there is a threshold value; when the proportion is 20%, the promotion effect is the smallest. The evaporation rate was consistent with the different stages of evaporation process during evaporation. The concrete fragment treatment reduced the time required for moisture to reach the same depth during infiltration; the moisture coefficient of variation of the concrete fragment treatment during evaporation showed a trend of decreasing, then increasing, and then decreasing, which increased the uncertainty of moisture in the evaporation process. The model simulation results show that the models such as the power function, Kostiakov model, and Rose model fit well, and the coefficient of determination R2 is greater than 0.99, among which the Kostiakov model fits best. The research results can provide a theoretical scientific basis for building an efficient ecological city.
1. Introduction
Urban soils are urban or suburban soils with a thickness greater than 50 cm due to mixing, landfilling, or contamination of soils under anthropogenic nonagricultural action [1]. In the process of urbanization, influenced and disturbed by human activities, urban soil is artificially excavated, carried, and mixed; a large amount of construction waste and domestic waste and other artificially invaded bodies are mixed in irregularly, directly damaging the urban soil structure and leading to a high degree of spatial heterogeneity in urban soil [2–4]. Once mechanically crushed and artificially trampled, it causes soil compaction, increases soil bulk, reduces soil pore ratio, and deteriorates aeration, which in turn affects moisture infiltration [5, 6]. At present, there are more studies on soil moisture infiltration experiments at home and abroad, and many scholars have studied the infiltration process of soil containing gravel by taking soil-stone mixed media as the research object, and a large number of research results have been obtained. For example, Zhou and Shao [7] found that within a certain infiltration calendar, the cumulative infiltration volume and the transport of wetting peaks showed a decreasing trend with the increase of gravel content and the increase of diameter. Wu et al. [8] found that the stable infiltration rate significantly decreased with increasing gravel content under the same particle size gravel; compared to the Philip model, the Kostiakov model could better fit the variation of infiltration rate with time. Zhang et al. [9] found by horizontal infiltration experiments that the infiltration rate and infiltration coefficient k values showed a trend of increasing and then decreasing with the increase of gravel and reached the maximum value when the gravel content was 10%. Valentin and Casenave [10] found that the infiltration rate of gravel-containing soils increased with the size of the gravel, but a threshold value existed. Abrahams and Parsons [11] concluded that there is a positive correlation between infiltration and gravel content for plots not disturbed with mechanical tools and a negative correlation between infiltration and gravel content for disturbed plots. Grant and Struchtemeyer [12] pointed out by indoor runoff tests that removing gravel from the soil reduces the pore space in the soil, and infiltration performance is reduced. Previous work has focused more on the effect of natural debris such as gravel and rocks mixed into soil on moisture infiltration, focusing more on soils in agricultural fields, woodlands, and district hills; little research has been done on the effect of typical anthropogenic intrusions such as concrete fragments mixed into urban soils on moisture infiltration processes.
Soil evaporation occupies the predominant proportion for total water loss from soil and causes a serious waste of water resources. As an important part of the moisture cycle in urban ecosystems, urban soil evaporation occupies an important position in maintaining the moisture balance and energy balance of urban soils [13]. Studying the effects of typical anthropogenic intrusions such as concrete fragments on urban soil moisture evaporation can help improve the utilization of water resources and has important and far-reaching significance for the protection of ecological environment. At the present stage, many scholars have taken gravel and biochar as the research objects to study the effects of the above substances on soil moisture evaporation in depth. Coppola et al. [14] found that the presence of gravels reduces soil evaporation, mainly because they reduce the moisture retention capacity and promote the infiltration of deep moisture. Liu et al. [15] found that gravel in soil has a facilitating effect on soil moisture evaporation, but this facilitating effect is limited, and the effect of gravel on soil evaporation decreases with the extension of evaporation ephemeris and the increase of cumulative evaporation. van Wesemael et al. [16] showed that under certain rainfall conditions, soil moisture will be at a high level, and gravel in soil will form large pores with soil pore space, which changes the coherence of moisture flow in the soil and facilitates the evaporation of soil moisture. Pan et al. [17] found that embedded rock fragments increase evaporation of soil moisture, which is essentially due to the fact that the thermal conductivity of rock fragments is greater than that of soil, leading to an increase in soil temperature. Ibrahim et al. [18] applied conocarpus biochar in sandy loam soil and found that the cumulative evapotranspiration of biochar treated soil (32.2-35.5 mm) was lower than that of untreated soil (40.9 mm). Wang et al. [19] found that the addition of biochar could increase the soil moisture content, which increased from 38.0% to 41.2% with the addition of biochar from 10 g/kg to 150 g/kg under the treatment with particle size of 1-2 mm. The above studies show that admixtures such as gravel and biochar present in the soil can affect the soil moisture evaporation process by changing the pore structure of the soil, while studies on the effect of typical anthropogenic intrusions such as concrete fragments on the urban soil moisture evaporation process have always been extremely rare.
The current research on soil moisture transport mechanism is mostly focused on gravel, biochar, and other research objects, and the direction of research is also focused on agricultural land, forest land, district hills, and other types of soils. The research on the moisture transport process of urban soils by typical anthropogenic intruders such as concrete fragments is relatively rare, and the infiltration experiment process is more often considered unilaterally, lacking a comprehensive study of both infiltration and evaporation [20]. Therefore, it is important to strengthen the study on the effect of concrete fragments with different ratios on urban soil moisture transport process and its simulation. In this paper, we conducted an indoor soil column experiment to simulate the effect of concrete fragments with different ratios on urban soil moisture transport, combined with the results of field survey to simulate the real urban soil environment and explore the mechanism of the effect of concrete fragments and other anthropogenic intruders on urban soil moisture infiltration and evaporation characteristics, in order to provide a scientific basis for the construction of ecological cities.
2. Materials and Methods
2.1. Experimental Design
This experiment was conducted from September to December 2021. The experiment soil was collected from Wolong District, Nanyang City, Henan Province, China, and the soil was analyzed for soil particle size using a laser particle size analyzer (Mastersize 2000, Malvern, UK), and the results are shown in Table 1. The soil was sampled at a depth of 0-50 cm, and the soil samples were removed from large-size impurities such as man-made intruders and dead leaves of the root system, then naturally dried, milled, and sieved through a 2 mm sieve. The average initial mass moisture content of the sampled soil was 3.2%, and the main physical properties of the concrete fragments are shown in Table 2. The concrete fragments used in the experiment were collected from construction sites, crushed with a geological hammer, and screened for 3 ~ 4 cm particle size. Before the experiment, it was found through research that the concrete fragments in urban soil were concentrated in the soil depth of 20-30 cm, and a small amount existed in the soil layer of 15-20 cm and 20-25 cm. Therefore, this study combined with the actual soil conditions, the typical anthropogenic invasive body-concrete fragments as the research object, set four ratios (0, 5%, 10%, 20%), see Table 3 for details.
| Diameter | <0.002 | 0.002 ~ <0.05 | 0.05~ 2 |
|---|---|---|---|
| Soil texture | Viscous particles | Powder particles | Sand grain |
| Mass fraction/% | 7.60 | 53.38 | 39.02 |
| Type | Saturated moisture absorption rate/% | Porosity/% | Average density/g·cm3 | Shape |
|---|---|---|---|---|
| Concrete fragments | 6.46 | 13.58 | 2.23 | Irregular block |
| Soil depth/cm | Treatment | ||||
|---|---|---|---|---|---|
| T0 | T1 | T2 | T3 | ||
| 0 ~ 15 | 0% | 0% | 0% | 0% | |
| 15~ 35 | 15~ 20 | 0% | 5% × 40% | 10% × 40% | 20% × 40% |
| 20~ 25 | 5% | 10% | 20% | ||
| 25~ 30 | 5% | 10% | 20% | ||
| 30~ 35 | 5% × 40% | 10% × 40% | 20% × 40% | ||
| 35~ 50 | 0% | 0% | 0% | 0% | |
2.2. Experimental Device
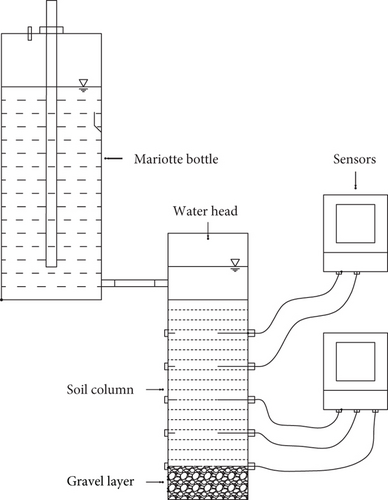
The soil moisture infiltration and evaporation experimental device are shown in Figure 1. The infiltration experimental device consists of three parts: soil column, marsupial, and movable base. The soil column is made of 5 mm thick Plexiglas material with an inner diameter of 20 cm and a height of 70 cm. Scale strips are attached parallel to the four directions of the soil column to observe the position of the wetting peak in centimeters with an accuracy of millimeters. Holes were made at 20, 30, 40, 50, and 60 cm of the soil column to insert soil moisture temperature sensors. The bottom of the soil column is equipped with a valve of 8 mm diameter, which aims to provide a smooth airflow environment for the infiltration experiment and avoid cyclone phenomenon during the experiment. The marsupial has an inner diameter of 20 cm and a height of 100 cm and is equipped with a valve at the bottom end, which is connected to the soil column through a plastic hose to provide a constant water head for the experiment. The moving base of the soil column is made of stainless steel with a height of 15 cm, which is easy to move and carry the column. The evaporation experimental device is mainly composed of soil column, evaporation dish, and electronic scale. The evaporation dish has an inner diameter of 20 cm and a height of 30 cm. Electronic scale range is 50 kg, and precision is 1 g.
2.3. Experimental Process
2.3.1. Infiltration Experiment Process
Before filling the soil, Vaseline was evenly applied to the inner wall of the soil column in order to weaken the influence of dominant flow at the wall. The bottom of the soil column was filled with gravel of 10 cm height as a counter-infiltration layer, and gauze (1 layer) and filter paper (1 layer) were laid flat on the gravel counter-infiltration layer in turn to avoid fine soil particles from entering the counter-infiltration layer. When filling the soil column, the depth of soil filling is 50 cm, and the thickness of soil filling is 5 cm each time, and the soil capacity is 1.4 g/cm3, and the mass of soil filling is 2198 g per 5 cm. Only pure soil is filled at 2 cm above and below the location of soil moisture temperature sensors. The concrete fragments are mixed with soil evenly and filled according to the ratio set in the experiment. To avoid abrupt changes in structural and hydrodynamic characteristics between soil layers, interlayer brushing was required.
The infiltration experiment was carried out by the one-dimensional vertical head infiltration method. In order to reduce the atmospheric evaporation from the surface soil, the windows and other ventilation openings in the laboratory were closed and shaded during the experiment. After the start of infiltration, the soil column wetting peak transport was observed according to the principle of dense before and after infiltration, and the stopwatch was timed to observe every 1 min from 0 to 10 min, 4 min at each interval from 10 to 30 min, 6 min at each interval from 30 to 60 min, 10 min at each interval from 60 to 120 min, and 15 min at each interval from 120 to 180 min. At the same time, the readings of the marsupial were recorded, and the wetting peak and the accumulated infiltration amount were taken as the average of the readings in four directions. During the infiltration process, the sensor was set to automatically record the soil volume moisture content every 30 s, and the recording time was 240 min. When the observed wetting peak transported to 45 cm, the water supply was stopped, and the waterproof plastic film was used to seal the soil column, and the infiltration was finished.
2.3.2. Evaporation Experiment Process
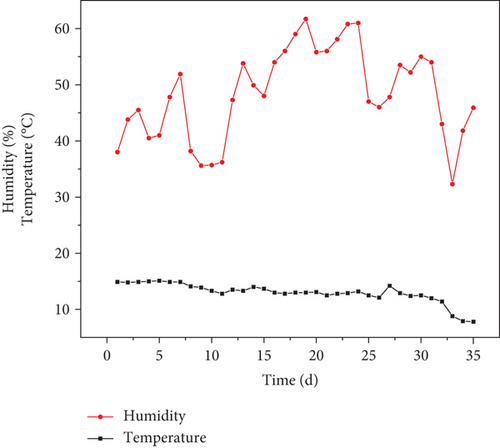
In the above expression, W is the soil moisture evaporation, mm; ∆M is the mass difference of the soil column for a given time interval, g; ρ is the moisture density, 1 g/cm3; A is the cross-sectional area of the soil column, cm2; k is the unit conversion factor, k = 10 mm/cm; i is the soil moisture evaporation rate, mm/d; and ∆t is the time interval, d.
2.4. Model Fitting
where Fz is the wetting peak transport distance, cm; t is the time, min; a is numerically equal to the first timing of the wetting peak transport distance; and b characterizes the degree of decay of the wetting peak transport speed.
where I is the cumulative infiltration of soil moisture, mm; t is the infiltration time of soil moisture, min; and k and β are experimental simulation parameters with no actual physical significance.
where E is the cumulative evaporation of soil moisture, mm; te is the number of days of soil moisture evaporation, d; c is the moisture diffusion parameter; and d is the stable evaporation parameter.
2.5. Evaluation Indicators
where n is the number of measured and simulated values, Si is the simulated value, Me is the measured value, and is the average value of Me.
A smaller RRMSE value indicates a better fit of the model, and a closer NS value to 1 indicates a more efficient simulation of the model.
2.6. Data Processing and Analysis
The experimental data in this paper were all averaged from three replicates, plotted, and function-fitted with the Origin 2021 software; the device schematic was drawn with the AutoCAD 2019 software, and Excel was used for data processing and analysis.
3. Results and Analysis
3.1. Effect of Different Proportions of Concrete Fragments on the Infiltration Characteristics of Urban Soil
3.1.1. Effect of Different Proportions of Concrete Fragments on the Transport of Wetting Peaks
Figure 3 shows the variation of the wetting peak transport distance with the infiltration time for different ratios of concrete fragments. With the extension of infiltration time, the wetting peak transport distance of different ratios of concrete fragments increased continuously, and the wetting peak curve gradually transitioned from relatively steep at the beginning of infiltration to flat. At the early stage of infiltration, the wetting peaks of different ratios of concrete fragments were basically the same, and the wetting peaks of each treatment basically overlapped. With the process of infiltration, the time required for the wetting peaks of each treatment to move to the same depth was from small to large: T2 < T1 < T3 < T0, and this difference gradually increased until the end of infiltration. From the results of each treatment, the different ratios of concrete fragments treatment had a significant effect on the wetting peak transport of urban soil. The time required to transport the wetting peak to the same depth of h = 45 cm was 180 min (T0), 150 min (T1), 130 min (T2), and 165 min (T3) for each treatment, and the time required to reach the same depth was 16.67% (T1), 27.78% (T2), and 8.33% (T3) lower for the concrete fragment treatment than the control treatment (T0), respectively.
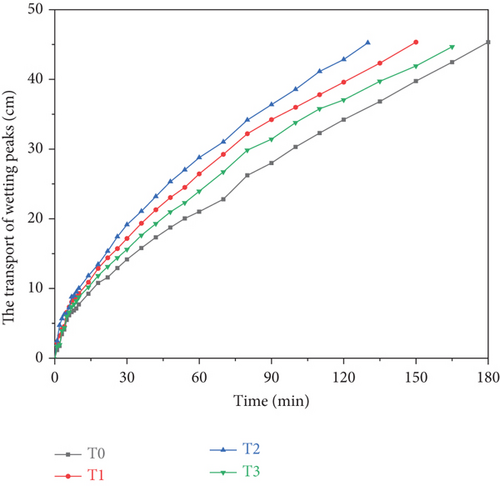
The data indicate that the different proportion of concrete fragment treatment has a facilitating effect on the wetting peak transport of urban soil. The promotion effect gradually increased with the increase of the proportion, but there was a threshold value; when the proportion was 20%, its promotion effect on urban soil wetting peak transport was less than that of the proportion 5% treatment, that is, T2 > T1 > T3.
The relationship between the wetting peak transport distance FZ (cm) and the infiltration time t (min) for different ratios of concrete fragment treatment conforms to the power function relationship FZ = atb, and the fitting results are shown in Table 4.
| Treatment | a | b | R2 | RRMSE | NS |
|---|---|---|---|---|---|
| T0 | 1.6286 | 0.6362 | 0.9976 | 0.0343 | 0.9977 |
| T1 | 2.3497 | 0.5913 | 0.9991 | 0.0199 | 0.9991 |
| T2 | 2.5995 | 0.5862 | 0.9992 | 0.0175 | 0.9993 |
| T3 | 2.0658 | 0.6030 | 0.9986 | 0.0253 | 0.9986 |
As can be seen from Table 4, the fitted coefficient of determination R2 for each concrete fragment’s treatment condition is greater than 0.99 and T2 > T1 > T3 > T0, indicating that the power function equation Fz = atb can better describe the variation law of wetting peak transport distance with infiltration time for different ratios of concrete fragment treatment. With the increase of the proportion, the variation law of parameter a is T2 > T1 > T3 > T0, and parameter b shows the variation law of T2 < T1 < T3 < T0, which indicates that the decay degree of the wetting peak transport curve of different proportion of concrete fragment treatment gradually increases, and the decay law changes to T2 > T1 > T3 > T0. The variation law of RRMSE from small to large is T2 < T1 < T3 < T0, which indicates that the systematic error of the power function model simulation gradually increases and the fitting effect of the model decreases. NS shows a change of T2 > T1 > T3 > T0 and gradually approaches to 1, which indicates that the fitting efficiency of the model simulation increases.
3.1.2. Effect of Different Proportions of Concrete Fragments on the Cumulative Infiltration Volume
Figure 4 reflects the cumulative infiltration process of soil under different ratios of concrete fragments. It can be seen from Figure 4 that the cumulative infiltration rate of urban soil treated with different ratios of concrete fragments increases with time, and the curve of cumulative infiltration rate gradually slows down from steep at the beginning of infiltration, and different ratios of concrete fragments have obvious effects on the cumulative infiltration rate. At 120 min, the cumulative infiltration rate of different ratios of concrete fragments was basically stable at 120 min, and the cumulative infiltration volume at that time was chosen to measure the infiltration capacity of the soil before stable infiltration. The cumulative infiltration volume of the treatment increased by 19.66% (T1), 29.06% (T2), and 13.68% (T3) compared to the control treatment (T0). Further analysis of Figure 3 shows that the cumulative infiltration volume of different ratios of concrete fragment treatment in the same infiltration calendar time from the beginning to the end of infiltration was T2 > T1 > T3 > T0.
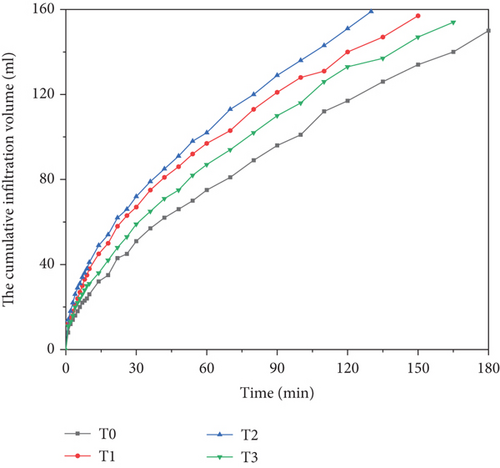
The data indicate that the infiltration capacity of urban soils was enhanced to some extent by different proportions of concrete fragment treatment. With the increase of the proportion, the enhancement of the infiltration capacity of each treatment gradually increased, but like the promotion of the wetting peak transport distance, there is a threshold value; when the proportion is 20%, its enhancement of the infiltration capacity of urban soil is the smallest, that is, T2 > T1 > T3.
The cumulative infiltration volume I (mm) and infiltration time t (min) between the concrete fragment treatment with different ratios fit the Kostiakov infiltration model, and the fitting results are shown in Table 5.
| Treatment | k | β | R2 | RRMSE | NS |
|---|---|---|---|---|---|
| T0 | 6.4002 | 0.6052 | 0.9988 | 0.0230 | 0.9989 |
| T1 | 10.9456 | 0.5317 | 0.9993 | 0.0161 | 0.9993 |
| T2 | 11.9468 | 0.5285 | 0.9995 | 0.0137 | 0.9995 |
| T3 | 8.3511 | 0.5725 | 0.9991 | 0.0194 | 0.9991 |
As can be seen from Table 5, the coefficient of determination R2 fitted under each concrete fragment’s treatment condition is greater than 0.99. The results indicate that the Kostiakov model has a better simulation of the cumulative infiltration amount in the process of soil moisture infiltration. With the increase of the ratio, the parameter k showed the variation law of T2 > T1 > T3 > T0, and the variation law of the parameter β was T2 < T1 < T3 < T0, which was basically consistent with the variation law of the parameters a and b of the fitting results of the wetting peak transport distance and infiltration time. The RRMSE gradually increases with the increase of the ration, which shows that T2 < T1 < T3 < T0, where the T2 treatment. The simulation error of the Kostiakov model for T2 treatment is the smallest, and the simulation effect was the best. The NS value of each treatment decreases with the increase of the proportion and gradually moves away from 1, which is T2 > T1 > T3 > T0, among which the Kostiakov model simulation of T0 treatment has the lowest fitting efficiency.
3.2. Effect of Different Proportions of Concrete Fragments on Evaporation Characteristics of Urban Soils
3.2.1. Effect of Different Proportions of Concrete Fragments on the Cumulative Evaporation Volume
Figure 5 shows the cumulative evaporation curves under different ratios of concrete fragment treatment during the evaporation experiment. From Figure 5, it can be seen that the cumulative evaporation gradually increased with the increase in the proportion of concrete debris during the experiment. At the end of the evaporation experiment, the cumulative evaporation increased by 4.65% (T1), 6.20% (T2), and 1.72% (T3) for the concrete fragment treatment compared with the control treatment (T0). At the early stage of the experiment (0-10 d), the cumulative evaporation of each treatment was relatively close to each other with no obvious pattern. Among them, the accumulated evapotranspiration was the largest in T1 treatment and the smallest in T3 treatment. In the middle of the experiment (11~ 24 d), evaporation entered the transition period, and the differences between T0 and T3 and T1 and T2 treatments decreased, and the corresponding curves gradually approached, and the differences between these two groups gradually increased with evaporation calendar time until the end of the experiment. At the later stage of the experiment (25~ 35 d), with the evaporation process, the cumulative evaporation curves of different proportions of concrete fragment treatments gradually showed certain differences, from large to small as T2 > T1 > T3 > T0, and the differences between the treatments gradually increased. In summary, the presence of concrete debris can increase the cumulative evaporation of urban soil when the evaporation period is longer, and to a certain extent, it can promote the evaporation of urban soil, but this promotion effect is limited by the ratio, and the cumulative evaporation of higher ratio treatment (T3) is smaller.
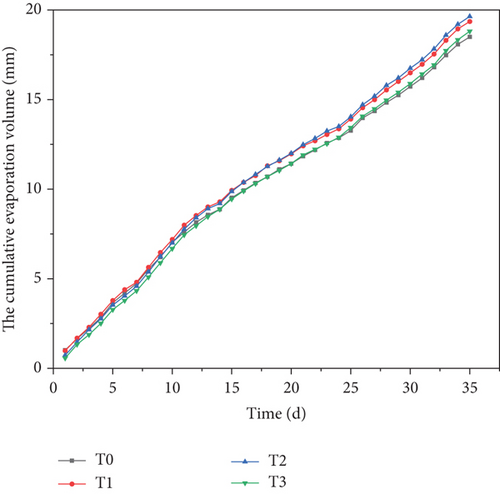
The accumulated evaporation volume E (mm) and evaporation time te (d) for different ratios of concrete fragment treatment conditions can be fitted between the Rose evaporation model, and the fitting results are shown in Table 6.
| Treatment | c | d | R2 | RRMSE | NS |
|---|---|---|---|---|---|
| T0 | 0.9696 | 0.3548 | 0.9956 | 0.0314 | 0.9957 |
| T1 | 0.9837 | 0.3769 | 0.9953 | 0.0328 | 0.9954 |
| T2 | 0.7930 | 0.4201 | 0.9954 | 0.0334 | 0.9955 |
| T3 | 0.7226 | 0.4069 | 0.9945 | 0.0368 | 0.9947 |
As can be seen from Table 6, the fitted coefficient of determination R2 for each concrete fragment’s treatment condition is greater than 0.99, indicating that the Rose model has a good simulation of the evaporation process of urban soil under different ratios of concrete fragment treatment conditions. The parameters c and d did not show a significant pattern with increasing proportion. The RRMSE of each treatment gradually increased with the increase of proportioning and was at a high level; among them, the RRMSE value corresponding to the T0 treatment was the smallest, and the error was the smallest. The NS value decreased with the increase of proportioning and showed that T2 > T1 > T3 > T0; among them, the NS value corresponding to the T2 treatment was the largest; that is, the Rose model simulation of the T2 treatment had the highest fitting efficiency.
3.2.2. Effect of Different Proportions of Concrete Fragments on Evaporation Rate
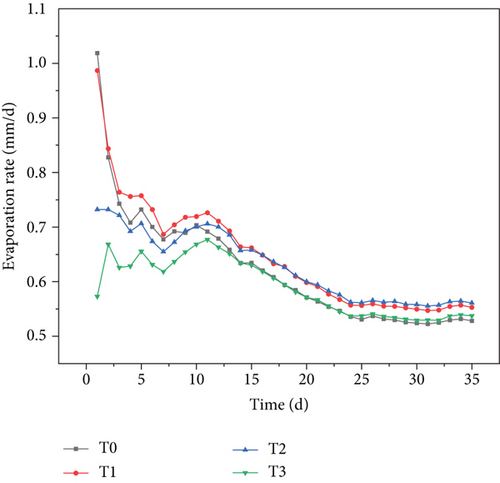
Figure 6 shows the changes of evaporation rate of urban soil moisture during evaporation experiment for different ratios of concrete fragment treatment. From Figure 6, it can be seen that the soil moisture evaporation rate transitioned from the fluctuating change in the early stage to the deceleration rate stage and finally tended to a stable state; this is more consistent with the three stages of change law of constant evaporation, evaporation decay, and evaporation stagnation of the soil evaporation process. At the early stage of the experiment (0 ~ 10 d), the temperature and humidity environment around the soil column dominated, and after the end of infiltration, the higher level of soil volumetric moisture content provided sufficient moisture and diffused to the air, and the evaporation rate was in a fluctuating undulating state with large evaporation rate. In the middle of the experiment (11~ 24 d), as the moisture in the soil is continuously consumed by evaporation, the volumetric moisture content of the soil gradually decreases, and it is necessary to obtain the moisture required for evaporation from the deeper soil, and the influence of the concrete fragments in the soil begins to present, at which time the evaporation rate gradually decreases with the evaporation calendar, and evaporation enters the decay process. Later in the experiment (25~ 35 d), as evaporation proceeds, the surface of the soil becomes very dry, and the moisture available in the soil for evaporation becomes less and less, and the evaporation process transitions from the decay stage to the stagnation stage, when the actual evaporation is small, and the evaporation rate is in a stable state with low evaporation rate. The evaporation rate change process in the late stage of the experiment indicates to a certain extent that the evaporation rate promotion effect of concrete fragments on urban soil is limited. The average evaporation rates for different ratios of concrete crushed block treatments at the later stage of the experiment were 0.5288 mm/d (T0), 0.5534 mm/d (T1), 0.5611 mm/d (T2), and 0.5348 mm/d (T3), respectively, with lower evaporation rates, indicating that the effect of concrete crushed block on evaporation from urban soils is less when the evaporation epoch is longer or the cumulative evaporation is larger.
3.3. Effect of Different Ratios of Crushed Concrete on Moisture in Urban Soil Profiles
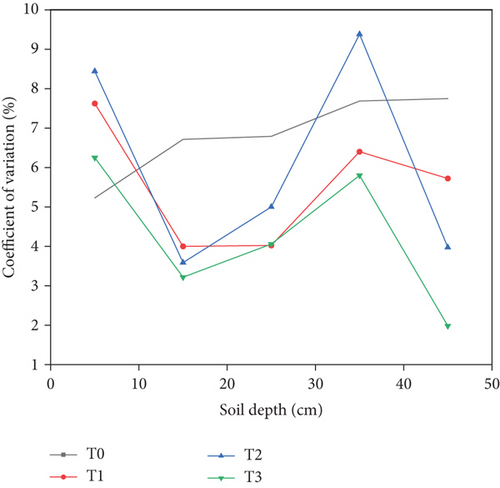
The infiltration and evaporation characteristics of urban soil moisture changed significantly under different ratios of concrete fragment treatment conditions, and the urban soil moisture distribution under each treatment also showed significant differences as a result. Figures 7–11 reflect the variation curves of volumetric moisture content of soil at different depths with infiltration time during the infiltration experiment. Figure 12 reflects the variation process of the coefficient of variation corresponding to different depths of soil with soil depth during the evaporation experiment.
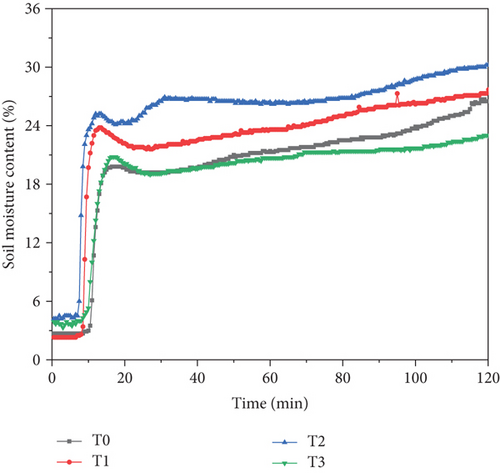
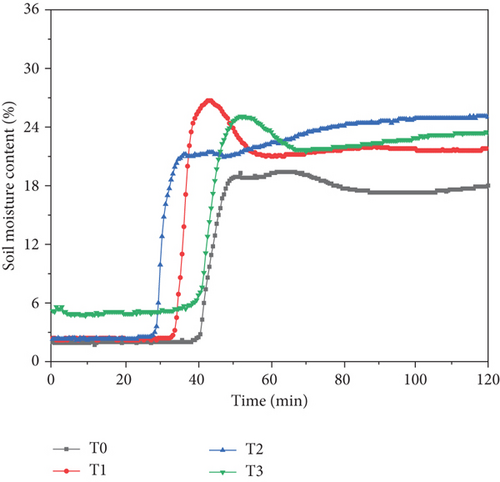
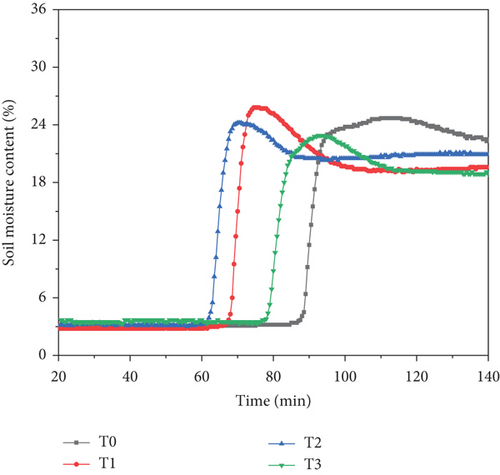
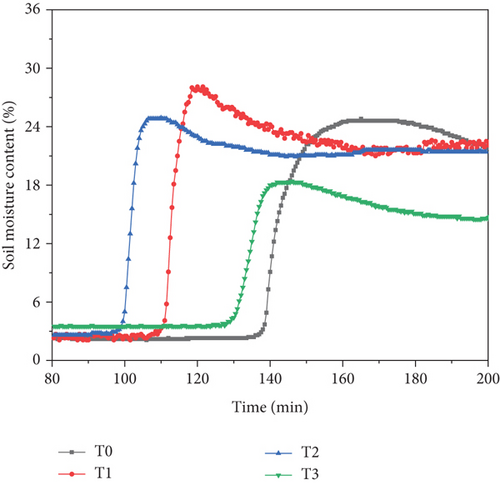
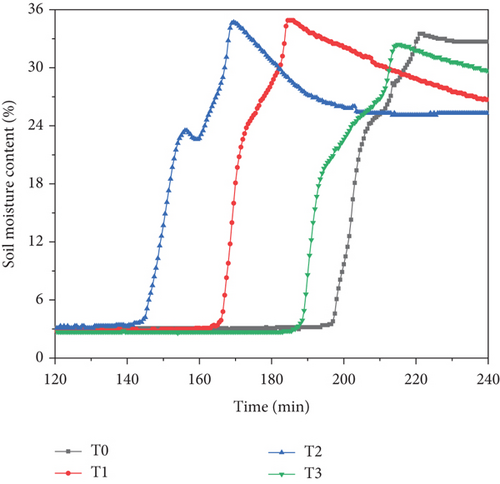
From Figures 7–11, it can be seen that with the increase of infiltration time, the volumetric moisture content of each layer in each treatment column showed a sudden increase followed by a steady trend from top to bottom. The moment of the sudden increase is basically the same as the moment of the wetting peak. Further analysis showed that the time required for the volumetric moisture content to reach the same depth of the soil to show a sudden increase followed by a steady change was different for the treatments with different proportions of concrete fragments, which were T2 < T1 < T3 < T0, and the difference increased with the increase of infiltration time. In other words, the infiltration time of moisture reaching the same depth of soil was different among treatments, from fast to slow, as T2, T1, T3, and T0, and the difference between treatments gradually became larger as infiltration proceeded. The above phenomenon, to a certain extent, reflects that the moisture infiltration of urban soil is promoted by different ratios of concrete fragment treatment, which is basically consistent with the effect of different ratios of concrete fragment treatment on the transport of wetting peak and cumulative infiltration of urban soil as described above.
Table 7 shows the coefficients of variation of soil moisture at different depths during evaporation. From the table, it can be seen that the mean volumetric moisture content of urban soils with different ratios of concrete fragment treatment did not vary significantly with soil depth during the evaporation experiment. The maximum mean moisture content of all treatments was at the soil depth of 40-50 cm, with the maximum mean moisture content in treatment T3 and the minimum in treatment T1. The coefficient of variation reflects the degree of dispersion of volumetric moisture content, with CV ≤ 10% being weak variation, 10% < CV < 100% being moderate variation, and CV ≥ 100% being strong variation [24]. The coefficient of variation (CV) of the moisture content at each soil depth for the different ratios of concrete fragment treatments was less than 10%, which is weak variation. The variation of the coefficient of variation with soil depth was different for each treatment; the coefficient of variation of the control treatment increased with increasing soil depth, while the coefficient of variation of the concrete fragment treatment showed a decrease, then an increase, and then a decrease with increasing soil depth, and the variation process is shown in Table 7. The variation of the coefficient of variation with soil depth for the T1, T2, and T3 treatments indicates to some extent that the presence of concrete fragments changed the variability of the vertical distribution of urban soil moisture. The variability of the vertical distribution of soil moisture in T1, T2, and T3 treatments with soil depth indicates to some extent that the presence of concrete fragments changes the variability of the vertical distribution of soil moisture in the city.
| Treatment | Soil depth/cm | Mean/% | Standard deviation/% | Maximum value/% | Minimal value/% | Coefficient of variation/% |
|---|---|---|---|---|---|---|
| T0 | 0 ~ 10 | 14.87 | 0.78 | 17.60 | 13.10 | 5.23% |
| 10~ 20 | 14.96 | 1.00 | 17.60 | 13.30 | 6.71% | |
| 20~ 30 | 19.23 | 1.31 | 21.40 | 16.60 | 6.79% | |
| 30~ 40 | 17.35 | 1.33 | 20.90 | 15.20 | 7.69% | |
| 40~ 50 | 26.83 | 2.08 | 30.00 | 22.40 | 7.75% | |
| T1 | 0 ~ 10 | 11.06 | 0.84 | 13.40 | 9.50 | 7.62% |
| 10~ 20 | 15.65 | 0.63 | 16.80 | 14.20 | 4.00% | |
| 20~ 30 | 18.04 | 0.73 | 19.70 | 16.20 | 4.02% | |
| 30~ 40 | 20.98 | 1.34 | 24.00 | 17.90 | 6.40% | |
| 40~ 50 | 25.74 | 1.47 | 27.40 | 21.70 | 5.72% | |
| T2 | 0 ~ 10 | 16.70 | 1.41 | 19.80 | 13.80 | 8.44% |
| 10~ 20 | 15.82 | 0.57 | 17.50 | 14.30 | 3.59% | |
| 20~ 30 | 17.78 | 0.89 | 19.40 | 15.70 | 5.00% | |
| 30~ 40 | 19.09 | 1.79 | 23.10 | 16.50 | 9.38% | |
| 40~ 50 | 26.84 | 1.07 | 28.50 | 24.70 | 3.98% | |
| T3 | 0 ~ 10 | 10.13 | 0.63 | 11.80 | 9.00 | 6.25% |
| 10~ 20 | 17.29 | 0.56 | 18.30 | 15.60 | 3.22% | |
| 20~ 30 | 17.30 | 0.70 | 19.10 | 15.40 | 4.06% | |
| 30~ 40 | 15.75 | 0.91 | 18.70 | 13.40 | 5.80% | |
| 40~ 50 | 28.09 | 0.56 | 29.00 | 26.20 | 1.98% |
4. Discussion
The presence of rock fragments changes the physical properties of the soil such as porosity, bulkiness, and curvature, thus having a profound effect on the infiltration of soil moisture [25]. In this study, it was found that both the wetting peak curve and the cumulative infiltration curve of urban soil moisture infiltration process showed a trend of steep and then flat change. The main reason is that at the beginning of infiltration, the soil surface layer quickly enters into saturation, and the lower soil layer, which is at a lower initial moisture content, produces a large suction gradient with the saturated soil layer, which in turn accelerates moisture conduction and results in a larger infiltration rate, and as infiltration proceeds, the suction gradient gradually decreases, the infiltration rate decreases, and the infiltration curve transitions from steep at the beginning to smooth [9, 26]. Like gravel fragments, the presence of concrete fragments changes the physical properties of urban soils and affects urban soil moisture channels, which in turn has an impact on urban soil moisture infiltration processes. In this study, the presence of concrete fragments promoted urban soil moisture infiltration, and with the increase of the ratio, its contribution to the wetting peak transport distance and cumulative infiltration increased gradually, but there was a threshold value, and when the ratio was 20%, its contribution was lower than that of the 5% treatment, and the contribution effect was minimal. The main reason for this may be that with the increase of concrete fragments in urban soils, the number of macropores in the soil increases, and the effective pore space decreases instead, and the soil moisture channels become more complex. A sufficient number of macropores will produce a dominant flow phenomenon and promote moisture infiltration; at the same time, the decrease of effective pores and the increase of moisture curvature due to complex moisture channels will have a hindering effect on moisture infiltration. When the former effect is greater than the latter, it will promote moisture infiltration, and vice versa, it will hinder moisture infiltration [27]. The results of this experiment show that the promoting effect of dominant flow dominates; it is worth mentioning that this promoting effect does not increase all the time with the increase of concrete fragment ratio, and there exists a threshold value; when the level of concrete fragment ratio is higher, the promoting effect is weakened, and this is the reason why the promoting effect of the ratio 20% concrete fragment treatment on the wetting peak transport and cumulative infiltration is the least.
In this study, it was found that the cumulative evaporation increased with the increase of concrete fragment ratio during the evaporation experiment, and the evaporation rate of urban soil was in accordance with the law of soil evaporation phase change. The reasons for this include, in addition to the change in soil texture by the concrete fragments, the effects arising from the difference in moisture content at different periods during the evaporation experiment. At the early stage of the experiment, due to the high moisture content of the surface soil, the pores are filled with free moisture, and the surface of the soil column can be approximated as the free moisture surface or evaporation surface, and the accumulated evaporation is basically the same during this period; at this time, the evaporation rate is only limited by the meteorological conditions and influenced by the temperature and humidity of the experiment, and the evaporation rate is in a fluctuating state. As evaporation continues, the moisture in the soil is gradually consumed, and after the moisture content decreases to a certain critical value, the soil changes from saturated to unsaturated state, and the suction force of the soil is rapidly increased by the small change in moisture content, resulting in a rapid decrease in the vapor pressure on the surface of the soil, a decrease in the moisture difference of the evaporation surface, a weakening of the ability to drive the upward migration of moisture, and a gradual transition of the evaporation rate to the decay stage [28]; the presence of the concrete fragments present in the urban soil starts to become the main factor, and the accumulated evaporation rate at this time also varies somewhat depending on the concrete fragment ratio. In this study, it was also found that the presence of concrete fragments increased the cumulative evaporation and promoted evaporation from urban soils when the evaporation period was long enough, but the effect of this promotion was limited by the ratio, and the evaporation rate was also at a low state. The reason for this is that at the later stage of the experiment, the surface of the soil becomes very dry, the soil can supply less and less moisture for evaporation, the evaporation of moisture gradually changes from liquid water-based to moisture vapor diffusion-based, evaporation enters a stagnant stage, the evaporation rate is basically in a stable state at a lower level, and the accumulated evaporation maintains the difference in the middle of the experiment under the influence of the concrete crushed block ratio until the end of the evaporation experiment [28]. In addition, concrete fragments have a porous structure and have certain pores themselves, and during the experiment, concrete fragments with pores served as a medium to connect the soil above and below the concrete fragments, which shortened the moisture channel to some extent. This is also one of the reasons to promote the evaporation of moisture from urban soil.
In this study, it was found that different ratios of concrete fragment treatment changed the profile moisture of urban soil during infiltration and evaporation. During infiltration, as the proportion of concrete fragments increased, it took less time for moisture to infiltrate to the same depth, increasing the rate of moisture infiltration, mainly due to the promotion of dominant flow, but when the proportion reached 20%, the promotion of dominant flow was significantly weakened. During evaporation, the coefficient of variation of moisture in the control treatment tended to increase with the increase in the ratio of concrete fragments, while the coefficients of variation in the other treatments showed a decrease, then an increase, and then a decrease, indicating that concrete fragments changed the vertical spatial variability of urban soil moisture during evaporation. This is because the presence of concrete fragments changed the original textural homogeneity of the urban soil, resulting in the deformation of the natural structure of the urban soil, the reduction of the volume of pores located between the agglomerates of soil particles, and the alteration of soil permeability, which increased the uncertainty of moisture movement in the urban soil containing concrete fragments treated with concrete fragments, and in this study, the moisture movement of the urban soil treated with concrete fragments was faster than that of the control treatment. In this study, the moisture movement of the urban soil treated with concrete chips was faster than that of the control treatment, and the moisture content of the soil layer where the concrete chips were located decreased instead, and the coefficient of variation decreased, then increased, and then decreased. In contrast, the urban soil in the control treatment was homogeneous in texture, and its moisture content increased with the depth of the urban soil, and its coefficient of variation showed an increasing trend.
As with natural gravel, moisture transport in urban soils containing concrete fragments is an extremely complex process. In this study, the effect of four ratios of concrete fragments on moisture transport in urban soils was initially investigated based on indoor soil column simulations. The moisture transport process of various anthropogenic intruders remaining in the urban soil is also affected by other factors such as plants and meteorology and is a complex multi-interface process. Therefore, it is necessary to conduct further experiments on anthropogenic intruders to investigate the moisture movement characteristics of urban soil under different types, ratios, and particle sizes of anthropogenic intruders and to elucidate the influence of anthropogenic intruders on urban soil moisture transport in depth.
5. Conclusions
The presence of concrete fragments all contributed to urban soil moisture infiltration. The promotion effect of concrete fragment treatment on wetting peak transport and cumulative infiltration was increased with increasing ratio, but there was a threshold value, and the promotion effect was minimized at 20% ratio.
The presence of concrete fragments can promote evaporation of urban soil moisture. When the evaporation period is long enough, the concrete fragment treatment can increase the accumulated evaporation and promote the evaporation of urban soil moisture to some extent; the promotion effect increases with the increase of the ratio, but there is a threshold value; when the ratio is 20%, the promotion effect is the smallest. The evaporation rate of urban soil during evaporation was in accordance with the soil moisture evaporation pattern at different stages.
The presence of concrete fragments affects the urban soil profile moisture and reduces the time required for moisture to reach the same depth during urban soil infiltration. During evaporation, the coefficient of variation of moisture in the concrete fragment’s treatment showed a variation pattern of decreasing, then increasing, and then decreasing, increasing the uncertainty of moisture transport in urban soils.
Conflicts of Interest
The authors declare no conflict of interest.
Acknowledgments
This research was financially supported by the Key Research and Development Project of Henan Province (Project No. 182102310838), the Doctoral Research of Nanyang Normal University (Project No. ZX2014083), the laboratory-based open project of Nanyang Normal University (Project No. SYKF2021073), and the industry-university cooperation collaborative education project of the Department of higher education of the Ministry of Education (Project No. 202101354024).
Open Research
Data Availability
The data presented in this study are available on request from the corresponding author.


