[Retracted] Modeling and Optimization Analysis of Ancient Building Construction Rule Components Based on Deep Learning
Abstract
Chinese culture is broad and profound, and successive dynasties have left many cultural treasures. Ancient architecture is a significant treasure, and it is also the core content of the inheritance of Chinese culture. Every Chinese ancient building has its own characteristics, and the creative components of each ancient building are an important part of ancient buildings. As a new learning mode of current scientific inquiry, the deep learning model includes high-level and high-stage cognitive processing ability and innovative thinking ability. Under the background of the above modeling and optimization analysis of ancient building construction rule components and the development of deep learning mode, this paper proposes the modeling and optimization analysis of ancient building construction rule components about deep studying. The results of the experiment are as follows: (1) about the concept of the deep learning technology model and the vacancy problems existing in the current situation of the design framework and optimization of ancient building construction rule components, the research direction of the experiment is determined, and through the investigation and analysis of the modeling and optimization of ancient building construction rule components based on the deep learning model, the technical guarantee is provided for the research of this paper; (2) the convolution neural network algorithm, inversion model algorithm, loss function algorithm, and optimization algorithm are used to calculate, evaluate, and analyze the research problems, and the investigation contents are identified and analyzed through experimental research. It can not only analyze the root of the research problems but also improve the specific modeling optimization problems of ancient buildings, to reduce the unnecessary loss of time and resources.
1. Introduction
In industrial process control, due to technical or economic constraints, it is difficult to test the accuracy of the control of a product problem and parameter variables. A new data transmitter is designed to measure product problems and control parameter variables, to provide effective and reliable process parameter evaluation and analysis. As a new deep neural network training strategy, deep learning has become a new data transmission driver method in deep study. In this study, we use the deep learning model to design the data driver and put the design model into the actual product manufacturing. The comparison of modeling results shows that compared with traditional methods, deep learning technology has the following advantages, the most suitable model architecture for software data testing. First, compared with the original data-driven model, the deep neural network has a complex multilayer structure, which can contain more abundant information and generate better representation ability [1]. It is found that a supervised learning problem based on speech separation uses the relationship between speech and speaker to estimate the background noise and uses different discriminant patterns to classify the training data. In the past decade, many supervised separation algorithms have been proposed. However, with the improvement of scientific and technological capabilities, there is a better demand for target mechanization for supervised speech separation. Especially recently, deep learning has been introduced into the field of supervised speech separation, which has greatly accelerated the research progress and improved separation performance. The recent research on supervised speech separation based on deep learning is summarized [2]. By adapting CNN for the optical camera to its microwave counterpart, namely, synthetic aperture radar, in order to improve the performance of the model, we design a dictionary learning algorithm based on multiscale analysis. After convolution and merging, the input SAR image is transformed into a series of characteristic images [3]. In order to improve the accuracy, we use a dynamic programming strategy to segment each category and then map each category to different networks for processing. In this framework, we use different types of age markers to encode the input face image and then use the migration learning strategy to realize the deep conversion of data. In addition, in order to characterize the relationship between the tags that make up the ordered sequence, a new loss function is defined in the age classification task training. The experiment was carried out on the population image of the widely used age estimation data set [4]. An automatic feature learning system is proposed to classify the severity of nuclear cataracts from slit lamp images. The method includes the following: one or more local filters are used to learn each hierarchical class, wherein at least one is composed of one or more lenses and one or more image patches; then a new classifier is trained in each segmentation region using gradient descent method (GLCM) and Gaussian mixture model. The classifier can be used to recognize multiple nuclear lesions produced by different categories. Using the above characteristics, support vector regression (SVR) was used to grade cataracts [5]. Compared with the achievements of China’s ancient advanced architectural technology, China is still relatively backward in ancient architectural information technology. On this basis, a prototype system of three-dimensional cultural relics information system based on b/s mode is proposed and implemented, and the main technologies and methods involved in the prototype system are introduced. Finally, some application examples are given. Practice has proved that the effect is good. This platform can not only provide tools for the establishment and management of ancient building information model base but also provide accurate information for ancient building restoration, ancient building research, and ancient building virtual reality system. This paper focuses on the management method of ancient building component information and the structure of information storage database under this platform [6]. The fracture load and displacement values that may be formed in reinforced concrete structures with different cantilever types are determined by artificial neural network modeling. The key parameters of columns and beams defined in the Turkish seismic code are analyzed by nonlinear static pushover analysis, and the bearing capacity curve, failure load, and displacement are obtained. According to the variation interval of the selected parameters, a total of 64 reinforced concrete buildings are analyzed. In addition, by using the same parameters of the same model type, the statistical package of the Social Sciences (SPSS) statistical program is used for regression analysis. Therefore, the separate equations of displacement and load values are obtained, and their R2 values are calculated. Through neural network modeling, the convergence rate of displacement value is 91.77%, and the convergence rate of load value is 90.61%. The relationship between calculated value and expected value is given [7]. Taking the ancient architectural culture of the Song Dynasty as a classic in the history of Chinese ancient architecture, a new method based on the original method was designed to form Chinese ancient architecture. The design concept of this method is to expand the regular component system of ancient buildings around the structural system and structural mode of the original ancient buildings, parameterize the components in the ancient buildings, and parameterize the elements of different modern architectural styles into the design system. In this design system pattern, it will actively generate a special file to automate the overall model of the component building. The creation of ancient buildings under the system mode retains the characteristics of traditional architectural elements and draws modern building environmental protection quality. In order to prove the feasibility of this system model, the virtual ancient building architecture model is built through specific creation rules [8]. Starting with the representative ancient buildings in Ningbo, the architectural style of ancient buildings is roughly described from the following four aspects. The first example is Baoguo temple, which has a unique structure built according to the terrain. Second, we take Tianyi Pavilion as an example to live in harmony with nature. Third, taking the old Bund architecture as an example, it introduces the western architectural culture and integrates the Chinese and Western styles. The fourth is to take the heavenly king palace as an example, which is characterized by exquisite craftsmanship and perfect and excellent artistic pursuit [9]. In the current innovative project research, researchers and architectural science and technology professionals investigated the relationship between ancient architecture and mathematics by exploring the application and expansion of numbers and geometric mathematics in the construction rules of Chinese ancient architecture. In the previous study of ancient buildings, we always hope to explain the formation of ancient buildings through the original structural rules. Now researchers try to integrate ancient architectural technology, ancient builders, and mathematical methods into an existing construction system. The research data shows that the creation theory and operation practice of ancient buildings are a whole, which cannot be divided into two parts, but cannot be divided into two parts, to complete the building system [10]. In the current particle swarm optimization (PSO) research, particles are regarded as a whole individual, and these studies are independent of the information of the dimension vector of each particle. This paper presents a visual modeling method to describe the behavior of particle dimension vector. Based on the analysis of visual modeling, the reasons for premature convergence and diversity loss of particle swarm optimization algorithm are explained, and a new improved algorithm is proposed to ensure the reasonable flight of the dimension component of each particle. At the same time, two parameters, particle distribution degree and particle dimension distance, are introduced into the algorithm to avoid premature convergence [11]. An innovative concept about the use of building modeling and optimization screening method is proposed, which forms a unique data set by selecting the corresponding data text from the overall area and some areas. Using appropriate screening methods to obtain the data needed by the target research, in order to achieve the optimal data acquisition and reduce the loss of time, the obtained data set is used to generate the model architecture through artificial intelligence network, and the optimal parameter set is obtained through CNN model. The results of the experimental project confirm the effectiveness of this method and the modeling formation and optimization design of ancient buildings can be better achieved around the design model [12]. A modeling model around energy price reduction is designed, which mainly includes data extraction and principal component analysis of the design model and the verification of modeling functionality by using neural network technology. In order to prove the feasibility of this method, data processing algorithm and problem analysis algorithm are used to analyze the problem. This design method may lack some actual data because of the failure of functional analysis. In order to effectively study the modeling space of energy price reduction, neural network processing is used for parametric construction [13]. Hakka Tulou is listed as a world cultural heritage by UNESCO. It is a wonderful flower of ancient Chinese architecture and has high architectural, cultural, and tourism value. The high-precision and realistic three-dimensional model of cultural heritage is very important for realizing the protection, preservation, dissemination, and inheritance of cultural heritage and promoting virtual cultural tourism. Hakka Earth buildings are characterized by large volume, complex geometry, irregular shape, rich details, fragility, and vulnerability to human and natural destruction. Traditional measurement methods are difficult to obtain complete and accurate geometric information. Frequent contact in the measurement process may cause harm to cultural heritage. Ground laser scanning and other technologies are used to create realistic and fine three-dimensional models of Hakka Earth buildings [14]. DNA analysis of ancient buildings focuses on visual analysis of traditional legacy data that need to be extracted. Although the efficiency of data extraction plays an important role in the research, it is still not possible to conduct a comprehensive data research on the data DNA of ancient buildings due to the lack of practical technology. At present, there are many methods to extract DNA from data, and different methods have their own characteristics. The PCA method we use today compares these methods to optimize the original steps of each method. The research method shows that many additional data are integrated into the DNA data to be extracted, sometimes even reducing the loss of data DNA [15].
2. Modeling and Optimization Analysis of Ancient Building Construction Rule Components about Deep Studying
2.1. Machine Studying and Deep Studying
Artificial intelligence is an abstract concept, and machine learning is an algorithm that can be applied to specific scenes. Machine learning does not mean an algorithm, but a general term for a large class of specific intelligent algorithms. There are two main tasks of machine learning: first, to find an algorithm suitable for extracting the characteristics of research objects; second, by calculating and adjusting the parameters in the algorithm, the machine learning process is simplified, as shown in Figure 1.

As shown in Figure 1, the machine learning process can be divided into five modules: selecting algorithms, initializing parameters, calculating errors, judging whether the learning is completed, and adjusting parameters. By constantly testing and optimizing parameters, the error and loss of the model can be reduced, so that the effect of the model is constantly close to the ideal state.
The emergence of artificial intelligence promotes the development of deep learning. A deep learning network model can mine information from massive data, which has a good prospect. Deep studying is a new feature method, which can obtain more useful information by analyzing and processing many samples, to improve the ability of feature representation and classification. Because it cannot express complex functions well, it has a poor effect on data feature extraction, so the generalization ability of the network is limited, and there are some limitations.
With the increase in algorithm complexity, it requires more and more network scale and computation. Therefore, how to design an efficient and feasible multilayer neural network has become an important topic. However, with the increase in the scale and complexity of the problem, simply increasing the number of layers improves functional satisfaction that cannot meet reality, because different types of data have great differences in depth, and each category has its own characteristics. Therefore, the more complex the problem is, the higher the number of layers is.
As shown in Figure 2, in deep learning, the training input only requires the original image, voice, and text information. This reduces the difficulty of processing many data sets in the training process without losing the classification performance. Therefore, this paper proposes an intelligent recognition algorithm based on a convolutional neural network (CNN) and random forest model. At the same time, the general computable feature representation can connect the work that needs more stages to be completed in traditional machine learning.

2.2. Overview of Ancient Building Structure
In the process of the development of human civilization, architecture is produced with the needs of the times and changes with the continuous progress of society. It accumulates a broad and profound national traditional culture and records the pace of social development.
The splendid culture of ancient China has experienced a history of 5000 years. Chinese ancient architecture is bound to become the accumulation of traditional culture, which also enjoys a considerable reputation and important position. As one of the excellent cultural heritages of the Chinese nation, Chinese traditional architecture not only has high artistic value but also has a profound cultural heritage and rich connotation. Therefore, how to better protect and make use of this precious heritage is particularly important. Ancient Chinese architecture, as a valuable asset in our culture, has made remarkable achievements for thousands of years.
As shown in Figure 3, domain knowledge abstraction can be abstracted into different levels. The higher the level is, the more general the abstraction has, and the different levels of abstraction of knowledge have different meanings. Ancient architecture domain ontology is a complex object composed of objects of various levels and the relationships between them.
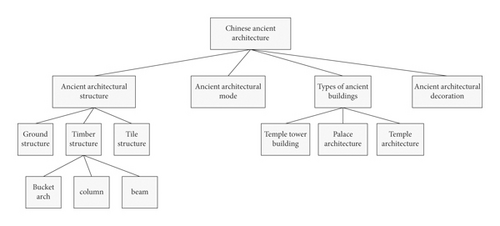
3. Rule Component Modeling and Optimization Algorithm Formula of Ancient Architecture Construction Based on Deep Learning
3.1. Convolutional Neural Network Algorithm
A convolutional neural network is studied by simulation. The experimental results show that the network structure can achieve high-accuracy classification tasks. The algorithm is divided into two steps. The parameters of the convolution kernel of an ordinary convolution neural network are adjusted by network model training.
The parameters RF and d in formula (3) represent the size of the receptive field and convolution nucleus, respectively. When the target object is stimulated, the neural network will transmit signals to the central nervous center according to the fluctuations received. The stimulation area responded by a neuron is called the receptive field of a neuron. When d = 1, the formula is expressed as the receptive field size of ordinary convolution, and when d > 1, the formula is expressed as the receptive field size of cavity convolution.
3.2. Inversion Model Algorithm
In formula (11), y is the true value and is the predicted value.
The main idea of the AdaBoost algorithm is to add the sample weight with a large error predicted by the previous round of learners to the addition model so that the samples can get more attention in the next round of learning. The improved ADA boost algorithm is applied to multiple linear regression problems. The influence of different parameter combinations on the training effect is compared through experiments and compared with several other common methods.
3.3. Loss Function Algorithm
3.4. Optimization Algorithm
In the optimization algorithm, the set loss function is generally called the objective function of the optimization problem. However, the neural network should distinguish the training error from the generalization error. The focus of the optimization algorithm is to reduce the training error, and deep learning pays more attention to the size of the generalization error. Therefore, even if the optimization algorithm is used, it may not guarantee that all neural networks have better generalization errors. Therefore, in the process of neural network training, we need to pay attention to the problems of overfitting and underfitting.
In formula (19), η is the learning rate, and the amount of calculation is reduced by iterating X. η you need to select the appropriate value to update the independent variable in reverse along the gradient to reduce the value of the objective function. In each training iteration, only one training data sample is randomly sampled to calculate the gradient.
4. Statistical Analysis of Rule Component Modeling and Optimization Experiment of Ancient Architecture Construction Based on Deep Learning
4.1. Experimental Evaluation of Deep Learning Algorithm Results
Table 1 shows the comparison results between ts-ids and traditional machine learning test sets. The data values of naive Bayes, k-nearest neighbor, decision tree, and ts-ids are counted from four aspects: accuracy, precision, recall, and F1 value.
| Model | Accuracy | Precision | Recall | F value |
|---|---|---|---|---|
| Simplicity | 0.61 | 0.55 | 0.61 | 0.53 |
| S-neighbor analysis | 0.74 | 0.75 | 0.74 | 0.70 |
| Plan tree | 0.74 | 0.78 | 0.75 | 0.70 |
| TS-IDS | 0.83 | 0.81 | 0.79 | 0.77 |
Table 2 shows the differences in classification accuracy of three different machine learning algorithms: naive, s-neighbor analysis, and plan tree.
| Model | Classification | Precision | Recall | F value |
|---|---|---|---|---|
| Simplicity | Normal flow | 0.59 | 0.92 | 0.72 |
| DOS | 0.66 | 0.65 | 0.66 | |
| Probe | 0.73 | 0.01 | 0.02 | |
| R2L | 0 | 0 | 0 | |
| U2R | 0 | 0 | 0 | |
| S-neighbor analysis | Normal flow | 0.67 | 0.97 | 0.80 |
| DOS | 0.93 | 0.75 | 0.83 | |
| Probe | 0.68 | 0.59 | 0.63 | |
| R2L | 0.58 | 0.08 | 0.14 | |
| U2R | 0.70 | 0.10 | 0.18 | |
| Plan tree | Normal flow | 0.64 | 0.97 | 0.77 |
| DOS | 0.96 | 0.88 | 0.89 | |
| Probe | 0.79 | 0.60 | 0.66 | |
| R2L | 0.74 | 0.01 | 0.03 | |
| U2R | 0.22 | 0.07 | 0.13 | |
From the perspective of five classifications, ts-ids is superior to traditional machine learning algorithms in most indicators, while all models perform poorly in the classification of r2l and u2r traffic. R2l and u2r are relatively small traffic in the data set. In other words, the imbalance of the data set may be the reason for the unsatisfactory training results.
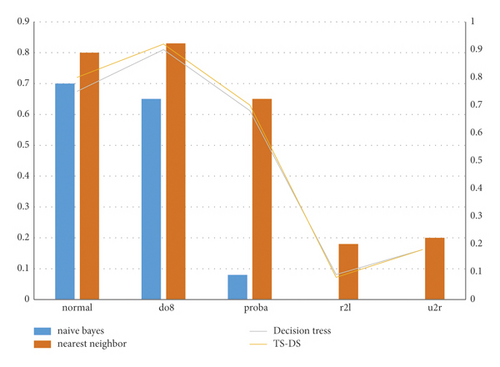
As shown in Figure 4, from the comparison of F1 values of the model, except for the malicious traffic with only a small amount of data in r2l and u2r data sets, ts-ids has more outstanding performance than other traditional machine learning models.
As shown in Table 3, compared with the experimental comparison results of MP, CN, RN, LSM, etc., ts-ids has obvious advantages in classification accuracy, accuracy, recall rate, F value, and other indicators.
| Model | Classification | Precision | Recall | F value |
|---|---|---|---|---|
| MP | 0.73 | 0.75 | 0.73 | 0.73 |
| CN | 0.77 | 0.76 | 0.74 | 0.75 |
| RN | 0.72 | 0.77 | 0.71 | 0.74 |
| LSM | 0.76 | 0.80 | 0.76 | 0.74 |
| TS-IDS | 0.84 | 0.81 | 0.79 | 0.77 |
The accuracy, precision, recall rate, and F value of the deep learning model are better than those of the machine learning algorithm. Compared with the deep learning methods, the performance of CNN and LSTM is better in the basic deep learning model, while ts-ids is improved by 7.8% to 15.2% in accuracy, 1.3% to 8% in accuracy, 3.9% to 11.3% in recall rate, and 2.5% to 5.2% in FL value.
As shown in Figure 5, it is demonstrated that in the comparison of model F1 values, the F1 value of the ts-ids model after adding the weight balance module is almost higher than that without adding the weight balance module, especially when there is less malicious traffic in r2l and u2r data sets.
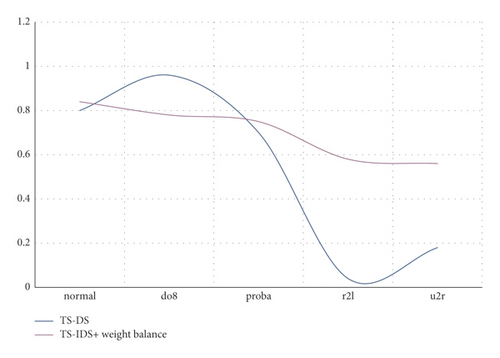
As shown in Table 4, the results of the weight balance module are compared (I). The data values of ts-id and ts-ids + weight balance models are counted from the four aspects of accuracy, accuracy, recall, and F1 value. Compared with the previous accuracy, the accuracy, recall, and FL value have been improved.
| Model | Accuracy | Precision | Recall | F value |
|---|---|---|---|---|
| TS-IDS | 0.83 | 0.81 | 0.79 | 0.77 |
| TS-IDS + weight balance | 0.82 | 0.83 | 0.82 | 0.82 |
As shown in Table 5, due to the increase in weight, the impact on accuracy caused by the category with many samples in the data set is reduced, but overall, especially for the category with a small number of samples, each index is improved.
| Model | Accuracy | Precision | Recall | F value |
|---|---|---|---|---|
| TS-IDS | Normal flow | 0.68 | 0.97 | 0.80 |
| DOS | 0.96 | 0.77 | 0.91 | |
| Pro | 0.90 | 0.62 | 0.68 | |
| RL | 0.94 | 0.01 | 0.02 | |
| UR | 0.56 | 0.07 | 0.13 | |
| TS-IDS + weight balance | Normal flow | 0.76 | 0.94 | 0.84 |
| DOS | 0.96 | 0.83 | 0.81 | |
| Probe | 0.78 | 0.72 | 0.71 | |
| RL | 0.81 | 0.45 | 0.57 | |
| UR | 0.58 | 0.43 | 0.49 | |
4.2. Experimental Analysis on Modeling and Testing of Regular Components of Ancient Architecture Construction under Deep Learning
4.2.1. Analysis of Experimental Testing Environment of Ancient Buildings
As shown in Figure 6, the monthly average temperature over the years, the monthly average maximum temperature over the years, and the monthly average minimum temperature over the years can be seen. January is the coldest, July is the hottest, January is 4.5°C, and July is 27.8°C.
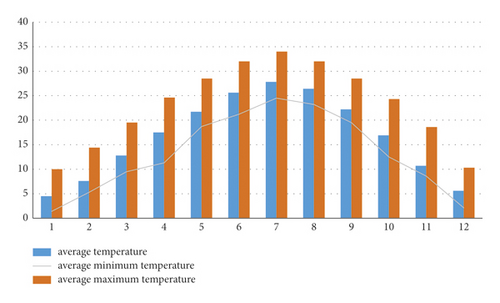
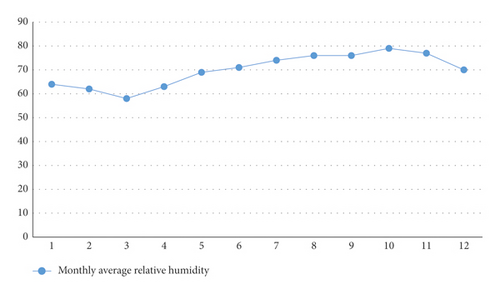
As shown in Figure 7, the humidity throughout the year is basically maintained at levels 1∼3. The humidity in January is level 1, and the humidity in July is level 7. April and August are wet seasons, while October to February is a dry season. The indoor temperature is also relatively high, up to 38°C. The outdoor temperature changes little, but the wind speed is small. According to the meteorological data, the environment of the building is relatively mild in winter, high in summer, and humid all year round.
4.2.2. Statistical Analysis of Time-Domain Characteristics
There are some differences in the striking force at different positions, and with the increase of the striking force value, the peak value of each characteristic parameter also increases, but compared with the time-domain characteristic parameter, its change range is small. Under the same conditions, there are some differences between round wood specimens with different sizes. Three groups of samples showed good repeatability. This is related to the distribution of internal defects in the sample, and there is a large deviation in the other two groups.
As shown in Table 6, comparing the average change of the characteristic parameters of the two areas to the impact time, the variation rate of the characteristic parameters reaches the maximum value of 52.12 and the effective value reaches the minimum value of 16.16. Knock impact time is in a defective area and knock impact time is in a good area. The optimal parameter combination and the optimal eigenvalue are obtained by using grey correlation analysis and principal component analysis and are applied to practical engineering detection.
| Characteristic parameters | Number | Good area | Defective area | ||||
|---|---|---|---|---|---|---|---|
| Mean value | Maximum | Minimum | Mean value | Maximum | Minimum | ||
| Peak value | 13 | 220.99 | 438.16 | 52.64 | 221.02 | 439.08 | 51.45 |
| Mean value | 13 | 1.87 | 3.24 | 0.54 | 2.43 | 4.66 | 0.63 |
| Valid value | 13 | 98.26 | 184.2 | 26.47 | 82.23 | 159.18 | 22.56 |
| Standard deviation | 13 | 22.49 | 37.55 | 5.12 | 24.32 | 41.60 | 5.38 |
| Tapping time | 13 | 1.02 | 1.28 | 0.81 | 1.56 | 1.77 | 1.38 |
4.2.3. Component Deformation Detection and Analysis of Ancient Building Beam Components
As shown in Table 7, the deformation standard member model and the original standard member model are compared and analyzed, the surface shape variables of the member are sorted out, and the normal deviation of the vertex is calculated with this beam member as an example.
| Number | Deviation amount |
|---|---|
| 1 | 2.697 |
| 2 | 1.554 |
| 3 | 2.289 |
| 4 | 4.356 |
| 5 | 2.899 |
| 6 | 4.569 |
| 7 | 5.019 |
| 8 | 3.497 |
| 9 | 3.894 |
| 10 | 3.269 |
| 11 | 1.598 |
| 12 | 2.731 |
| 13 | 4.287 |
| 14 | 1.366 |
| 15 | 3.97 |
| 16 | 1.98 |
| 17 | 3.831 |
| 18 | 1.036 |
4.3. Experimental Analysis of Optimization of Ancient Building Modeling under Deep Learning
4.3.1. Basic Process of Ancient Modeling Optimization
The application platform for the parametric generation and design of ancient building structures includes computer software such as digital project application plug-ins based on CATIA, GC application plug-ins based on MicroStation, processing plug-ins based on Java language platform and grasshopper plug-ins based on rhinoceros. In addition, there is a kind of program application software based on 3D modeling.
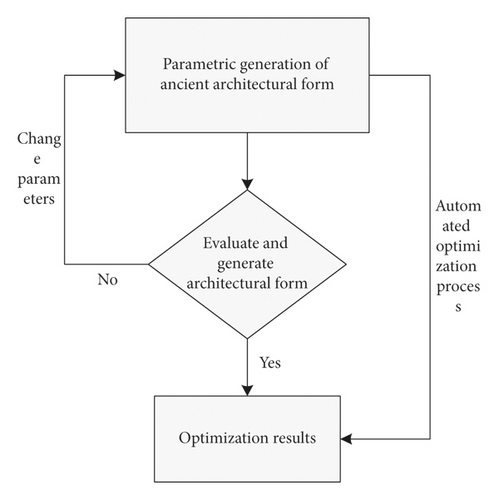
Figure 8 shows the flow chart of the building parametric modeling generation system. First, the shape parameters of ancient buildings are generated, and then the generated shape parameters are evaluated. If the parameters pass, the optimization is completed; otherwise, the parameters are changed again for evaluation and inspection.
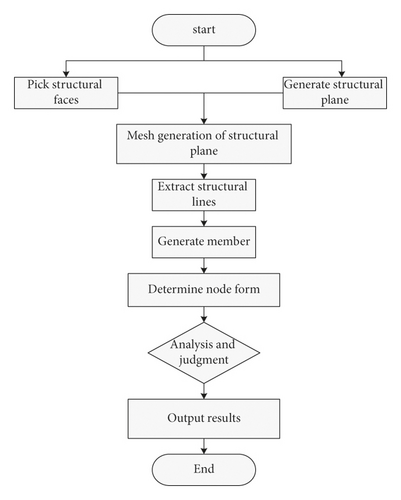
As shown in Figure 9, the flow chart of the structural parameterization generation system reflects that the formation of structural parameters consists of picking up structural planes and generating structural planes, and the structural plane network is divided, so as to extract structural lines and generate members for analysis and judgment. If the judgment is successful, the result will be output.
4.3.2. Thermal Environment Analysis after Optimization of Ancient Building Modeling
It is a relatively common and effective scheme to realize the energy-saving transformation of existing buildings by optimizing the enclosure structure. However, due to the characteristics of enclosure materials and environmental conditions, there are still many problems to be solved in its practical application. One of the most important is how to improve the thermal insulation performance of the building envelope. The utility model adds an energy-saving heat insulation layer on the existing building envelope, reduces the thermal conductivity of the entire envelope, and effectively blocks the cold air in winter, hot air in summer, etc. from entering the building interior, thereby reducing the intervention of auxiliary equipment, maintaining the indoor temperature in a comfortable state, and achieving the purpose of building energy conservation.
Table 8 shows the U-value table of different thermal insulation materials statistics and the U-value data of five thermal insulation materials: aluminum frame glass, original exterior wall, double glass, cotton frame, and glass fiber.
| Material | Aluminum frame glass | Original exterior wall | Double glazing | Cotton frame | Glass fiber |
|---|---|---|---|---|---|
| U value (w/m × k) | 5.70 | 1.76 | 2.65 | 0.89 | 0.65 |
As shown in Figure 10, the statistical chart of comfort comparison is shown. The comfort changes of optimized windows, optimized exterior wall mines, and optimized exterior wall glasses are analyzed from the three ranges of U value <1, 1< U value <5, and U value >5.
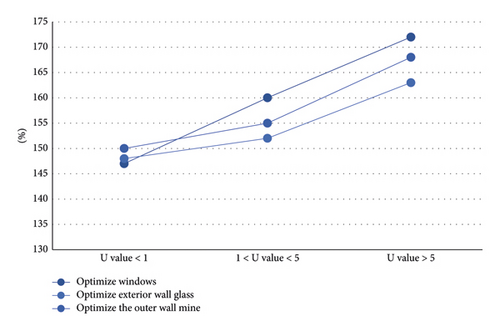
Figure 11 shows the statistical chart of the comparison of total energy consumption. The energy consumption analysis of the three schemes of optimizing windows, optimizing exterior wall mines, and optimizing exterior wall glass is analyzed from the three ranges of U value <1, 1 <U value <5, and U value >5.
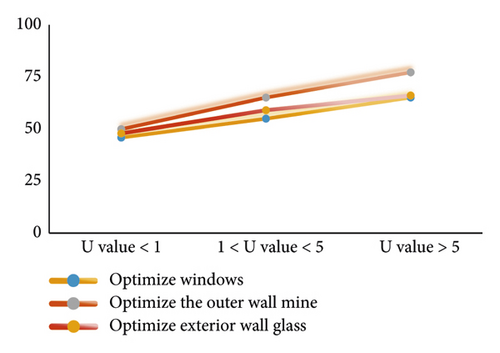
The data in the figure shows that the simulation data of discomfort and total energy consumption obtained by replacing window materials with the window transformation method shows that the energy-saving effect is the most obvious. Therefore, when selecting window manufacturing materials, the energy-saving design scheme that changes window materials is preferred, which can effectively reduce energy consumption.
4.3.3. Effect Analysis of Optimization Design of Ancient Buildings
Figure 12 shows the statistical chart of the comparison before and after energy conservation optimization. The energy consumption change trend from January to December is analyzed from the two design models of existing buildings and optimized buildings. The overall energy consumption change shows a downward trend from January to April, an increasing trend from April to August, a downward trend from August to September, and an increasing trend from September to December.
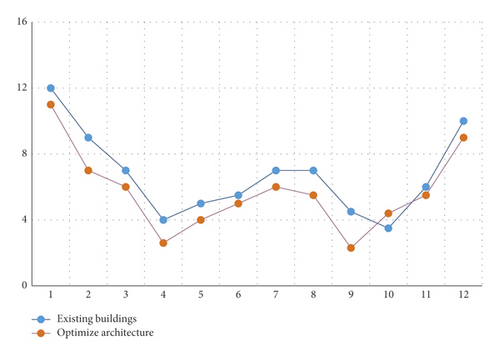
Through the use of software to establish a model of the existing building, we determine the optimal design scheme and form a conclusion through the analysis of energy-saving data before and after the implementation of the scheme. The comparison results show that the energy-saving design scheme of changing the window material effectively increases the thermal insulation coefficient of the building, improves the thermal insulation effect significantly, and achieves the energy-saving design expectation.
5. Conclusion
Firstly, this article presents the content of the deep learning technique model and the structural process of the learning model, as well as the differences between it and traditional machine learning, and then introduces an overview of traditional ancient buildings and the overall structural model of ancient buildings. Then, it introduces the research background and direction of this topic, focusing on the modeling and optimization analysis of ancient building construction rules combined with a deep learning technology model. This paper introduces the modeling and optimization algorithm formula of ancient building construction rules based on deep learning, mainly including convolution neural network algorithm, inversion model algorithm, loss function algorithm, and optimization algorithm. Finally, an experimental statistical investigation is carried out on the modeling and optimization analysis of ancient building construction rules based on deep learning, which verifies that the combination of the deep learning model and ancient building construction rule component modeling and optimization analysis can better promote the design evaluation and analysis of ancient building construction rule component modeling and further improve and optimize the problem of ancient building modeling.
Conflicts of Interest
The author declares no conflicts of interest regarding this work.
Open Research
Data Availability
The experimental data used to support the findings of this study are available from the author upon request.


