Research on Surrounding Rock Stability Affected by Surrounding Rock Pressure and Rock Fracture under Blasting Vibration Load Action
Abstract
The influence mechanisms of factors, such as high confining pressure and in situ stress caused by deep mining on the stability of surrounding rock of roadways, are complex. Particularly, the motion and energy release of the rock mass medium can be caused by vibration transmission induced by blasting excavation in the underground mining. Based on this, by taking a metal mine with the buried depth of 498 m as a research object, influences of different excavation distances on roof deformation and stress of roadway surrounding rock during the excavation were studied by using a three-dimensional numerical model. Moreover, the weak position of the roof of surrounding rock was determined. Finally, influences of fractured rock mass on propagation of blasting vibration waves in surrounding rock and energy distribution characteristics were analyzed. The research shows that rock mass around the excavated roadway moves towards the excavated space in different advance stages of a working face. The displacement fields on the top of a lateral tunnel present a heart-shaped distribution along the working face and the maximum displacement appears to the roof at the junction of the lateral tunnel and a horizontal roadway along veins. As the advance distance of the working face increases, compression-shear failure mostly occurs in the roadway surrounding rock, and tensile failure and combined tensile and shear failure occur at the unsupported roof and floor of the roadway. With the rise of the confining pressure, the total energy in frequency bands increases and its increase amplitude also rises. Furthermore, energy in a frequency domain of response signals to blasting vibration is transmitted from a secondary frequency band to a primary frequency band and is increasingly concentrated. With the increase of the damage degree of the roadway, signal energy in the frequency domain is transmitted from the primary to the secondary frequency band and signal energy is distributed more dispersedly. The test results are basically consistent with numerical simulation results. This study could provide technical guidance for the stability evaluation of surrounding rock of underground engineering structures.
1. Introduction
As the core of energy resource industry, mining industry has laid a foundation for national economic development and social progress. However, due to many uncertainties in mining as well as the high difficulty in and low level of management, the safety of mines are more complex than other industries. Based on statistics of mine accidents over the years, the annual death toll due to all kinds of mine engineering accidents accounts for more than 60% of the total casualties of workers in industrial and mining enterprises in China and the accident rate is much higher than that in other industries. In recent years, the mining depth of metal mines has been larger than 1,000 meters. However, factors, such as high confining pressure and in situ stress, lead to the state of stress instability of roadway surrounding rock, which increases difficulties in support and easily causes rib spalling and roof caving in surrounding rock. The safety of surrounding rock is a comprehensive factor reflecting integrity, deformation characteristics, strength, and stress states [1–3], and there are many influence factors and complex influence mechanisms. Therefore, it is of great significance to clarify influences of the confining pressure and different types of surrounding rock under blasting vibration on the stability of surrounding rock (Figure 1).
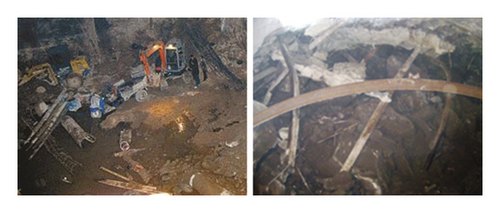
In underground mining, the vibration triggered by blasting excavation can exert many influences on the surrounding rock stability. The impacts of the blasting load on rock mass can be regarded as motion and energy release of the rock mass medium in the propagation of blasting stress waves in rock mass. The failure of rock mass under the blasting load is directly related to the stability and safety of rock mass and involves the corresponding engineering support and reinforcement measures. Therefore, many researchers in the world have studied failure theory and rock mass models influenced by blasting and made a great progress. Zhai et al. [4] calculated the dynamic response of a cylindrical cavern under the load in a limited time of period based on the superposition method. Sinhg [5] explored damages of adjacent blasting to underground coal mines. Guo [6] analyzed vibration effects under different blasting modes and their propagation in surrounding rock. Liu and Wang [7] analyzed the dynamic response of the cavern under blasting loads with different waveforms. The causes of failure of surrounding rock by blasting can be summarized into three basic viewpoints: ① failure due to the expansion pressure produced by explosive gas [8], ② failure due to reflection of stress waves induced by shock waves [9], and ③ joint action of expansion pressure produced by explosive gas and stress waves caused by shock waves. Among the three viewpoints, the first two theories only unilaterally emphasize damage effects of the blasting load on rock mass from a certain aspect. However, the third theory simultaneously considers the action of expansion pressure produced by explosive gas and stress waves, which is often used to analyze practical blasting problems. Nevertheless, the above theories are all based on blasting characteristics of homogeneous materials. The heterogeneity and anisotropy caused by joints or fractures in rock mass can significantly affect the propagation of explosive gas and stress waves in rock mass, which obviously influences blasting response characteristics of rock mass. The failure theories of rock mass caused by blasting established based on characteristics of internal structures of rock mass include the elastoplastic theory (Harries model [10] and Favreau model [11]), fracture theory (nucleation and growth to fragmentation (NAG-FRAG) model [12] and BCM model [11]), and damage theory [13]. The effects of discontinuous structural planes, such as joints, fractures, and beddings, in actual rock mass on blasting characteristics are mainly manifested as local stress concentration, enhancement of stress waves, and energy attenuation. How to consider influences of discontinuity of rock mass on blasting vibration effects is also the research focus of failure of rock mass induced by blasting at present. Li [14] proposed that corresponding blasting parameters should be selected in actual engineering according to geological characteristics of the surrounding rock, so as to obtain good blasting effects. Cui et al. [15] explored interactions of fracture and joint types with blasting vibration waves. Moreover, they proposed that the breaking orientation of jointed surrounding rock is smaller than that of surrounding rock without joints, while phenomena, such as excessive fragmentation and uneven blocks, exist in local surrounding rock. Liang et al. [16] believed that discontinuous structural planes including joints can weaken the structure of rock mass. The structure of rock mass shows more complex characteristics of stress fields under the blasting load, while the presence of the structural plane obviously increases the attenuation rate of stress waves. Rossmanith and Uenishi [17] explored propagation of blasting waves at joints with different strengths and concluded that the joint stiffness of the rock mass medium can filter high-frequency components of blasting vibration waves. Scholars in the world have deeply explored spectral characteristics of blasting vibration signals under different blasting parameters. For instance, effects of factors, such as distance from blasting center, decked charging quantity, and total charging quantity on spectral characteristics of blasting vibration signals, were studied. Nevertheless, there are few studies on influences of fractures in surrounding rock on blasting waves’ propagation in the rock and energy distribution in surrounding rock in response to blasting vibration of the roadway in an underground structure. Some scholars [18–22] have researched response signals of various engineering structures to vibration loads based on the wavelet transform analysis. They also have made many achievements in the optimization of blasting parameters and identification of blasting process and safety criteria of blasting vibration. However, due to high complexity and uncertainty of underground structure of rock mass and blasting vibration load, it is necessary to carry out systematical and in-depth research.
Based on this, influences of different excavation distances on roof deformation and surrounding rock stress during roadway excavation were studied based on the three-dimensional (3D) numerical model. The weak position of the roof was determined. Finally, influences of fractured rock mass on blasting waves’ propagation in surrounding rock and energy distribution characteristics were analyzed. In addition, the analysis results were verified to be reasonable through a laboratory test.
2. Analysis of Roof Stability of the Roadway
2.1. Calculation Model and Parameters
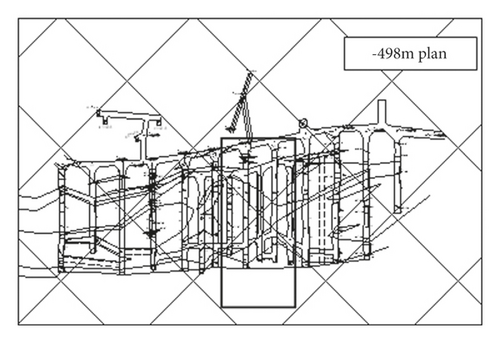
A metal mine was used in this study, and the gold mine is located in a low and gentle hilly area in the west of Jiaodong Peninsula and has better geological conditions compared with other gold mines, hard rock and low permeability. The project is controlled in a length of about 3,000 m and has a thickness ranging from more than one hundred meters to hundreds of meters. The project shows a strike angle of about 45° and is inclined to the southeast, with a dip angle of about 42° and obvious lithologic zoning. The main fracture surface is distributed along the contact zone between Archaean Jiaodong Group and rock mass in Linglong gold mine, with the thickness from tens of centimeters to several meters. Altered and quartz diorite porphyrite are widely developed in the footwall of the main fracture surface, and the main industrial orebodies were distributed in pyrite sericite and beresitized granitic cataclasite. The aim of this study is to master internal stress, deformation, and failure characteristics of surrounding rock caused by mining of the working face and dynamic response of rock mass in the mining process. To this end, a horizontal working face with the buried depth of 498 m of No. VII orebody in the gold mine was taken as the research object. Based on this, effects of blasting excavation-induced disturbance on the stability of surrounding rock were simulated by using a 3D calculation model. The planar distribution at the buried depth of 498 m is shown in Figure 2.
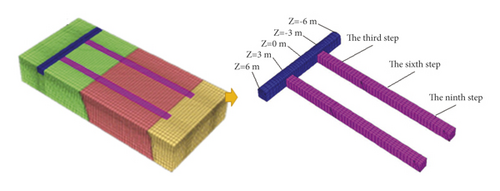
A calculation model was established by selecting the strike of the working face, a haulage way, and the vertical direction separately as the X, Z, and Y directions. In order to truly reflect surrounding rock environment, the dimensions of the 3D model were finally determined as 70 m × 30 m × 21 m by comprehensively considering distribution characteristics of orebodies and surrounding rock and excavation-induced disturbance, as shown in Figure 3. The model had 65,321 elements and 73,821 nodes in total. Horizontal constraints were applied to the periphery of the model and vertical constraints were imposed to the bottom of the model. The Mohr–Coulomb model was used for the constitutive relationship. To obtain the stability of surrounding rock at different positions, five monitoring surfaces were set in a horizontal roadway along veins, and eight monitoring points were set on the cross section of the roadway.
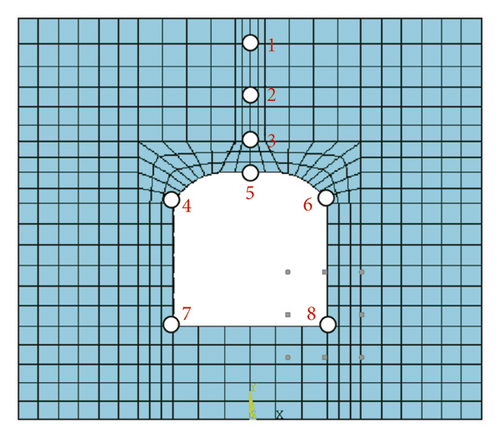
The initial supporting elastic modulus E is 31.5 GPa, Poisson's ratio is 0.2, and bulk density is 2500 kg/m3. The analysis parameters of the rock used in the calculation model were from geological survey report, as listed in Table 1.
| Rock | Tensile strength (MPa) | Elastic modulus (GPa) | Poisson’s ratio | Cohesion (MPa) | Angle of internal friction (°) | Density (kg·m−3) |
|---|---|---|---|---|---|---|
| Hanging wall | 7.1 | 17 | 0.27 | 4.3 | 27 | 2640 |
| Ore body | 8.0 | 23 | 0.22 | 6.2 | 34 | 2870 |
| Footwall | 7.2 | 21 | 0.25 | 5.5 | 31 | 2640 |
The MAT_HIGH_EXPLOSIVE_BURN high-performance explosive materials in ANSYS/LS-DYNA program were used for simulation and the calculation took 5 × 10⁵ μs. The parameters of explosives are listed in Table 2. Lagrange algorithm was used for rock mass, and Arbitrary Lagrangian Eulerian (ALE) algorithm was utilized for explosives.
| Density (kg/m3) | Blasting velocity (m/s) | A (GPa) | B/ | R1/ | R2 (GPa) | RCJ (GPa) | E0 (GPa) |
|---|---|---|---|---|---|---|---|
| 1250 | 5600 | 248 | 0.21 | 4.5 | 0.88 | 3.58 | 4.25 |
2.2. Analysis of Effects of Mining on the Surrounding Rock Stability
Before analyzing influences of blasting vibration on the roadway rock stability, change laws of displacement in the mining process were firstly analyzed, as demonstrated in Figure 4.
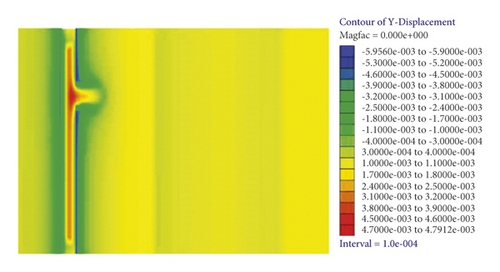
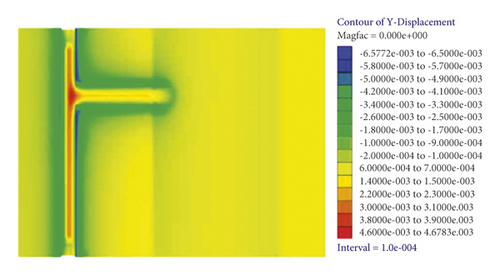
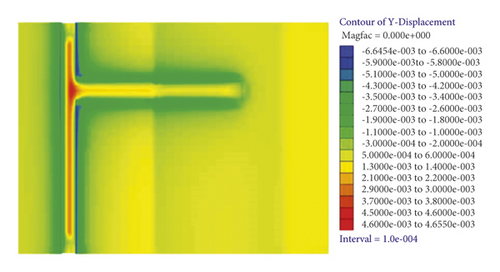
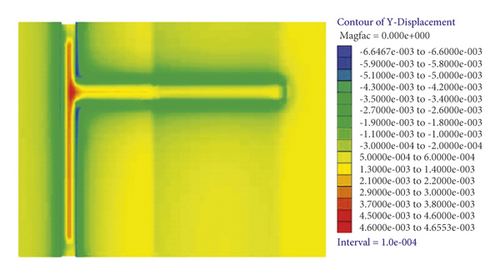
As shown in Figure 4, rock around the excavated roadway moves to the excavation space with the working face advance. The displacement fields on the lateral tunnel top are distributed in a heart shape along the working face, and the maximum displacement (6.3 mm) is found on the roof at the junction of the lateral tunnel and the horizontal roadway along veins. The displacement of surrounding rock of the floor reaches the maximum at the junction of the lateral tunnel and the horizontal roadway along veins, while displacement fields change unobvious along the excavation direction. Because the roof is unsupported due to roadway excavation, its displacement fields change more severely compared with those on the floor.
To further clarify the displacement variation of the roof of the horizontal roadway along vines, vertical displacements of the roof at different monitoring points were calculated under the advance distances of the working face of 5, 20, and 45 m. The change curves of the displacement are shown in Figure 5.
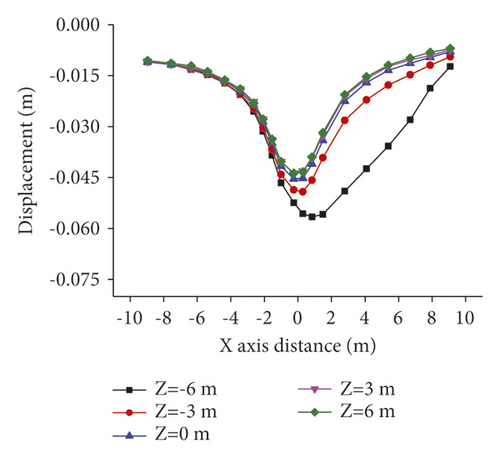
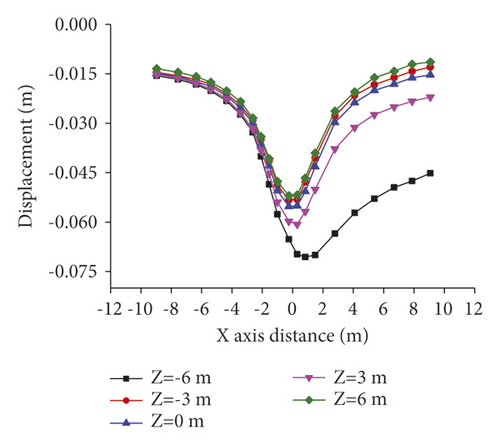
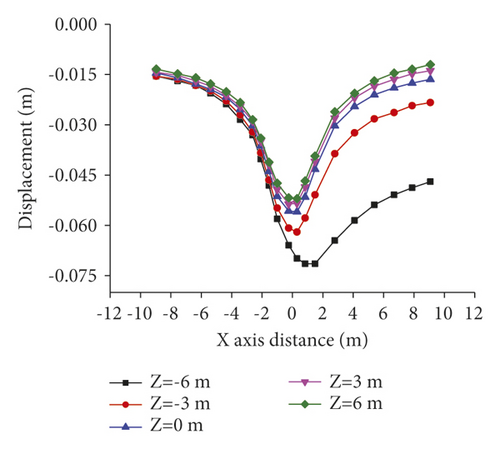
As shown in Figure 5, with the increasing of the excavation distance, the vertical displacement of surrounding rock tends to rise. The horizontal roadway along veins within 3 m from the lateral tunnel is significantly affected where the vertical displacement changes most obviously so that the vertical displacement increases by 62% at most. When the distance from the horizontal roadway along veins to the lateral tunnel is larger than 3 m, the vertical displacement along veins changes insignificantly and the maximum displacement increases by 30%. On the whole, with the increasing of the excavation distance, the deformation of surrounding rock of the roadway increases, while its increase amplitude tends to decrease. Particularly, when the working face advances 5 m beyond the monitoring position, its deformation gradually tends to be stable. After exceeding 20 m, it can be considered that there is no influence.
The 3D simulation results for failure of the roadway surrounding rock during the excavation of the working face are demonstrated in Figure 6.
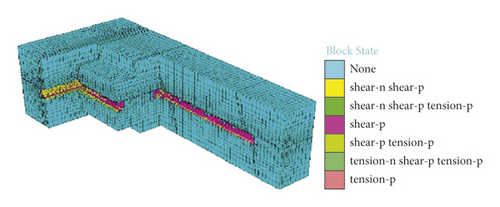
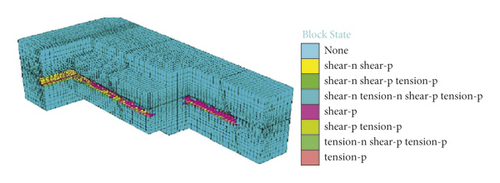
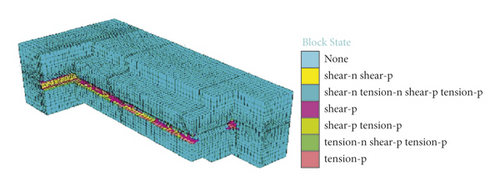
As displayed in Figure 6, damage of rock mass gradually accumulates as the advance depth of the working face increases. Due to low shear-bearing capacity of rock mass, surrounding rock mainly shows compression-shear failure, while tensile failure and tensile-shear failure mainly occur in surrounding rock of the roof and floor of the roadway in different excavation distance. With the excavation of the roadway, strain energy accumulates at the junction of the horizontal roadway along veins and the lateral tunnel so that the failure zone continuously develops. As the working face advances, overburden failure leads to continuous shear failure of overburden strata, which releases energy accumulated in rock mass and reduces the probability of dynamic disasters. When the excavation distance is 45 m, the subsequent failure zone in the roadway surrounding rock gradually changes into the elastic state.
2.3. Analysis of Influences of Fracture on Propagation Characteristics of Stress Waves in Surrounding Rock
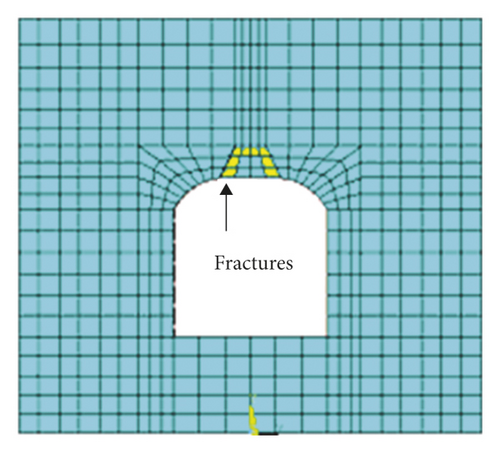
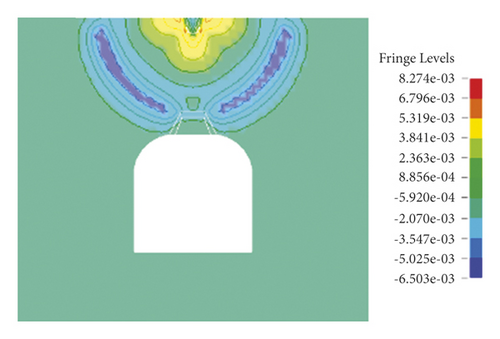
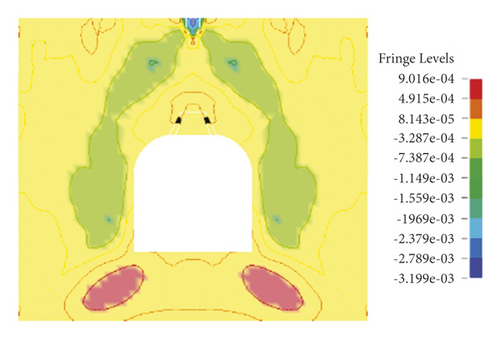
To investigate different behaviors of stable roof and unstable roof of surrounding rock in blasting vibration, this study firstly simulated intact roof of surrounding rock and roof with the fracture when the detonation point was at the top of the model. The propagation of explosive waves lasted for 600 μs, as shown in Figures 7 and 8.
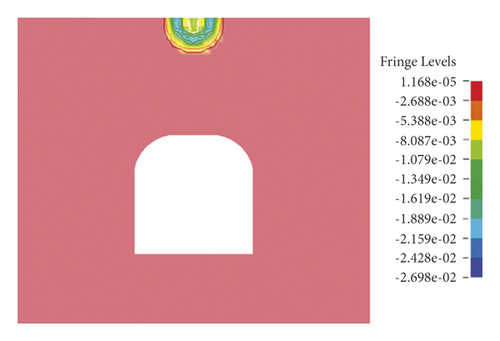

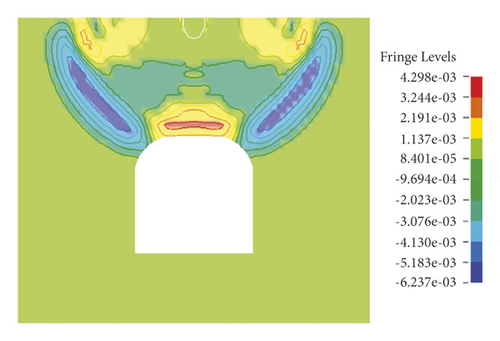
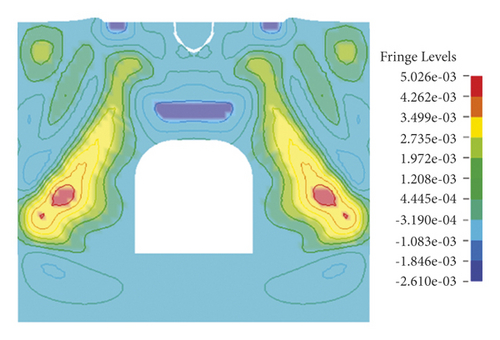

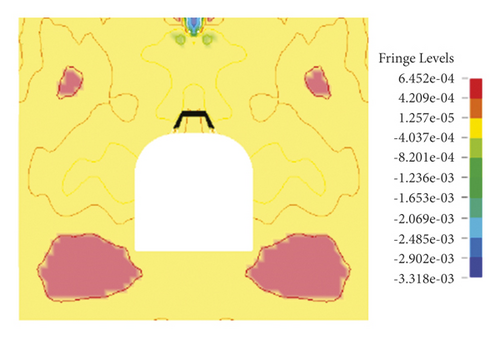
As illustrated in Figure 7, blasting waves propagate around in a ring from the explosion center in the initial blasting stage. In the following 80 μs, the vibration-induced stress waves propagate downward to both sides of the roadway bypassing the section of the roadway to form tensile stress zones on both sides till waves reach two side boundaries and bottom boundary. At 170 μs, a wide range of tensile stress concentration occurs directly above the roof. In the following time, the interaction between stress waves and reflected waves results in an alternation of compressive stress and tensile stress within the model until reaching stability. Similar to blasting vibration-induced stress waves’ propagation in the stable roof, the simulated blasting starts from the roof at 0 s, and a wave front rapidly propagates from the blasting point to the whole model in the first 60 μs. This process is identical with that of the stable roof within 60 μs.
As displayed in Figure 8, when blasting-induced stress waves propagate to the fracture in the unstable roof, there are differences. Because of changes in physical parameters of the medium, stress waves do not propagate as the wave front of concentric circles, and at the fracture, the waves produce a concave surface pointing to the detonation point and then continuously develop. Moreover, reflected waves weaken when encountering the roof of the roadway. In the following 80 μs, vibration-induced stress waves propagate downward to both sides of the roadway bypassing the section of the tunnel, forming tensile stress zones on both sides, till the waves reach two side boundaries and bottom boundary. However, the tensile stress zones seen at 170 μs on both sides are much larger than those before, and the compressive stress concentration zone is formed above the fracture. In the subsequent time, stress waves interact with reflected waves to lead to the alternation of compressive stress and tensile stress in the model. When there is a fracture in the range of 200∼450 μs, compressive stress and tensile stress waves alternate at regular intervals. This is because blasting vibration waves and waves reflected by the roof of the roadway are superimposed and act alternately. At about 450 μs, the fracture begins to fail, that is, internal fractures propagate. From 450 μs to 600 μs, fractures in the fracture constantly propagate and the structure finally fails. Based on this, the unit fractures in the unstable roof gradually propagate with the alternation of tensile and compressive stress till complete failure of the fracture at 600 μs.
3. Effects of the Confining Pressure on Energy Distribution of Response Signals of the Tunnel to Vibration
3.1. Energy Analysis of Response to Blasting Vibration
In the damped vibration system with multiple degrees of freedom, the rock mass medium was divided into structures with different frequency responses by fractures or cracks in rock mass. Therefore, the response signals of surrounding rock of the roadway to blasting vibration are composed of multiple frequency bands with different energies in different frequency ranges. After response signals of the roadway surrounding rock to blasting under different confining pressures are decomposed by 7-level wavelet transform, the results and energy in frequency bands are obtained. Based on this, the frequency band with the maximum energy is defined as a primary frequency band, while the rest frequency bands are defined as secondary frequency bands. Therefore, the primary frequency band of response signals is the frequency band 4, namely, 15.7∼31.3 Hz.
Proportions of primary and secondary frequency bands in the increase amplitude of total energy in frequency bands at eight monitoring points are extracted every time when the confining pressure increases by 4 MPa (the buried depth of the roadway increases by 160 m), as shown in Tables 3 and 4.
| Variation of confining pressure | Monitoring point 1 | Monitoring point 2 | Monitoring point 3 | Monitoring point 4 | ||||
|---|---|---|---|---|---|---|---|---|
| Primary | Secondary | Primary | Secondary | Primary | Secondary | Primary | Secondary | |
| 1∼4 MPa | 63.25 | 34.75 | 62.30 | 35.70 | 60.20 | 37.80 | 58.15 | 39.85 |
| 4∼8 MPa | 63.06 | 34.94 | 62.81 | 35.19 | 60.65 | 37.35 | 58.89 | 39.11 |
| 8∼12 MPa | 63.02 | 34.98 | 62.97 | 35.03 | 60.75 | 37.25 | 59.01 | 38.99 |
| 12∼16 MPa | 63.04 | 34.96 | 63.04 | 34.96 | 60.90 | 37.10 | 59.27 | 38.73 |
| 16∼20 MPa | 63.00 | 35.00 | 63.11 | 34.89 | 60.90 | 37.10 | 59.28 | 38.72 |
| Variation of confining pressure | Monitoring point 5 | Monitoring point 6 | Monitoring point 7 | Monitoring point 8 | ||||
|---|---|---|---|---|---|---|---|---|
| Primary | Secondary | Primary | Secondary | Primary | Secondary | Primary | Secondary | |
| 1∼4 MPa | 52.06 | 45.94 | 51.23 | 46.77 | 42.06 | 55.94 | 41.33 | 56.67 |
| 4∼8 MPa | 52.95 | 45.05 | 51.86 | 46.14 | 42.78 | 55.22 | 42.05 | 55.95 |
| 8∼12 MPa | 53.29 | 44.71 | 52.07 | 45.93 | 42.75 | 55.25 | 42.06 | 55.94 |
| 12∼16 MPa | 53.40 | 44.60 | 52.20 | 45.80 | 43.03 | 54.97 | 42.31 | 55.69 |
| 16∼20 MPa | 53.54 | 44.46 | 52.21 | 45.79 | 43.07 | 54.93 | 42.32 | 55.68 |
As illustrated in Tables 3 and 4, the increase amplitude of the energy in the primary frequency band is dominated in that of total energy in frequency bands caused by the increasing of the confining pressure. The increase amplitude of energy in the primary frequency band at monitoring point 2 accounts for about 63% of the increase amplitude of total energy, while those at monitoring points 5 and 6 occupy about 52%. Moreover, the increase amplitude of energy in the primary frequency band at monitoring point 8 accounts for around 42%. In the meanwhile, with the confining pressure increasing, the proportion of the increase amplitude of energy in the primary frequency band in that of total energy in frequency bands rises correspondingly. As the distance from blasting center increases, the energy ratio in the primary frequency band reduces. When the confining pressure is 20 MPa, the energy ratios in primary frequency bands at monitoring points 2, 5, 6, and 8 are 63.11%, 53.54%, 52.21%, and 42.32%, respectively. This indicates that a larger distance from the blasting center leads to wider energy distribution in the frequency domain of response signals in surrounding rock of the roadway, more uniform energy distribution, and larger influence range of blasting vibration effects.
Figure 9 shows vibration response signals of the roadway surrounding rock under the confining pressure of 1 MPa.
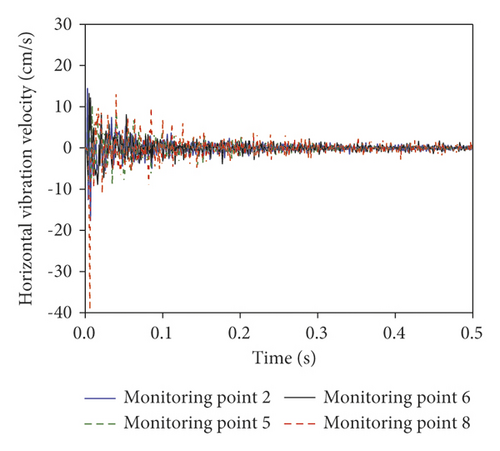
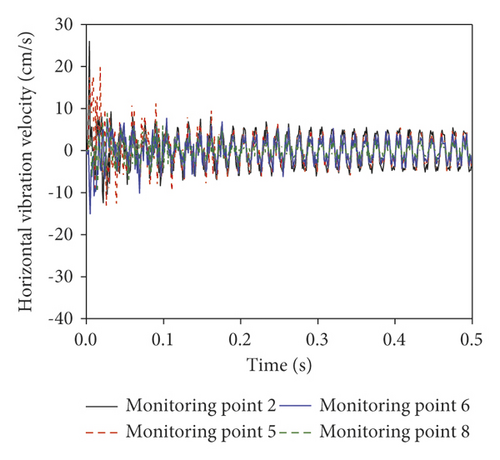
As demonstrated in Figure 9, the vibration velocity in the horizontal direction attenuates rapidly, while that in the vertical direction decays slowly after 0.2 s. The reason is that the reflection boundary is not applied on the model, so the horizontal blasting vibration waves are not reflected when propagating to the boundary; the vertical blasting vibration waves are reflected when propagating to the bottom of the model. In the meanwhile, the second and third wave peaks appear at 0.06 s and 0.085 s as well as 0.2 s and 0.3 s in time histories in the horizontal and vertical directions at monitoring points 5, 6, and 8. This implies that reflection existing when blasting vibration waves propagate to the roadway walls.
The surrounding rock stress state directly affects the propagation and attenuation of blasting vibration waves. Figure 10 demonstrates the horizontal and vertical peak vibration displacements at various monitoring points under different confining pressures.
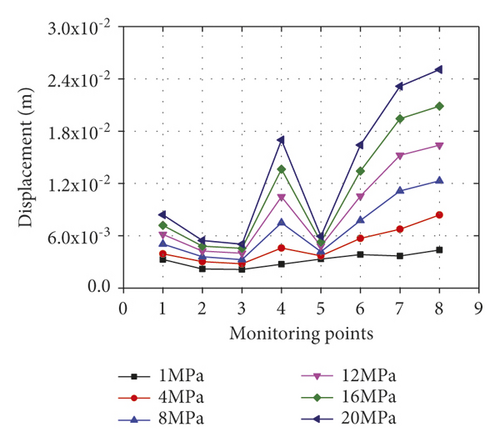
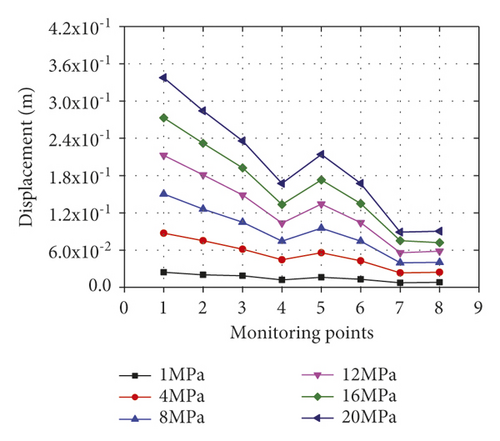
Figure 10 shows that the displacements tend to rise with the confining pressure increasing from 1 to 11 MPa. Taking the horizontal displacement as an example, the differences of the displacements at different monitoring points separately are 13.1%, 46.5%, 30.02%, 6.5%, 38.1%, 19.4%, 17.7%, and 67.9% under the confining pressure of 1 MPa. Under the confining pressure of 20 MPa, the differences are 422.7%, 383.7%, 559.9%, 362.1%, 558.9%, 269.3%, 125.2%, and 55.1%, respectively.
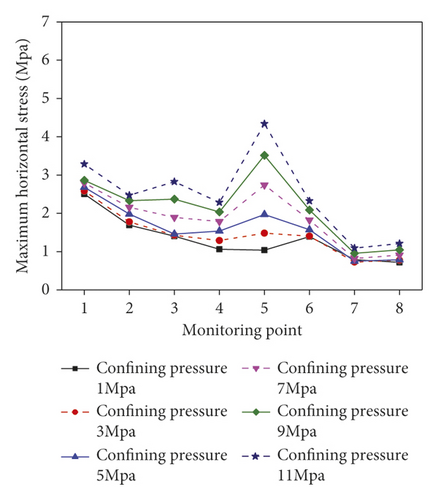
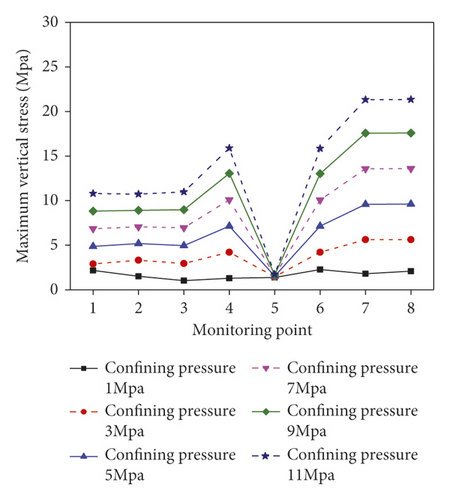
In Figure 11, as the confining pressure rises from 1 to 11 MPa, the horizontal stresses and vertical stresses of different monitoring points increase. In addition, under the confining pressure of 1 MPa, the differences of peak stresses in horizontal and vertical directions at different monitoring points separately are 13.5%, 46.2%, 28.5%, 7.0%, 35.5%, 17.1%, 15.8%, and 65.7%. The differences are 418.5%, 378.2%, 571.5%, 349.2%, 548.8%, 272.5%, 122.9%, and 53.5% under the confining pressure of 20 MPa.
The total energies in wavelet frequency bands at various monitoring points in surrounding rock of the roadway under different confining pressures are compared in Figure 12.
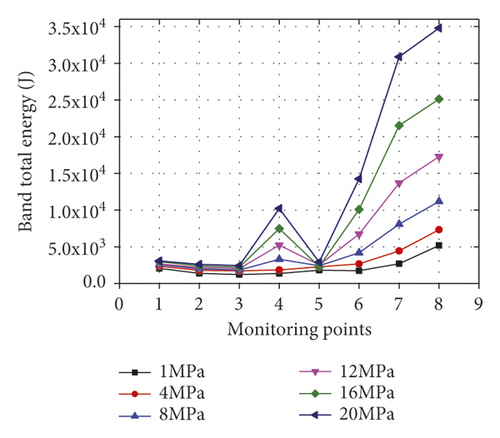
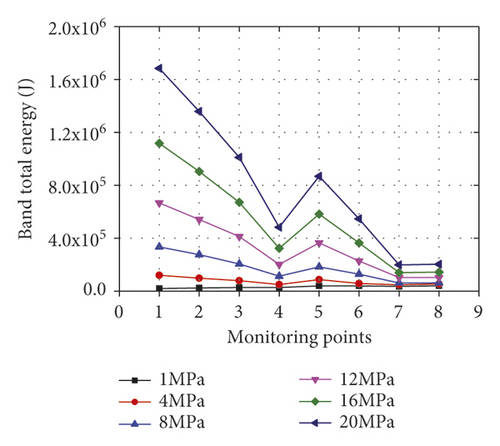
As displayed in Figure 12, the total energies in frequency bands in the horizontal direction at each monitoring point are smaller than those in the vertical direction under different confining pressures. By taking the monitoring point 5 as an example, the total energy in frequency bands in the horizontal direction is 3.35 × 10⁴ J, while that in the vertical direction is 1.69 × 10⁵ J under the confining pressure of 20 MPa. In the meanwhile, the total energy in frequency bands in the horizontal direction is maximum at monitoring point 8, while the minimum value is found at monitoring point 1. The opposite phenomenon is found in the vertical direction. This is because these monitoring point have different distances to the blasting center. The larger the distance from blasting center is, the greater the total energy in wavelet frequency bands of response signals. With the confining pressure increasing, the total energy in frequency bands rises and its increase amplitude also increases. Similarly, by taking the monitoring point 5 as an example, the increase amplitudes of total energy in frequency bands in the horizontal direction separately are 2,112, 3,989, 5,898, 7,798, and 9,587 J, while those in the vertical direction are 10,809, 22,415, 33,890, 45,700, and 56,910 J, respectively.
4. Model Test
The general roadway in actual mining engineering is simplified here. The engineering conditions are shown as follows. The roadway spans 2 m and mining width is 2.5 m. There is no pillar and the roof is supported by anchor bolts. End-anchored bolts are mainly used for anchorage. The arranged grids are 1 m × 0.8 m and the anchorage length is 1.8 m. Only the dead-weight stress field of the model and the overburden confining pressure are considered in the test, so a plane stress model under the dead-weight stress field is selected for the test. In actual engineering, the physical and mechanical parameters of materials and stress states of the roadway surrounding rock are complicated and cannot be completely reproduced in the model test. Therefore, to ensure that the test meets the main objective requirements [19, 23–25], certain simplification and assumptions are adopted. ① Discontinuous structural planes, such as joints and fractures, are not considered in the model of rock mass, that is, it is assumed that roadway surrounding rock is homogeneous, continuous, and isotropic. ② Influences of structure are ignored in the model of anchor bolts, which only have monitoring functions.
4.1. Calculation in the Model Test Based on Similarity Theory
In accordance with dimensional theory, the physical quantities with the same strength dimension should be expressed by the stress similarity ratio ασ, while the similarity ratio of dimensionless quantities is a constant of 1. Therefore, similarity ratios of physical quantities of simulated materials of rock are calculated in Table 5. The similarity ratio ασ of stress and similarity ratio αL of geometry are control physical quantities and the similarity ratios of other physical quantities are derived according to the dimensional theory. The similarity ratios of physical quantities of simulated materials of anchor bolts are illustrated in Table 6.
| Physical quantity | Stress, ασ | Elastic modulus, αE | Poisson’s ratio, αμ | Cohesion, αC | Bulk density, αγ | Surface force of boundary, αX | Displacement, αu | Angle of internal friction, αφ |
|---|---|---|---|---|---|---|---|---|
| Similarity ratio | 5 | 5 | 1 | 1 | 1 | 5 | 5 | 1 |
| Physical quantity | Stress, ασ | Elastic modulus, αE | Bulk density, αγ | Geometry, αL |
|---|---|---|---|---|
| Similarity ratio | 5 | 5 | 1 | 1 |
According to the test purpose, the response signals under different damage degrees of surrounding rock and different confining pressures were tested, respectively.
4.1.1. Damage Degree of Surrounding Rock
Three damage grades of the surrounding rock are divided, namely, the intact model (undamaged block), the damage model (mortar ratio of 8 : 1 : 1 for connection), and the failure model (there is no mortar, and the damaged block is anchored only by anchor bolts), as shown in Figure 13.
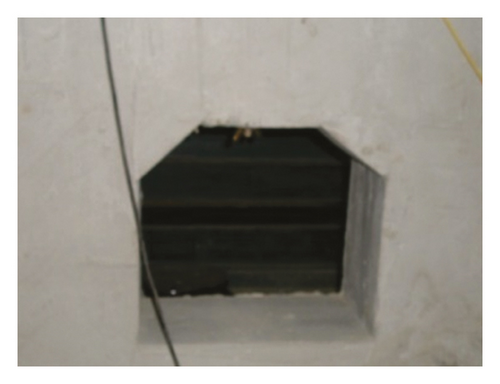

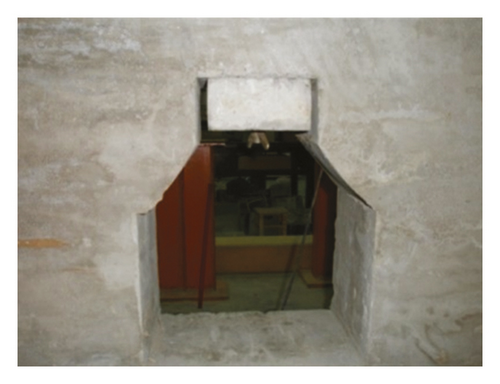
The total energies in frequency bands of response signals in surrounding rock under different vibration intensities and confining pressures for models with different damage degrees were compared. With the decrease of the vibration intensity, the total energy in frequency bands reduces. When the confining pressure is 4.0 MPa, the total energies in frequency bands in the intact model under different vibration intensities are 1,872, 1,232, and 1,262 J, while those of the damage model are 2,251, 1,455, and 1,172 J, respectively. The total energies in frequency bands in the failure model separately are 2,861, 2,689, and 1,912 J. As the confining pressure rises, the total energies in frequency bands of response signals increase in different models. When the confining pressure rises from 0.2 to 4 MPa, the total energies in frequency bands in the intact model, damage model, and failure model increase by 102.65%, 141.56%, and 180.25%, respectively, under the first vibration intensity. This suggests that the energy in frequency bands of response signals of surrounding rock to vibration is more sensitive to variation of the confining pressure after fractures propagate in surrounding rock mass.
4.2. Distribution of Energy in Frequency Bands of Response Signals
First, we applied vibrations of different intensities to each of the three models, and the frequency band energy of the vibration signal of the three test models is analyzed, as shown in Figure 14.
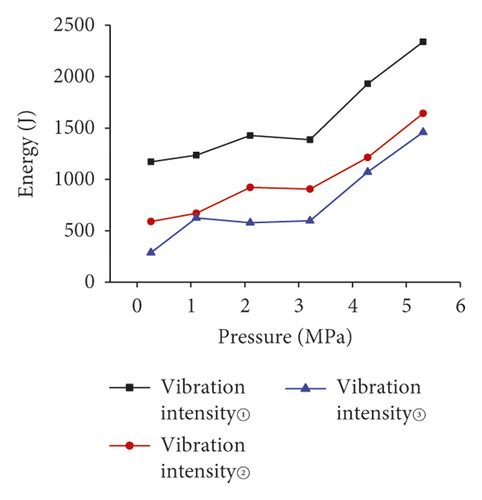
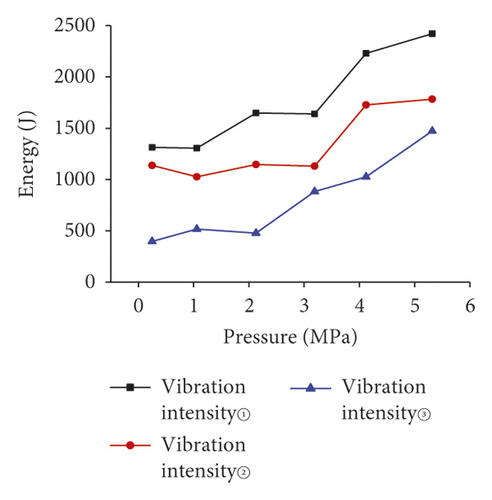
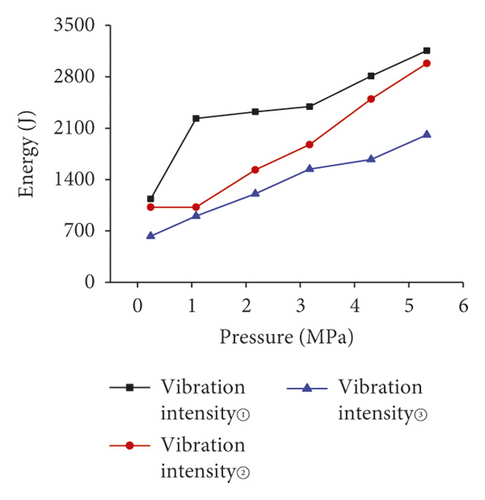
Figure 14 shows the total energy of frequency band increases with the surrounding rock pressure increase. The total energy of frequency band intact model increases 10 times under the vibration strength 3 action. Also, we could find that total energy increases with the decreasing of the vibration strength.
After five-level wavelet decomposition, the test signals are decomposed into six frequency bands in the frequency domain. According to formula (1), energies distributed in each frequency band and the energy ratios P in each frequency band are calculated. The calculation results are shown in Figure 15.
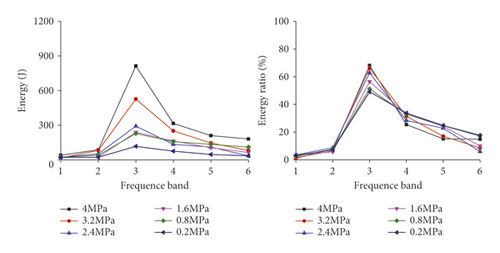
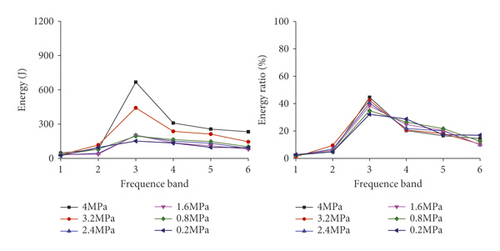
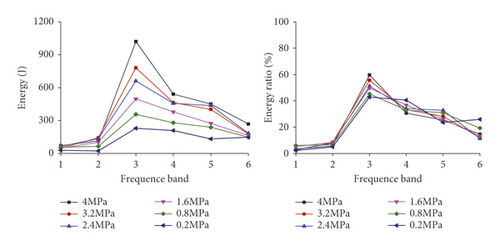
Figure 15 shows that energy in frequency bands of response signals is distributed consistently in each model under different confining pressures. The frequency band with the maximum energy, namely, the primary frequency band, is the frequency band 3 in the range of 15.55∼32.10 Hz. The results are consistent with numerical simulation results. The difference is that the energy ratio in the frequency band 6 of test signals is about 11%, while those in the frequency bands 7 and 8 in numerical simulation results are smaller than 5%. This indicates that there is more energy in the high-frequency part (124∼252 Hz) of the test signals, resulting from inevitable existence of fine bubbles and microfractures due to uneven vibration in the pouring process of the model. Therefore, many vibration-induced stress waves are reflected and refracted in the propagation in the surrounding rock model, and the energy of noise signals are also mainly concentrated in the high-frequency range.
Similar to analysis results of numerical simulation, with the confining pressure increase, the energy ratio in the primary frequency band rises, indicating that energy is transferred from the secondary frequency band to the primary frequency band. The energy in the frequency domain is increasingly concentrated. For example, the energy ratios in the primary frequency bands under different confining pressures in the damage model at the vibration intensity of 3 are 31.18%, 33.35%, 37.89%, 41.05%, 41.89%, and 45.01%, respectively. In actual engineering, with the increase of the mining depth, the confining pressure rises, and the energy in the primary frequency range of response signals of surrounding rock to blasting vibration increases. Under the same blasting strength, the larger the mining depth is, the greater the blasting vibration effects of the surrounding rock is and the more easily the local failure of surrounding rock is, finally leading to overall failure and collapse accidents.
5. Conclusions
- (1)
In different excavation distance, rock mass around the excavated roadway moves to the excavated space. The displacement fields on the top of the lateral tunnel are distributed in the heart shape along the working face and the maximum displacement of 6.3 mm is found in the roof at the junction of the lateral tunnel and horizontal roadway along veins. The vertical displacement of the roadway surrounding rock increases and changes most significantly within the mining distance of 3 m. In this case, the maximum vertical displacement rises by 62%. When the excavation distance between the horizontal roadway and the lateral roadway is larger than 3 m, the surrounding rock displacement of the roadway along veins changes unobviously and the maximum displacement only increases by 30%.
- (2)
With the rise of the advance distance of the working face, compression-shear failure mainly occurs in surrounding rock of the roadway, and tensile failure and combined tensile and shear failure mainly appear to the unsupported roof and floor of the roadway. In addition, as the excavated working face of the roadway advances, the strain energy of surrounding rock accumulates at the junction of the lateral tunnel and horizontal roadway along veins so that the failure zone constantly develops. When advancing to 45 m, the subsequent failure zone in surrounding rock of the roadway gradually changes into the elastic state.
- (3)
With the confining pressure increasing, the total energy in frequency bands rises and its amplitude also increases. The closer the natural frequency is to the primary frequency band (15.6∼31.3 Hz), the greater the blasting vibration effects on underground structures (lining structures, support structures, etc.) and the larger the possibility of failure. With the distance from the blasting center increase, the energy ratio in the primary frequency band decreases. This indicates that the large the distance from the blasting center, the wider the energy distribution in the frequency domain of response signals in surrounding rock, the more uniform the energy distribution, and the larger the influence range of blasting vibration effects.
- (4)
The comparison between laboratory test results and numerical simulation results shows that the energy ratio in high-frequency bands of test signals is larger. This is mainly because more reflection and refraction are present in the vibration waves propagation in the model, and there are certain high-frequency noise components in signals. With the confining pressure increase, the energy tends to be concentrated. As the damage degree of the roadway rises, the energy in the frequency domain of signals is transmitted from the primary frequency band to the secondary frequency band and signal energy is distributed more dispersedly. The test results are basically consistent with numerical simulation results.
Conflicts of Interest
The authors declare no conflicts of interest.
Acknowledgments
This work was financially supported by China Postdoctoral Science Foundation (2021M691391), Open Foundation of the United Laboratory of Numerical Earthquake Forecasting (Grant no. 2021LNEF04), and the National Natural Science Foundation of China (52174188).
Open Research
Data Availability
The data used to support the findings of this study are available from the corresponding author upon request.


