COX-2 Regulates the Proliferation and Apoptosis of Activated Hepatic Stellate Cells through CDC27
Abstract
Cyclooxygenase-2 (COX-2) is an important rate-limiting enzyme in the synthesis of prostaglandins (PGs), which can be upregulated by various stimuli. COX-2 has been shown to be involved in the occurrence and development of hepatic fibrosis by regulating the proliferation and apoptosis of hepatic stellate cells (HSCs) in previous studies. The aims of the study are to study the mechanism of how COX-2 regulates the proliferation and apoptosis of HSCs and to provide new targets for the prevention and treatment of hepatic fibrosis. A short hairpin RNA targeting COX-2 was constructed, and the changes in proliferation and apoptosis of liver tissue cells and HSCs were observed, respectively. COX-2-shRNA-1 significantly suppressed the proliferation of HSCs in vivo. Moreover, knockdown of COX-2 significantly suppressed cell proliferation and accelerated cell cycle arrest and apoptosis in vitro. Among those differential genes related to cell proliferation and apoptosis, CDC27 and Sh3kbp1 were upregulated, but Plcd4 was suppressed. Mechanistically, the influence of COX-2 on HSCs partly depends on upregulating CDC27. Our results demonstrated that COX-2 regulates the proliferation and apoptosis of activated hepatic stellate cells through the CDC27 pathway. This study contributes to our understanding of the effect of COX-2 for the treatment of hepatic fibrosis.
1. Introduction
Hepatic fibrosis, a common pathophysiological process in many chronic liver diseases, is manifested by the excessive and abnormal deposition of extracellular matrix components in the liver. It is the necessary stage for the development of chronic liver disease to cirrhosis. It is now believed that liver fibrosis may be reversed to normal, while cirrhosis is not. However, there is no effective method for the treatment of liver fibrosis.
Cyclooxygenase-2 (COX-2) is an important rate-limiting enzyme in the synthesis of prostaglandin (PGs). COX-2 is hardly expressed in normal tissues, but can be upregulated when stimulated by various factors. Extensive research has shown that COX-2 participates in some pathological processes, such as cell malignant transformation, inflammatory response, and catalyzing the biosynthesis of arachidonic acid (AA) to affect disease processes. Research in the area of hepatic fibrosis showed that COX-2 is an important molecule that affects the development of it. Celecoxib, a COX-2 inhibitor, suppresses the hepatic fibrosis induced by bile duct ligation (BDL) and thioacetamide (TAA) [1]. Other researchers used CCL4 to replicate the model of hepatic fibrosis and found that COX-2 knockout mice had less necrosis, degeneration, and connective tissue hyperplasia than the wild-type mice [2]. These mice also had lower expression of α-smooth muscle actin (α-SMA) in the liver tissue and less serum hyaluronic acid (HA), collagen IV (IV-C), and collagen III (PC III). Short hairpin RNA was used to silence COX-2 in nonalcoholic fatty liver disease (NAFLD) rats, and the liver tissue steatosis, inflammatory degree, and hepatic fibrosis were significantly reduced in COX-2 silencing rats [3].
CDC27 is a core subunit of anaphase-promoting complex/cyclosome (APC/C). APC/C is a type of E3 ligase complex that regulates chromosome segregation and mitotic exit [4]. APC/C reportedly participates in the TGF-β signaling pathway, and TGF-β activates CDC27, which promoted liver fibrosis via the TGF-β pathway in both HSC and hepatocyte [5]. Recent evidence suggests that COX-2 may be involved in the development of hepatic fibrosis by regulating the proliferation and apoptosis of hepatic stellate cells (HSCs). SC-236, a selective COX-2 inhibitor, had an antihepatic fibrosis effect and significantly promoted the apoptosis and growth inhibition of isolated cultured HSCs [6]. Celecoxib, another COX-2 inhibitor, has been reported to suppress the formation of hepatic fibrosis in rats by inhibiting the proliferation of platelet-derived growth factor- (PDGF-) induced HSCs and promoting the apoptosis of these HSCs [1].
However, the mechanism of how COX-2 regulates the proliferation and apoptosis of HSCs remains unclear. Therefore, this study silenced the expression of COX-2 in hepatocytes and hepatic stellate cells in liver fibrosis rats by using short hairpin RNA. Then the changes of proliferation and apoptosis of HSCs and related gene expression profiles after COX-2 silencing were observed. Based on our experimental results, we found that COX-2 regulated the proliferation and apoptosis of activated hepatic stellate cells through the CDC27 pathway.
2. Materials and Methods
2.1. Animal Model
48 male SD rats (Nanjing Junke Bioengineering Co., Ltd.) were randomly divided into four groups by body weight: control group (control), liver fibrosis model group (model), null plasmid control group (sh-NC), and COX-2-shRNA-1 group (COX-2-shRNA-1). Except for the control group, the other 3 groups were fed a high-fat diet for 12 weeks after a week of adaptive feeding. Rats in the COX-2-shRNA-1 group and the sh-NC groups were injected with adenovirus plasmids and adenovirus no-load physique grains (PBS dilution) through the caudal vein from the beginning of the high-fat diet, respectively. The dose and time of injection were 1 × 10⁹ pfu/each and once weekly. Rats in the control group and the model group were given an equal volume of PBS through the caudal vein. After 12 weeks of rearing, the rats were sacrificed by caesarean section to take 0.5~1.5 g of the left lateral lobe of the rat liver and immediately put it into ice-cold William E medium filled with a mixed gas of 95% oxygen and 5% CO for subsequent experiments. This experiment had been approved by the Animal Management Committee of our hospital.
2.2. Reverse Transcription-PCR
Reverse transcription-PCR (RT-PCR) was used to detect the mRNA expression of COX-2, α-SMA, CDC27, Sh3kbp1, Serpinb2, cxcl10, Dusp6, Dusp1, TP53, and Phlcd4. Total RNA from each liver sample and HSCs was extracted by Trizol reagent (Generay Biotech, China), and cDNA was synthesized by using Revert Aid First Strand cDNA synthesis Kit (Ferramentas, Germany), according to the manufacturer’s instructions. PCR was performed under the manufacturer’s manual. Band intensity was measured by a densitometer and was normalized for comparison. RT-PCR was performed on target gene using specific primers (Table 1). GAPDH was selected as the internal reference gene. The expression level of gene was analyzed using the equation 2−ΔΔCT method, where ΔΔCT = ΔCTexperimental group − ΔCTcontrol group; ΔCTexperimental group = CTtarget gene,experimental group − CTinternal reference gene,experimental group; ΔCTcontrol group = CTtarget gene,control group − CTinternal reference gene,control group; and 2−ΔΔCT represents the multiple expression of gene in the experimental group relative to the control group.
| Gene | Primer | Sequences | Length (bp) |
|---|---|---|---|
| COX-2 |
|
|
420 |
| α-SMA |
|
|
292 |
| Serpinb2 |
|
|
142 |
| Cdc27 |
|
|
359 |
| Sh3kbp1 |
|
|
271 |
| Dusp1 |
|
|
171 |
| Dusp6 |
|
|
215 |
| TP53 |
|
|
134 |
| Cxcl10 |
|
|
170 |
| Plcd4 |
|
|
438 |
| GAPDH |
|
|
852 |
2.3. Immunohistochemistry
Liver tissues were fixed in 4% formaldehyde solution for 3 to 5 days. Then, tissues were removed from the fixative solution and trimmed to an appropriate shape and thickness. Tissues were dehydrated, transparented, and embedded in wax, then dewaxed with xylene and rehydrated with gradient alcohol. Three of the most important steps were blocking and inactivating endogenous peroxidase and performing antigen retrieval. Primary antibodies anti COX-2 and α-SMA were used and incubated overnight in a refrigerator at 4°C (PBS buffer solution instead of primary antibody as a negative control). The samples were transferred to room temperature and equilibrated for 30 minutes and rinsed with PBS for 3 × 5 minutes before adding a secondary antibody. The secondary antibody was incubated at 37°C for 15 minutes and rinsed with PBS for 3 × 5 minutes. DAB staining was used.
2.4. Culture of HSC Cell Lines
HSC cell lines (HSC-T6) were obtained from the American Type Culture Collection (ATCC) and were cultured at 37°C with 5% CO2 in a cell incubator. Cells were cultured in DMEM medium (Gibco, USA) supplemented with 10% fetal bovine serum (FBS) plus 1% 100 μg/ml penicillin/streptomycin. Cells were seeded in 6-well plates and grown to reach 70% confluence before transfection. For transfecting cells, cells were transfected with different plasmids using FuGENE HD Transfection reagent (Roche, Switzerland) following the manual instruction. Then, transfected cells were harvested for molecular assays.
2.5. Cell Transfection
shRNA targeting COX-2 (COX-2-shRNA) or CDC27 (sh-CDC27) were synthesized by Win Run Biotechnology Co, Ltd. (Changsha, China). The applied shRNA sequences for COX-2 were as follows: COX-shRNA-1, 5 ′-CCTCGTCCAGATGCTATCTTT-3 ′; COX-shRNA-2, 5 ′-AGTTCCAGTATCAGAACCGCATTGCCTCT-3 ′; and COX-shRNA-3, 5 ′-GACACCTTCAACATTGAAGACCAGGAGTA-3 ′. The applied shRNA sequences targeting CDC27 were 5 ′-CCGGGCCTATAACAGTGACTTGATTCTCGAGAATCAAGTCACTGTTATAGGCTTTTTTG-3 ′. According to the manufacturer’s protocol, HSC-T6 cells (5 × 10⁵) were seeded in 6-well plates, incubated for 24 h, and then 200 ng/ml specific shRNA or negative control (NC) was transfected into the cells by using Lipofectamine®2000 (Invitrogen; USA). Effects of the shRNA were evaluated by western blotting and RT-PCR. A fluorescence microscope was used to observe the expression of green fluorescent protein in cells to evaluate the fluorescence density.
2.6. MTT Assay
Cells were treated for 24 h, 48 h, and 72 h. Then, 5 mg/ml MTT solution (in PBS) was added into the basal medium at 1 : 10 ratio. After 4-hour incubation, the remaining MTT solution was removed, and cells were solubilized with dimethyl sulfoxide. Optical density (OD) values were measured at the wavelength of 490 nm to reflect cell viability: cell proliferation rate = (experimental group OD − control group OD)/(NC group OD − control group OD).
2.7. Flow Cytometry Assay
HSC-T6 cells were harvested after 48 h posttransfection. The culture medium was then changed into serum-free Hank’s balanced salt solution. Then, cells were rinsed in pre-cold PBS. Fluorescein isothiocyanate- (FITC-) conjugated Annexin V and propidium iodine (PI) staining buffer were sequentially added. Cell apoptosis was then measured on a flow cytometry (BD, USA).
2.8. Cell Cycle Assay
Cell cycle of HSC-T6 cells was monitored by flow cytometry. After 48 h posttransfection, all groups of HSC-T6 cells were digested by trypsin and were washed in precold PBS. Cells were fixed by 70% cold ethanol overnight and were resuspended in 100 μg/ml RNase A in PBS for 30 min incubation at 37°C. Cell nuclei were stained by 50 μg/ml PI for 30 min. Cell cycle was then measured on flow cytometry using fluorescent-assisted cell sorting (FACS).
2.9. DNA Microarray Assay and Data Analysis
Microarray-based oligonucleotide hybridization approach was used to quantify expression levels of target gene [4]. In brief, total RNA was obtained as mentioned above. Then, the obtained sample RNA was labeled by fluorescence and turned into DNA. The labeled DNA was dissolved in 80 μl hybridization solution (3 × SSC, 0.2% SDS, 5 × Denhart’s, and 25% formamide) and hybridized at 42°C overnight. After the hybridization is completed, it was first washed in a liquid containing 0.2% SDS and 2 × SSC at 42°C for 5 min and then washed in a 0.2 × SSC medium for 5 minutes in room temperature. After the slide is dried, it can be used for scanning. LuxScan 3.0 software (CapitalBio Corp., China) was used firstly to transform images into digital signals. Linear correction across chips was performed based on global mean values of cy5 and cy3 signals for normalization of means. All data from this experiment can be divided into three groups: (1) all data include the whole signal data set containing those with or without differential expressions, and ratio values were defined after Lowess normalization. (2) Checked genes include those genes with effective signals after assay. (3) Differentially expressed genes were screened out and annotated by pathway and GO database for functional assay and statistical analysis using Capital Bio software.
2.10. Western Blotting
Western blotting was used to quantify the expression of COX-2 and CDC27. In brief, rat hepatic tissues or cultured HSCs were lysed in RIPA buffer and proteins were quantified by BCA kit. About 20~40ug protein samples were loaded onto SDS-PAGE gel for electrophoresis separation and were transferred to PVDF membrane. After blocking, the membrane was incubated with primary antibody including rabbit anti-COX-2 (#12282, CST, USA), rabbit anti-CDC27 (#9499, CST, USA), and rabbit anti-β-actin (#4970, CST, USA) overnight. On the next day, HRP-conjugated secondary antibody was added for room temperature incubation for 2 h. The membrane was then developed by ECL substrate, and images were captured by a computerized system.
2.11. Statistics
All data were presented as the mean ± standard deviation (SD). The differences between two groups were analyzed using unpaired Student’s t-test. One-way ANOVA was used for multiple groups. A statistical significance was defined when p < 0.05. All statistical analyses was performed using SPSS18.0 software.
3. Results
3.1. COX-2 Expression in Each Group after Knocking Down COX-2
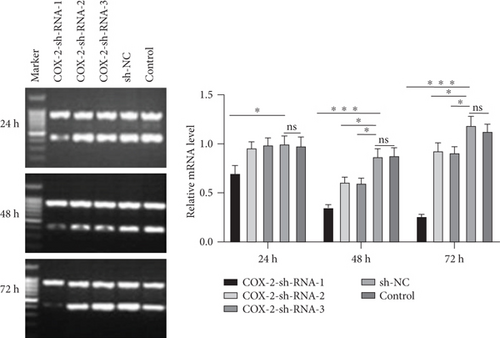
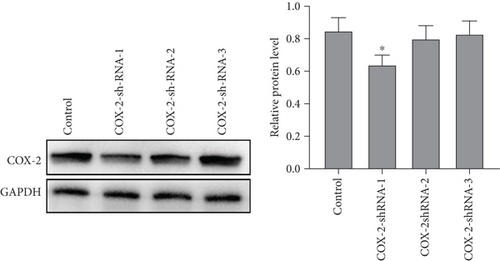
To evaluate the transfection efficiency of COX-2-shRNA, the fluorescence density of cells exceeded 70-85%, as observed by the fluorescent microscope (Figure 1(a)). No fluorescent signal was observed in the control group, indicating a successful cell transfection. All the three-specific shRNA of COX-2 downregulate the COX-2 expression after transfection of 48 hours and 72 hours, and the most significant effect was caused by COX-2-shRNA-1 (p < 0.001, Figure 1(b)). After transfection of 24 hours, COX-2 mRNA decreased in the COX-2-shRNA-1-transfected group (p < 0.05). Further analysis of the results showed that a remarkably decreased COX-2 protein expression in the COX-2-shRNA-1-transfected group at 48 h (p < 0.05) while the other two groups showed no major difference (Figure 1(c)). What emerges from the results reported here is that the construction of shRNA targeting COX-2 is successful and can be used for further experiments.

3.2. Knockdown of COX-2 Suppresses Proliferation of HSCs in Liver Tissue of Rats with Hepatic Fibrosis
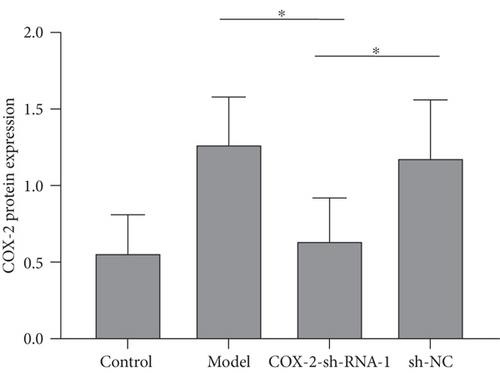
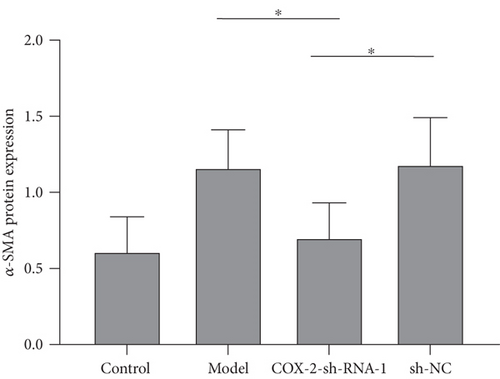
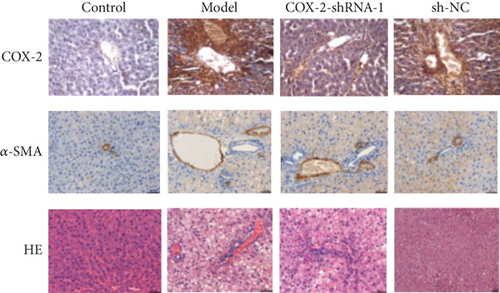
To investigate the effect of COX-2 on proliferation and apoptosis of HSCs in the liver tissue of rats with hepatic fibrosis, we firstly generated a rat model in which COX-2 nanomedicine-shRNA-1 was injected. As the first evidence to support COX-2 nanomedicine for liver fibrosis, western blotting showed that the expression level of COX-2 nanomedicine in liver fibrosis model rats was significantly increased, and it can be effectively inhibited by transfection with COX-2 nanomedicine-shRNA-1 (p < 0.05, Figure 2(a)). As the indicator of HSC proliferation, the expression patterns of α-SMA showed similarity with COX-2 nanomedicine, as shown by the elevated expression in the model group and the downregulated expression in the COX-2 nanomedicine-shRNA-1 group (p < 0.05, Figure 2(b)). Detection of COX-2 nanomedicine and α-SMA in liver tissues by immunohistochemistry indicated that the expression trends of COX-2 nanomedicine and α-SMA were consistent with the results of western blotting (Figure 2(c)). Taken together, these results suggest that knockdown of COX-2 nanomedicine suppresses proliferation of HSCs in the liver tissue of rats with hepatic fibrosis.
3.3. Cox-2-shRNA-1 Suppressed Proliferation and Induced Apoptosis of HSCs In Vitro
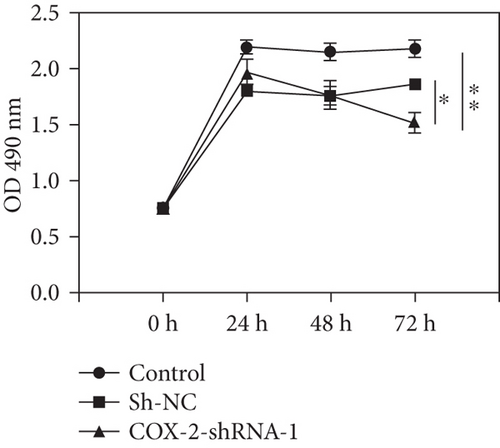
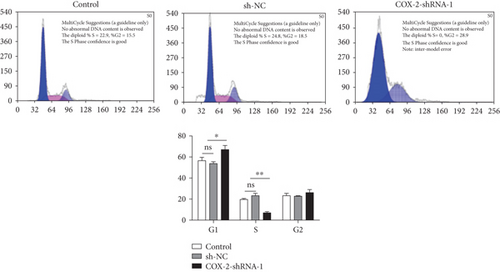
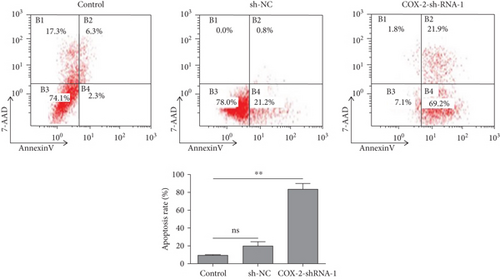
Next, we investigated the effect of COX-2 knockdown on hepatic cell proliferation and apoptosis in vitro. Cell proliferation was remarkably inhibited after transfection at 72 h as demonstrated by the MTT assay (p < 0.05, Figure 3(a)). Further analysis of the cell cycle revealed that knockdown of COX-2 increased the percentage of cells arresting at G1 phase (Figure 3(b)). Moreover, cell apoptotic rate in the COX-2-shRNA-1 group was found significantly higher by FACS (p < 0.01, Figure 3(c)). Overall, these results suggest that knockdown of COX-2 effectively suppressed hepatic stellate cell proliferation and accelerating their apoptosis.
3.4. Changes in Expression of Dynamic Genes of Hepatic Stellate Cells after Knockdown of COX-2
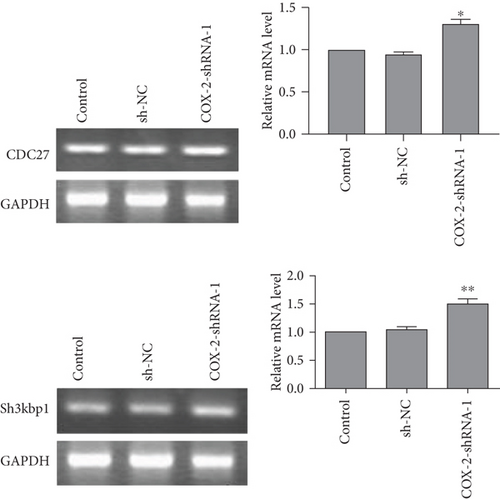
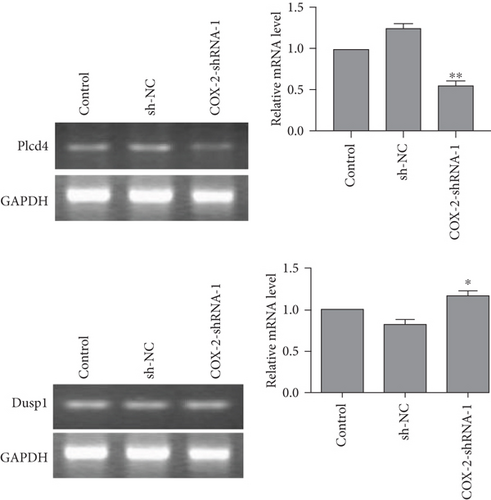
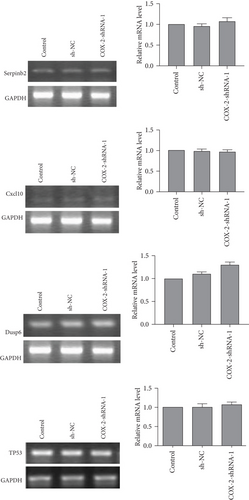
To further investigate the mechanism of COX-2 in regulating proliferation and apoptosis of hepatic stellate cells, gene chip assay was used to compare differential between the untreated and treated cells. Gene chip results showed that 37 genes were upregulated and 8 genes were downregulated after shRNA transfection with 48 hours (Table 2). Analysis of cells after 72 hours transfection showed that 50 genes in HSCs showed increased, while 46 genes showed decreased (Table 3). We also performed GO annotation on those differentially expressed genes, among which three proliferation-associated genes were upregulated (Il6, Csf2, and Atf3) at 48 h, but without any downregulated gene. At 72 h, three proliferation genes (CDC27, TP53, and Cxcl10) were unregulated and three genes (DUsp1, Serpinb2, and Plcd4) were downregulated. For all 8 genes associated with cell apoptosis, we found four of them (Il1b, Il6, Ccl2, and Phlda3) were upregulated at 48 h and without any gene down-regulated. At 72 h, Tp53 was upregulated while Sh3kbp1, Pea15, and Plcd4 were suppressed (Tables 1–3). Those genes with significant changes were further validated by RT-PCR. As the results demonstrated that COX-2-shRNA-1 elevated CDC27, but decreased the Plcd4 gene transcripts. However, opposite trends were observed as Sh3kbp1 was upregulated, plus DUsp1 upregulated, in sharp contrast with DNA chip assay (Figures 4(a) and 4(b)). No significant change was found in other candidate genes (Figure 4(c)). In summary, COX-2-shRNA-1 modulated the cell proliferation and apoptosis related to the change in the expression of CDC27 and Plcd4.
| Oligo_id | Name | Ratio | Description | |
|---|---|---|---|---|
| 1 | Rn30002068 | Ppef2 | 7.8223 | Protein phosphatase |
| 2 | Rn30009092 | — | 3.1274 | Immunoresponsive gene 1 |
| 3 | R001746_01 | Cxcl10 | 2.4468 | Small inducible cytokine B10 precursor |
| 4 | Rn30015483 | Gbp4 | 2.4271 | Similar to guanylate nucleotide-binding protein 4 |
| 5 | Rn30001057 | Oasl1 | 2.4164 | 2 ′-5 ′-Oligoadenylate synthetase-like 1 |
| 6 | Rn30004185 | — | 2.3045 | Antisense RNA overlapping MCH protein. |
| 7 | Rn30021148 | Ifit3 | 2.2743 | Tetratricopeptide repeat 3 |
| 8 | Rn30015485 | Gbp4 | 2.2279 | Similar to guanylate nucleotide-binding protein 4 |
| 9 | Rn30001055 | Oasl1 | 2.2037 | 2 ′-5 ′-Oligoadenylate synthetase-like 1 |
| 10 | Rn30020145 | — | 2.1558 | |
| 11 | R000595_01 | Cx3cl1 | 2.0349 | Chemokine (C-X3-C motif) ligand 1 |
| 12 | Rn30020616 | Cxcl11 | 1.9534 | Chemokine (C-X-C motif) ligand 11 |
| 13 | R001188_01 | Il1b | 1.9086 | Interleukin-1 beta precursor (IL-1 beta). |
| 14 | Rn30005625 | Mdm2 | 1.8729 | Similar to mdm2 gene product |
| 15 | Rn30024865 | isg12(b) | 1.8722 | Putative ISG12(B) protein. |
| 16 | Rn30016690 | Isg20 | 1.8707 | Interferon-stimulated protein (predicted) |
| 17 | Rn30021722 | Apol9a | 1.8058 | |
| 18 | Rn30005624 | Mdm2 | 1.767 | Similar to mdm2 gene product |
| 19 | R003548_01 | Kcnt1 | 1.7082 | Potassium channel subfamily T member 1 |
| 20 | Rn30015487 | Gbp5 | 1.6855 | Similar to guanylate-binding protein 5 |
| 21 | R003549_01 | Csf2 | 1.6817 | Colony-stimulating factor |
| 22 | R001026_01 | Atf3 | 1.665 | Cyclic AMP-dependent transcription factor ATF-3 |
| 23 | Rn30004011 | Scin | 1.6441 | Scinderin |
| 24 | R001191_01 | Il6 | 1.6382 | Interleukin-6 |
| 25 | Rn30015486 | Gbp5 | 1.6332 | Similar to guanylate-binding protein 5 |
| 26 | Rn30008444 | Ifi27l | 1.6328 | Putative ISG12(a) protein |
| 27 | Rn30008951 | Elovl4 | 1.6118 | Similar to Elovl4 |
| 28 | Rn30016019 | Irf7 | 1.5875 | Interferon regulatory factor 7 |
| 29 | R002891_01 | Cyp2d4v1 | 1.573 | Cytochrome P450 2D18 |
| 30 | Rn30001796 | Mx2 | 1.5626 | Interferon-induced GTP-binding protein Mx3. |
| 31 | R000644_01 | Ccl2 | 1.5596 | Chemokine (C-C motif) ligand 2 |
| 32 | Rn30023693 | — | 1.5285 | — |
| 33 | Rn30026248 | — | 1.528 | Macrophage inflammatory protein 2-beta precursor |
| 34 | Rn30016526 | Ccdc37 | 1.5222 | Similar to C230069K22Rik protein |
| 35 | Rn30012826 | Aadac | 1.5185 | Arylacetamide deacetylase |
| 36 | Rn30001056 | Oasl2 | 1.5141 | 2 ′-5 ′-Oligoadenylate synthetase-like 2 |
| 37 | Rn30008269 | Phlda3 | 1.502 | Pleckstrin homology-like domain family A member 3 |
| 38 | R003539_01 | Mapk8ip1 | 0.6656 | C-Jun-amino-terminal kinase-interacting protein 1 |
| 39 | Rn30026086 | — | 0.6545 | Ankyrin repeat domain 11 |
| 40 | Rn30018744 | Ptov1 | 0.6483 | Prostate tumor overexpressed gene 1 |
| 41 | Rn30003851 | Sh3kbp1 | 0.6376 | SH3-domain kinase binding protein 1 |
| 42 | Rn30001871 | — | 0.6282 | Steroid-sensitive protein 1 |
| 43 | R002280_01 | Thra_v2 | 0.6144 | Thyroid hormone receptor alpha |
| 44 | R002312_01 | Pla2g2a | 0.512 | Phospholipase A2, membrane-associated precursor |
| 45 | Rn30001610 | 0.4945 | Leucine-rich repeats and calponin homology (CH) domain containing 3 |
| Oligo_id | Name | Ratio | Description | |
|---|---|---|---|---|
| 1 | Rn30022454 | — | 6.1452 | Tripartite motif-containing 65 |
| 2 | Rn30006362 | Purb | 3.4474 | |
| 3 | R001746_01 | Cxcl10 | 2.8634 | Small inducible cytokine B10 precursor |
| 4 | Rn30020145 | — | 2.652 | |
| 5 | Rn30001057 | Oasl1 | 2.6028 | 2 ′-5 ′-Oligoadenylate synthetase-like 1 |
| 6 | Rn30005291 | Cdc27 | 2.4796 | Cell division cycle 27 homolog |
| 7 | Rn30006471 | — | 2.3552 | PFTAIRE protein kinase 1 |
| 8 | Rn30015483 | Gbp4 | 2.3519 | Similar to guanylate nucleotide-binding protein 4 |
| 9 | Rn30021673 | — | 2.3392 | ¨C |
| 10 | R000595_01 | Cx3cl1 | 2.3344 | Fractalkine precursor |
| 11 | Rn30001055 | Oasl1 | 2.3048 | 2 ′-5 ′-Oligoadenylate synthetase-like 1 |
| 12 | Rn30002812 | Enah | 2.2328 | Enabled homolog |
| 13 | Rn30018127 | — | 2.2025 | Diaphanous homolog 1 |
| 14 | Rn30024865 | isg12(b) | 2.2007 | Putative ISG12(B) protein |
| 15 | Rn30025470 | — | 2.1365 | RNA-binding motif protein 27 |
| 16 | Rn30025880 | — | 2.0773 | Topoisomerase (DNA) II beta-binding protein |
| 17 | Rn30021148 | Ifit3 | 2.0594 | Human interferon-inducible proteins |
| 18 | Rn30002530 | Rfc1 | 2.035 | VIP-receptor-gene repressor protein |
| 19 | Rn30006955 | — | 1.9683 | Peptidyl-prolyl cis-trans isomerase G |
| 20 | Rn30024339 | Gbf1 | 1.9515 | Golgi-specific brefeldin A-resistance factor 1 |
| 21 | Rn30015485 | Gbp4 | 1.9459 | Similar to guanylate nucleotide-binding protein 4 |
| 22 | Rn30009903 | Trp53 | 1.8363 | Cellular tumor antigen p53 |
| 23 | Rn30010375 | — | ||
| 24 | Rn30006914 | Loxl3 | 1.7087 | Similar to lysyl oxidase-like 3 |
| 25 | Rn30018257 | Hsp90ab1 | 1.7047 | Heat shock protein HSP 90-beta (HSP 84). |
| 26 | Rn30016830 | Chd4 | 1.6964 | Mi-2 autoantigen |
| 27 | Rn30021722 | Apol9a | 1.6932 | ¨C |
| 28 | Rn30015487 | Gbp5 | 1.6803 | Similar to guanylate-binding protein 5 |
| 29 | Rn30009073 | — | 1.6721 | ¨C |
| 30 | Rn30008992 | — | 1.6509 | WAS protein family, member 2 |
| 31 | Rn30017948 | Psmb10 | 1.6478 | Proteasome subunit, beta type 10 |
| 32 | Rn30005283 | — | 1.644 | Rap1 interacting factor 1 homolog (yeast) |
| 33 | Rn30019336 | Pogz | 1.6139 | Pogo transposable element with ZNF domain |
| 34 | Rn30023995 | NIPBL | 1.6115 | PREDICTED: similar to delangin |
| 35 | Rn30021836 | Olr1214 | 1.5675 | Olfactory receptor Olr1214 |
| 36 | R003169_01 | Acsl6 | 1.5651 | Long-chain-fatty-acid–CoA ligase 6 |
| 37 | R004194_01 | Zfp709 | 1.565 | Zinc finger protein 14 |
| 38 | Rn30004337 | RGD1565597 | 1.5561 | Similar to RIKEN cDNA 2210421G13 |
| 39 | Rn30007454 | — | 1.5487 | Complement receptor 2 |
| 40 | Rn30003220 | — | 1.545 | 13-day embryo male testis cDNA |
| 41 | Rn30015924 | Trub1 | 1.5415 | TruB pseudouridine (psi) synthase homolog 1 |
| 42 | Rn30019481 | Gabpb2 | 1.5354 | Transcription factor GABP beta 2-1 chain |
| 43 | Rn30009011 | RGD1305500 | 1.5248 | DNA segment, Chr 19, ERATO Doi 737 |
| 44 | Rn30015486 | Gbp5 | 1.5204 | Guanylate-binding protein 5 |
| 45 | Rn30015488 | — | 1.5197 | Guanylate nucleotide-binding protein 2 |
| 46 | R002891_01 | Cyp2d4v1 | 1.5187 | Cytochrome P450 2D18 |
| 47 | Rn30016434 | — | 1.5155 | RGD1310888-predicted protein |
| 48 | Rn30001002 | — | 1.5108 | |
| 49 | R001164_01 | — | 1.5085 | Granzyme M precursor |
| 50 | Rn30023011 | — | 1.5073 | |
| 51 | Rn30000745 | Hspa1b | 0.6661 | Heat shock 70 kDa protein 1A/1B |
| 52 | Rn30010844 | — | 0.6653 | |
| 53 | R002646_01 | — | 0.665 | |
| 54 | Rn30013433 | Med31 | 0.6623 | RNA polymerase II transcription subunit 31 |
| 55 | Rn30003203 | Dynlt3 | 0.6605 | T-complex-associated testis-expressed 1-like |
| 56 | Rn30022044 | — | 0.6596 | — |
| 57 | Rn30003825 | Nt5c1b | 0.6581 | Retinol dehydrogenase 14 |
| 58 | Rn30025065 | P4ha2 | 0.6576 | Procollagen-proline, 2-oxoglutarate-4-dioxygenase, alpha II polypeptide |
| 59 | Rn30000745 | Hspa1b | 0.6555 | Heat shock 70 kDa protein 1A/1B |
| 60 | Rn30019963 | — | 0.6548 | — |
| 61 | Rn30005770 | Ero1l | 0.6482 | ERO1-like protein alpha precursor |
| 62 | Rn30024141 | — | 0.6465 | ¨C |
| 63 | Rn30019903 | Rassf1 | 0.6464 | Ras association domain family 1 isoform 2 |
| 64 | Rn30003533 | Dusp1 | 0.6461 | Dual specificity protein phosphatase 1 |
| 65 | Rn30020658 | RGD1563649 | 0.6446 | Similar to ORF4 |
| 66 | Rn30006166 | Pea15a | 0.6435 | Phosphoprotein enriched in astrocytes 15 |
| 67 | Rn30012217 | Arg1 | 0.6427 | Arginase-1 (EC 3.5.3.1) |
| 68 | Rn30023334 | — | 0.6392 | |
| 69 | Rn30023867 | Rnase1l2 | 0.6379 | |
| 70 | Rn30002222 | Pgk1 | 0.6341 | Phosphoglycerate kinase 1 |
| 71 | R002211_01 | Aldoc | 0.6301 | Fructose-bisphosphate aldolase C |
| 72 | Rn30002683 | RGD1560553 | 0.6288 | PREDICTED: similar to hypoxia-induced gene 1 |
| 73 | Rn30018943 | — | 0.6233 | DNA-3-methyladenine glycosylase |
| 74 | Rn30006243 | — | 0.619 | |
| 75 | Rn30025357 | — | 0.6154 | |
| 76 | Rn30000745 | Hspa1b | 0.6086 | Heat shock 70 kDa protein 1A/1B |
| 77 | Rn30003851 | Sh3kbp1 | 0.6013 | SH3-domain kinase binding protein 1 |
| 78 | Rn30000745 | Hspa1b | 0.5944 | Heat shock 70 kDa protein 1A/1B |
| 79 | Rn30005084 | LOC499742 | 0.5851 | LRRGT00150. |
| 80 | Rn30000745 | Hspa1b | 0.5848 | Heat shock 70 kDa protein 1A/1B |
| 81 | Rn30015841 | Bnip3 | 0.581 | BCL2/adenovirus E1B-interacting protein 3 |
| 82 | Rn30014271 | RGD1559815 | 0.5793 | Da1-12 |
| 83 | Rn30000745 | Hspa1b | 0.5732 | Heat shock 70 kDa protein 1A/1B |
| 84 | Rn30000745 | Hspa1b | 0.5731 | Heat shock 70 kDa protein 1A/1B |
| 85 | Rn30000745 | Hspa1b | 0.5706 | Heat shock 70 kDa protein 1A/1B |
| 86 | Rn30000745 | Hspa1b | 0.5699 | Heat shock 70 kDa protein 1A/1B |
| 87 | Rn30026196 | Hist1h4m | 0.5511 | Histone H4. |
| 89 | Rn30000745 | Hspa1b | 0.545 | Heat shock 70 kDa protein 1A/1B |
| 90 | Rn30024135 | LOC499698 | 0.5425 | C-reactive protein precursor. |
| 91 | Rn30000745 | Hspa1b | 0.5364 | Heat shock 70 kDa protein 1A/1B |
| 92 | Rn30015672 | Car9 | 0.51 | Similar to carbonic anhydrase 9 |
| 93 | Rn30004468 | Upp1 | 0.4769 | Uridine phosphorylase 1 |
| 94 | Rn30014956 | Plcd4 | 0.4744 | Phospholipase C, delta 4 |
| 95 | R001854_01 | Ccl20 | 0.4709 | Small inducible cytokine A20 precursor |
| 96 | Rn30022206 | Dusp6 | 0.4411 | Dual specificity protein phosphatase 6 |
3.5. COX-2-shRNA-1 Regulated the Proliferation and Apoptosis of HSCs through Regulating CDC27
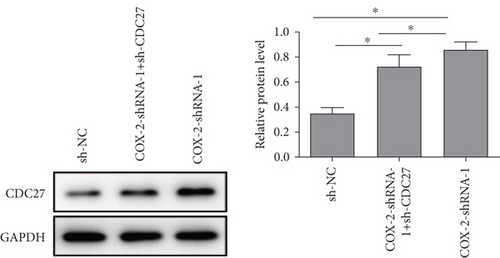
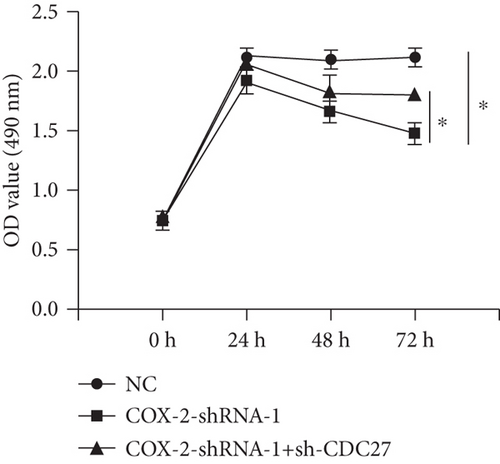
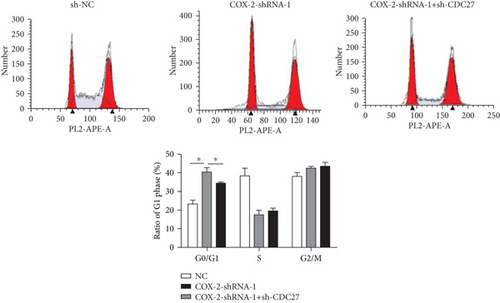
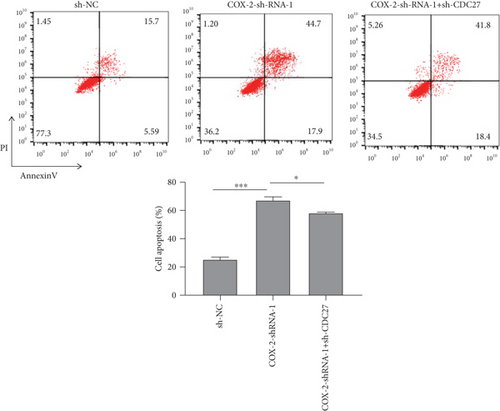
CDC27 has been demonstrated in modulating cell proliferation [7] and apoptosis of tumor cells [8]. Therefore, we speculate that COX-2 may affect cell proliferation and apoptosis by affecting CDC27. Our conjecture was confirmed by the results that knockdown of COX-2 significantly elevated the protein level of CDC27, and this can be attenuated by knockdown of CDC27 (Figure 5(a)). The role of CDC27 on hepatic stellate cell proliferation was further investigated. Compared with the COX-2-shRNA-1 group, increased cell proliferation in the COX-2-shRNA-1+ sh-CDC27 group indicated the proproliferation effect of CDC27 (Figure 5(b)). In the previous results, knockdown of COX-2 induced more cells to arrest in G0/G1 phase, but on this basis, knockdown of CDC27 showed a weakened effect (Figure 5(c)). Cotransfection of CDC27-shRNA and COX-2-shRNA-1 decreased the cell apoptotic rate when compared with the COX-2-shRNA-1 group, suggesting that knockdown of CDC27 attenuated the proapoptotic effect of COX-2-shRNA-1 in HSCs (Figure 5(d)). What emerges from the results reported in the above is that COX-2 knockdown suppressed proliferation and accelerated apoptosis via activating CDC27 expression in HSCs.
4. Discussion
The primary effector cell in hepatic fibrosis is the HSCs [9]. HSCs are activated and transformed from quiescent to activated when the liver is damaged by mechanical stimulation or the inflammation. Activated HSCs have a strong ability to synthesize extracellular matrix, then leading to the formation of liver fibrosis or cirrhosis. Therefore, inhibiting the proliferation of HSCs and promoting its apoptosis have become the main strategy to treat liver fibrosis [10].
Previous studies have shown that COX-2 may be involved in the development of hepatic fibrosis by regulating the proliferation and apoptosis of HSCs [4]. SC-236 was used to prevent the occurrence of carbon tetrachloride-induced hepatic fibrosis in rats, which is mainly related to its regulation on the apoptosis and proliferation of HSCs [4]. However, the side effect of COX-2 inhibitors such as cardiovascular events or gastrointestinal bleeding limits its wide application [11]. Therefore, the nucleotide-based inhibitor for gene expression has been raised as a novel treatment approach. RNA interference (RNAi), a phenomenon of posttranscriptional gene silencing (PTGS), provides new insights for treating liver fibrosis [12]. Previous experiments showed that COX-2-shRNA-1 can effectively treat experimental liver fibrosis [3].
In this study, we found that knockdown of COX-2 effectively suppressed the proliferation of HSCs in the liver of rats with hepatic fibrosis, which has been proved by the decrease in α-SMA and the number of α-SMA immune-positive cells. More clearly, knockdown of COX-2 suppressed proliferation and facilitated apoptosis of HSCs. Our results were consistent with most literature reports [1, 6]. We argue that the regulation of COX-2 on HSC cell behavior might be the primary mechanism of it in hepatic fibrosis pathogenesis.
For the further evidences of COX-2 in regulating hepatic fibrosis, we employed mRNA microarray assay to examine the expression of a series of proliferative and apoptotic relative genes. Knockdown of COX-2 in HSCs leads to some cell proliferation genes to change; some of them upregulated, such as Il6, Csf2, Atf3, Cdc27, Tp53, and Cxcl10; and some of them downregulated including Dusp1, Serpinb2, and Plcd4. As for the apoptotic related genes, upregulation of Il1b, Il6, Ccl2, Phlda3, and Tp53 and downregulation of Sh3kbp1, Peal5, and Plcd4 genes were demonstrated. Sh3kbp1 gene may regulate various cell behaviors [13], and Plcd4 gene expression was associated with breast cancer cell proliferation [14]; CXCL10 induced cell proliferation and apoptosis [15, 16]. After silencing the COX-2 gene in HSCs, the expression of CDC27 is enhanced, which is the only gene with consistent results in DNA chips and RT-PCR. CDC27 was previously reported to facilitate proliferation [7]. It has potent protein binding affinity [8, 17] and participates in various biological processes including ubiquitination mediated proteolysis [18], cell cycle regulation [19], cell division [20], and transformation at metaphase of mitosis [21, 22]. In this study, we found that CDC27 knockdown could accelerate HSC proliferation and inhibit cell apoptosis, indicating that RNAi silencing of COX-2 could modulate HSCs growth, inhibit cell proliferation, and induce cell apoptosis via CDC27 upregulation. Moreover, CDC27 has been postulated to be one major target for induced cell apoptosis and cell cycle arrest in cancer cells [23]. The expression of COX-2 and CDC27 has been associated during immune response regarding macrophage proliferation [24]. This study, on the other hand, revealed the regulation of CDC27 gene expression by COX-2 knockdown, suggesting that CDC27 exerted its role at the downstream of COX-2. Our data thus provide the first-hand information on how COX-2 regulates HSC proliferation, cell cycle, and cell apoptosis by regulating CDC27 gene expression, revealing an unknown pathway of HSC behavior. However, the detailed molecular mechanism for COX-2 regulation on CDC27 gene expression is still unclear yet and thus requires further mechanistic studies to fulfill the weakness of the current study.
In summary, the current study described the regulation of HSC proliferation and apoptosis by COX-2/CDC27 axis and found that such regulatory pathway played important roles in mediating severity of hepatic fibrosis. Our overall findings provide a promising treatment target for early intervention of liver fibrosis.
Ethical Approval
All animal procedures were approved by the Institutional Animal Care and Use Committee of University of South China (2011002A), Hengyang, China.
Conflicts of Interest
The authors declare no conflict of interest, financial, or otherwise.
Authors’ Contributions
Yang Hu designed the experiments. Yang Hu, Li Xian Chen, and Nian Fu performed the experiments and analyzed the date. Yang Hu wrote the manuscript. Jian Hua Xiao and Xue Feng Yang have modified the language expression of the article. All authors have read and approved the manuscript.
Acknowledgments
This study was funded by the Scientific Research Project of Hunan Provincial Health and Family Planning Commission (No. A2017015), the Hunan Provincial Union Fund for Natural Science and Cities (No. 2016JJ5010), the financial support from the Program for Hunan Provincial Science and Technology Department (No. 2018DK51707), and the National Natural Science Foundation of China (No. 81373465).
Open Research
Data Availability
The datasets used and/or analyzed during the current study are available from the corresponding author on reasonable request.


