Crack Identification Method of Steel Fiber Reinforced Concrete Based on Deep Learning: A Comparative Study and Shared Crack Database
Abstract
As a common disease of concrete structure in engineering, cracks mainly lead to durability problems such as steel corrosion, rain erosion, and protection layer peeling, and then the building gets destroyed. In order to detect the cracks of concrete structure in time, the bending test of steel fiber reinforced concrete is carried out, and the pictures of concrete cracks are obtained. Furthermore, the crack database is expanded by the migration learning method and the crack database is shared on the Baidu online disk. Finally, a concrete crack identification model based on YOLOv4 and Mask R-CNN is established. In addition, the improved Mask R-CNN method is proposed in order to improve the prediction accuracy based on the Mask R-CNN. The results show that the average prediction accuracy of concrete crack identification is 82.60% based on the YOLO v4 method. The average prediction accuracy of concrete crack identification is 90.44% based on the Mask R-CNN method. The average prediction accuracy of concrete crack identification is 96.09% based on the improved Mask R-CNN method.
1. Introduction
Nowadays, the concrete crack detection is mainly through manual identification [1, 2]. The manual detection method is not only time consuming but also requires a lot of energy from the relevant detection personnel [3, 4]. There are some problems such as low detection accuracy and subjectivity of operators [5, 6]. In addition, cracks in some special areas cannot be detected manually, such as bridge piers, mountainous areas, and high-risk urban areas [7, 8]. These cracks, which are difficult to detect, may cause structural weakness, leading to ductile failure and brittle failure, leading to serious safety accidents [9, 10].
In recent years, the deep learning method has been widely used in the field of civil engineering and has attracted the attention of many researchers [11]. Hinton et al. [12] proposed the deep learning model for the first time. The result showed that the artificial neural network with multiple hidden layers optimizes the network through layer by layer initialization, realizes feature learning, and opens a new era of deep learning. Krizhevsky et al. [13] designed the AlexNet algorithm, which is the first deep neural network model established by convolutional neural network. Girshick [14] proposed a new algorithm based on R-CNN and SPPNet: fast R-CNN. The result showed that the speed and accuracy have been improved, but there is still a long way to go from real end-to-end processing. Ren et al. [15] proposed fast R-CNN algorithm based on fast R-CNN network model and regional recommendation network, which achieved 78.8% detection accuracy on VOC2007 dataset. Lin et al. [16] designed the feature pyramid network according to the different semantic and target location of different feature maps, which has certain advantages in small target detection. Redmon et al. [17] proposed a regression problem that unifies the classification regression problem into a coordinate frame, that is, Yolo algorithm. The results show that Yolo algorithm has very fast detection speed, but its accuracy is lower than that of the existing R-CNN series algorithm model, and the detection effect is poor when the object is small. Du et al. [18] proposed a new method to detect severe vehicle occlusion, which can be applied to aerial images of weak infrared camera with complex field background. Yu et al. [19] proposed the Mask R-CNN fruit detection model. The results show that the average detection accuracy is 95.78%, the recall rate is 95.41%, and the average intersection rate of instance segmentation is 89.85%. Pang et al. [20] proposed a segmented crack defect segmentation method, which solved the problems of uneven brightness and high noise of dam concrete surface image. Yu et al. [21] proposed a deep learning model YOLOv4-FPM based on the YOLOv4 model. The results show that the average accuracy of YOLOv4-FPM is 0.064 higher than that of original YOLOv4.
This paper takes steel fiber reinforced concrete as the research object, obtains concrete crack pictures through bending test, and expands the crack database based on the transfer learning method. Based on the deep learning algorithm, an automatic crack detection model is established, that is, YOLOv4 and Mask R-CNN. Furthermore, an improved Mask R-CNN concrete crack identification model is proposed based on the Mask R-CNN model.
2. Image Acquisition and Processing
2.1. Materials
Portland cement (42.5) was produced by China United Cement Group Co., Ltd., and its main components are shown in Table 1. Xiamen ISO standard sand is adopted. Steel fiber is a flat copper plated steel fiber with diameter of 0.2 mm and length of 13 mm. Distilled water was used.
| Materials | Chemical composition (mass ratio (%)) | |||||||
|---|---|---|---|---|---|---|---|---|
| CaO | SiO2 | Al2O3 | Fe2O3 | MgO | K2O | SO3 | CaO | |
| Cement | 65.87 | 21.62 | 5.49 | 4.08 | 0.81 | 0.85 | 1.28 | 65.87 |
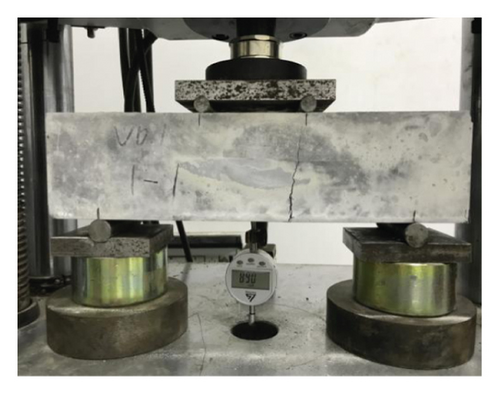
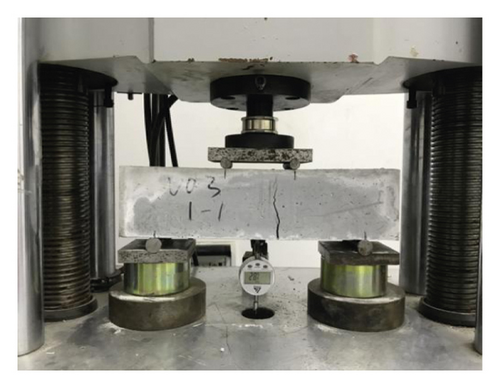
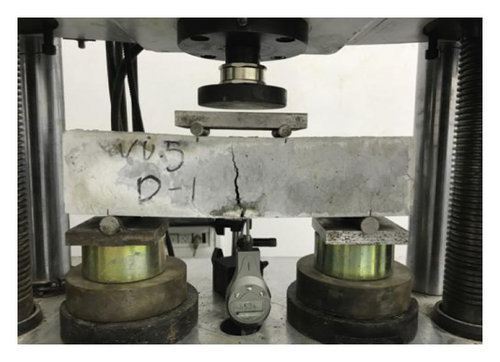
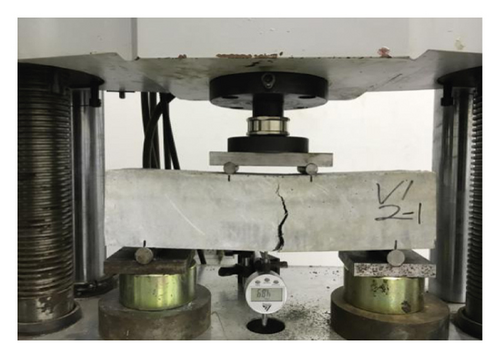
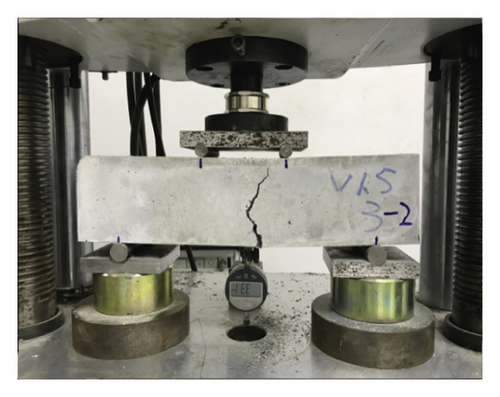
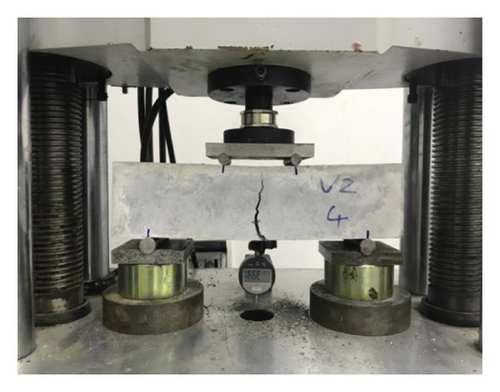
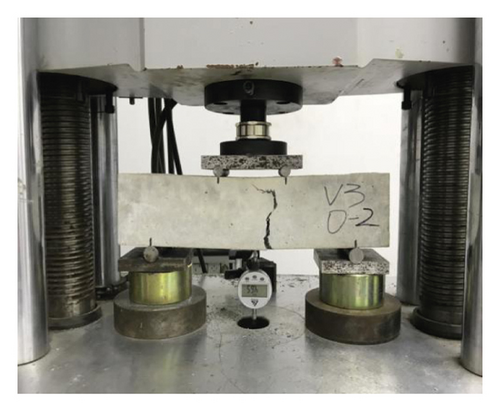
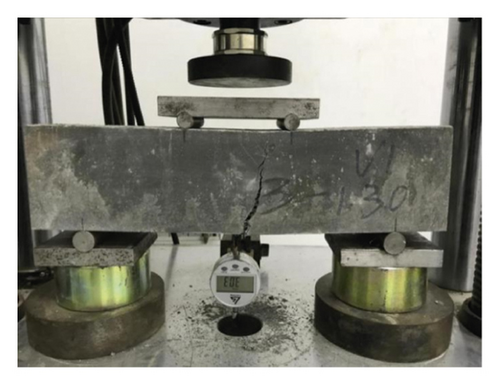
Steel fiber concrete with fixed water binder ratio and limestone ratio of 0.4 and 1 : 2 was prepared. In this experiment, 10 batches of steel fiber mortar specimens were prepared, which were 0.1%, 0.3%, 0.5%, 1%, 1.5%, 2%, and 3%, respectively. Each batch was divided into five groups according to the vibration time of 0.5 min, 1 min, 1.5 min, 2 min, and 2.5 min. Firstly, sand and cement are added to dry mix for 1-2 minutes. After mixing evenly, 90% and 10% water are added in turn. When the cementitious material is gradually formed, steel fibers are evenly sprinkled and fully stirred to avoid fiber polymerization at one place of the test block. After the specimen is vibrated, it is placed in the room for 24 hours before demoulding and soaking in water for curing. At the same time, ensure that the water level overflows the specimen. The curing time of the specimens was 90 days. The specimens were dried at room temperature for 12 hours in advance. The concrete bending test is carried out with the size of 100 mm × 100 mm × 400 mm prism specimen. Specifically, the effective span of the beam is 300 mm, the beam height is 100 mm, and the beam width is 100 mm. Based on the CECS 13-2009 standard, the bending test of fiber-reinforced concrete is carried out, and then the pictures of concrete cracks are obtained. Figure 1 shows the initial and final crack pictures of different steel fiber reinforced concrete.
2.2. Image Preprocessing
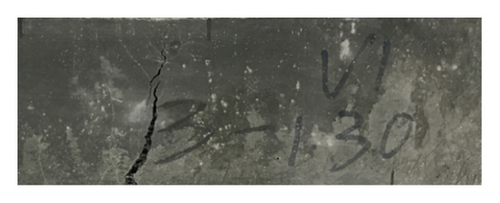
Because the resolution of the original image is too large, the calculation cost will be too high if the original image is directly input [22]. Therefore, the original image will be cropped to include only the concrete test block image, which is also conducive to better learning the defect features of the model, as shown in Figure 2.
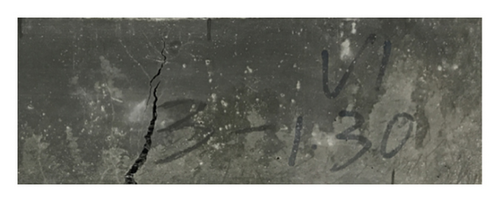
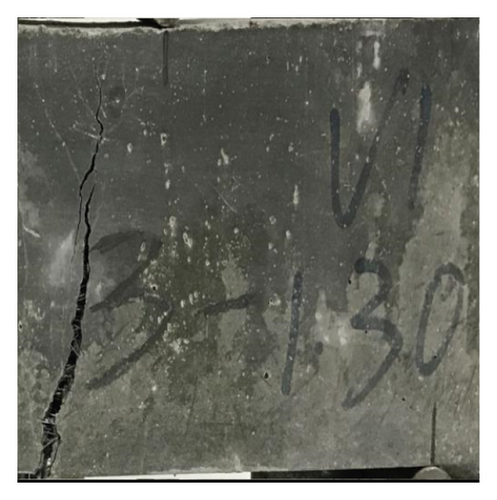
The image input model is transformed into a vector matrix to enter the network, and the latitude of the vector is fixed, so the resolution should be adjusted [23]. In this paper, the image is adjusted to 512 × 512 size, as shown in Figure 3.
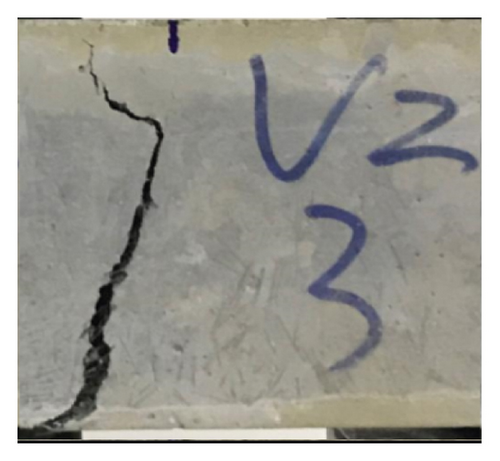
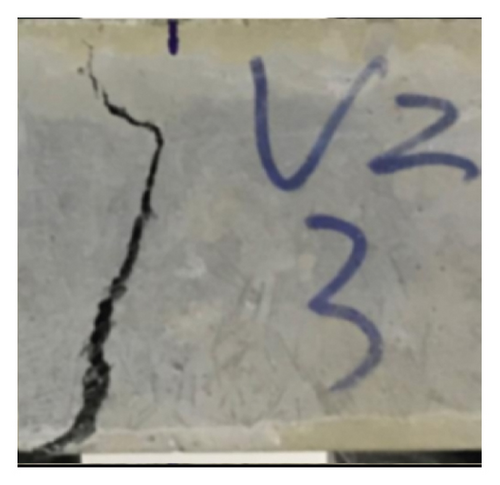
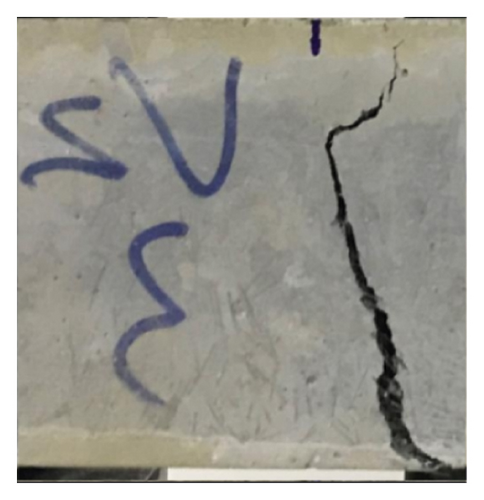
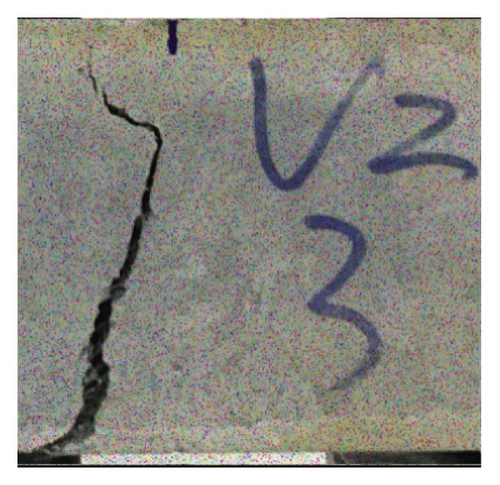
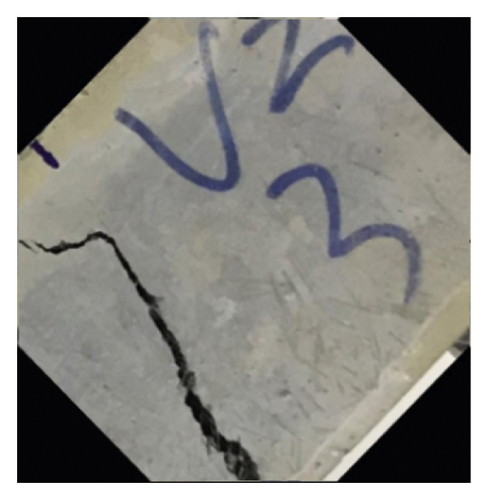
Due to the experimental limitations, it is impossible to make enough sample data, so the crack data are enhanced to improve the robustness and generalization ability of the training model [24]. Rotating, blurring, flipping, and noise adding can be seen in Figure 4. Specifically, rotation refers to rotating the image randomly by an angle of 45, 90, and 180 degrees; flipping refers to rotating the image along the horizontal X axis or vertical Y axis; blurring refers to blurring the image; and adding noise refers to adding salt and pepper noise or Gaussian noise into the crack image. Finally, there are 1200 crack images as the training dataset, 400 crack images as the validation dataset, and 400 crack images as the test dataset.
3. Deep Learning Method
3.1. Model of Object Detection Algorithm for YOLOv4
YOLOv4 model’s parameters are as follows: (1) epoch = 100, that is, 1200 crack image data are trained for 100 times; (2) batch size = 16, that is, one round of 16 image data samples is used for model training; (3) iterations = 75, that is, 1200 pictures, 16 pictures are extracted each time, and there are 75 groups in total, i.e., one epoch is completed; (4) learning rate = 10−5; and (5) momentum = 0.9.
3.2. Model of Object Detection Algorithm for Mask R-CNN
He et al. [28] proposed the Mask R-CNN algorithm model to complete the task of target detection combined with instance segmentation, and at the same time, the target was segmented at the pixel level, which can be seen in Figure 5.
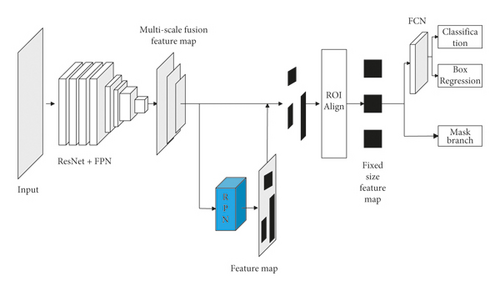
Mask R-CNN model’s parameters are as follows: (1) epoch = 100; (2) batch size = 4; (3) iterations = 300; (4) learning rate = 10−5; and (5) momentum = 0.9.
3.3. Model of Object Detection Algorithm for Improved Mask R-CNN
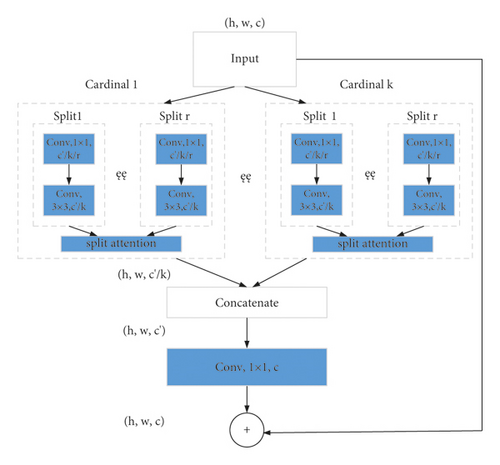
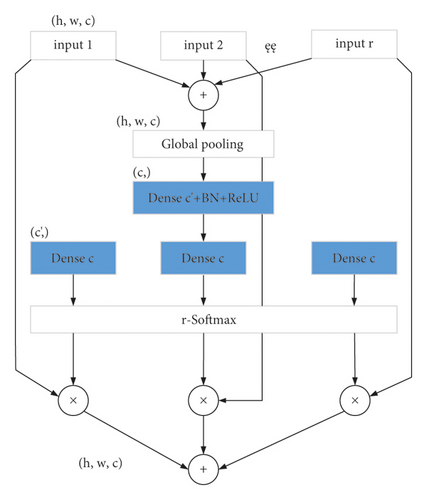
In order to improve the accuracy of classification and location, the Mask R-CNN algorithm in the crack detection model is improved, which mainly improves the backbone network and enhances its feature expression ability. The main network of Mask R-CNN algorithm in the crack detection model is composed of residual network and feature pyramid network [32]. Based on the repeat layer strategy network of residual network, k−1 cardinal numbers are added to each module. After splitting, the cardinal numbers are decentralized. Each cardinal number is summed and fused by multiple segmentation elements to get the output of feature graph: h, w, and c. In the Cardinal layer, the (1 × 1) network is convoluted into (3 × 3). (3 × 3) The input of the base array is divided into r scattered blocks, and each scattered block is transformed into the distraction module [33]. The elements are added one by one, and the feature graph is fused into the output dimension: h × w × c. Then, the fusion feature map is pooled globally, and the image spatial dimension is compressed to output dimension c’. The dense c in the weight graph of each scattered block is calculated based on Softmax. The module input characteristic graph and its weight are multiplied to get the cardinality group, and then the output dimension h × w × c is weighted and fused [34]. Distractor fuses the corresponding weights calculated from the scatter block feature graph to form ResNeSt unit module, which can be seen in Figure 6.
3.4. Evaluating Indicator
4. Calculation Results
4.1. Detection Results of YOLOv4
Figure 7 shows the calculation results based on the YOLOv4. The results show that the overall effect of YOLOv4 algorithm in crack detection is better, and the main reason for higher detection accuracy is that the image interference is low, and the object features are relatively simple. It can be seen from Figure 7(a) that the YOLOv4 model has carried out error detection on jamming objects. One is to detect the jamming items as cracks, and the other is to detect the jamming items as substitute numbers. The same error detection occurs in Figure 7(b), but the detection accuracy of other categories is high, which shows that the model has strong robustness.
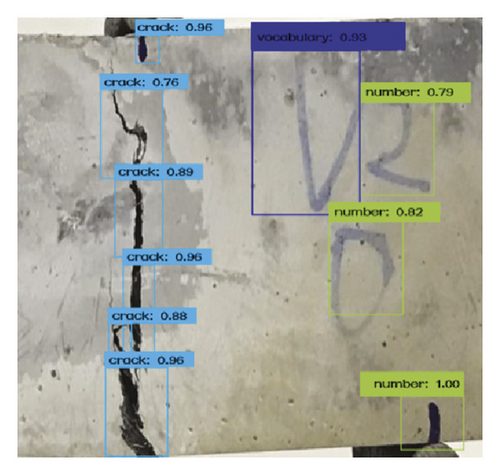
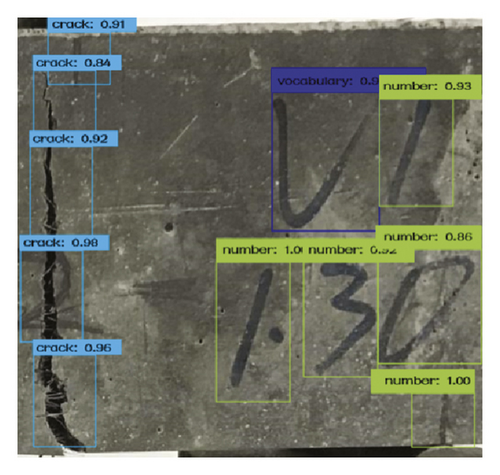
Furthermore, the detection accuracy and average accuracy of each category are calculated, and the results are shown in Table 2.
| Model | Average precision | F1 (%) | ||
|---|---|---|---|---|
| Crack AP (%) | Number AP (%) | Vocabulary AP (%) | ||
| YOLOv4 | 73.81 | 84.42 | 87.96 | 82.60 |
4.2. Detection Results of Mask R-CNN
Figure 8 shows the calculation results based on Mask R-CNN. Figure 8 shows that the effect of fracture prediction is good, and the accuracy of model detection is still insufficient compared with the other two types. For example, it is difficult to detect and segment the two ends of the crack in the image, which is due to the strong background interference of the predicted image.
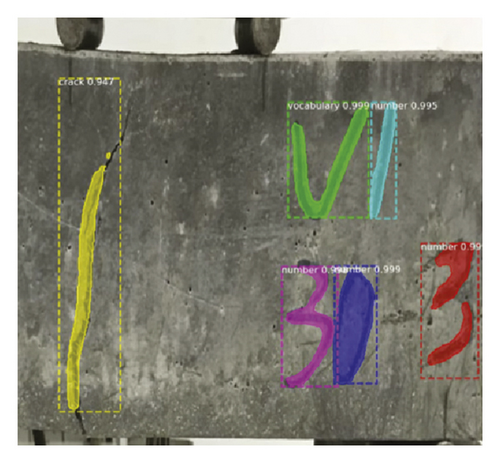
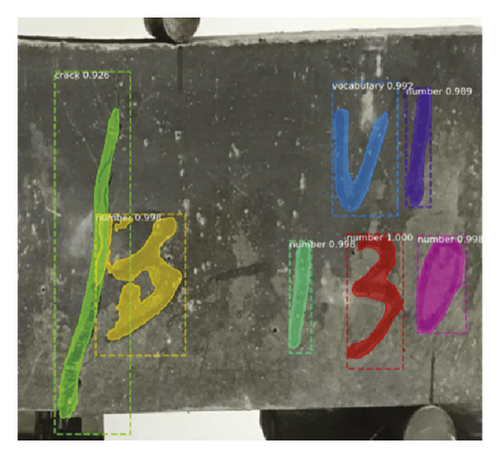
Furthermore, the detection accuracy and average accuracy of each category are calculated, and the results are shown in Table 3.
| Model | Average precision | F1 (%) | ||
|---|---|---|---|---|
| Crack AP (%) | Number AP (%) | Vocabulary AP (%) | ||
| Mask R-CNN | 84.32 | 91.26 | 95.73 | 90.44 |
4.3. Detection Results of Improved Mask R-CNN
Figure 9 shows the calculation results based on the improved Mask R-CNN. As can be seen from Figure 9, the improved model can detect and identify cracks well, and the segmentation of cracks is also more accurate.
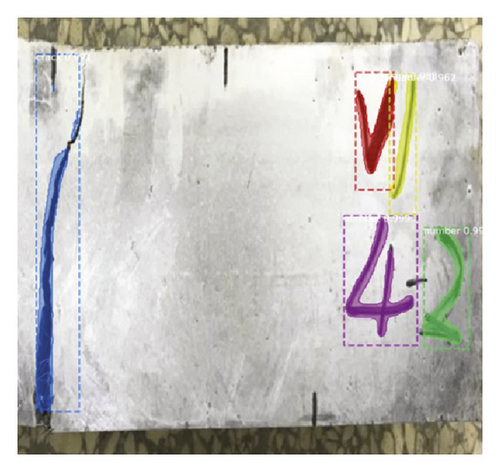
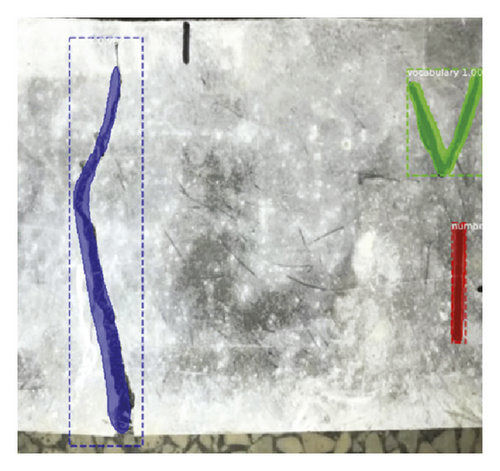
Furthermore, the detection accuracy and average accuracy of each category are calculated, and the results are shown in Table 4.
| Model | Average precision | F1 (%) | ||
|---|---|---|---|---|
| Crack AP (%) | Number AP (%) | Vocabulary AP (%) | ||
| Improved Mask R-CNN | 92.57 | 97.63 | 98.08 | 96.09 |
5. Conclusion
In order to realize the intellectualization of concrete crack detection and better prevent the occurrence of accidents, in this paper, a crack recognition model of steel fiber reinforced concrete is established based on computer vision and the deep learning method. Therefore, some conclusions are drawn as follows. (1) In this paper, the crack image is obtained through the steel fiber concrete experiment, and the crack database is expanded by using the deep learning data enhancement method. (2) Based on the network of YOLOv4 and Mask R-CNN, the crack recognition model of steel fiber reinforced concrete is established, and the average recognition accuracy is 82.60% and 90.44%, respectively. (3) Based on the traditional Mask R-CNN network, this paper proposes an improved Mask R-CNN network model, and its average recognition accuracy is 96.09%. However, the environment of concrete is very complex, such as shadows, stains, and so on, which will interfere with the accuracy of crack identification in actual engineering. Therefore, we will consider the crack identification of concrete in complex environment and further identify the length and width of cracks in future research.
Ethical Approval
Ethical review and approval were waived for this study because the institutions of the authors who participated in data collection do not require IRB review and approval.
Consent
Not applicable.
Conflicts of Interest
The authors declare that they have no conflicts of interest.
Authors’ Contributions
Yang Ding, Hai-Qiang Yuan, and An-Ming She finished the model. Yang Ding wrote the original manuscript. Tong-Lin Yang and Zhong-Ping Wang supervised the study. Jing-Liang Dong, Yuan Pan, and Shuang-Xi Zhou contributed to manuscript writing. All the authors discussed the results.
Acknowledgments
This study was supported by the National Key R&D Program of China (grant nos. 2019YFC1906203 and 2016YFC0700807), Key R&D Project of Jiangxi Province (grant no. 20171BBG70078), National Natural Science Foundation of China (grant nos. 51108341, 52163034, 51662008, 51968022, and 51708220), and Opening Project of Key Laboratory of Soil and Water Loss Process and Control in Loess Plateau, Ministry of Water Resources (grant no. 201806).
Open Research
Data Availability
The crack database data used to support the findings of this study have been deposited in the Baidu online disk repository (https://pan.baidu.com/s/1ozcIOnY4Yl6RzRrQ-IBXUg (password: 093r)).


