Tuning of Photoluminescence and Antibacterial Properties of ZnO Nanoparticles through Sr Doping for Biomedical Applications
Abstract
Sr-doped ZnO nanoparticles have been synthesized using a soft chemical method. The doping ratio of Sr is varied in the range of 0 at.%, 3 at.%, and 5 at.% to 7 at.%. X-ray diffractograms revealed that the samples had hexagonal (wurtzite) structure without a trace of any mixed phase. The average crystallite size of the nanoparticles (NPs) ranged from 39 to 46 nm. The average crystallite size was increased for the initial doping (3 at.%) of Sr ions, and further increase in the doping ratio reduced the particle size due to some distortion produced in the lattice. The surface morphology of the samples and structure of the NPs were investigated using FESEM (Field Emission Scanning Electron Microscopy) and TEM (Transmission Electron Microscopy) pictures, respectively. EDX (energy-dispersive X-ray) spectroscopy confirmed the presence of strontium (Sr) in the host lattice. Photoluminescence and X-ray diffraction confirmed that the dopant ions replace some of the lattice zinc ions and that Sr2+ and Sr3+ ions coexist in the ZnO lattice. The Sr-doped ZnO exhibited violet and blue luminescence spectra at 408 nm and 492 nm, respectively. ZnO : Sr nanoparticles showed increased antibacterial activity against one gram-positive as well as one gram-negative bacteria.
1. Introduction
Zinc oxide (ZnO) is a II-VI semiconductor with a wide band gap (3.37 eV) that has a lot of uses in optoelectronics [1–3]. ZnO is identified as a multifunctional material due to its diverse applications in various fields [4]. Luminescence-based approaches have recently attracted huge attention due to their broad potential in domains including optical devices and biological applications like displays and anticounterfeiting [5–7]. Luminescent inorganic nanoparticles, in particular, have piqued interest due to their enormous potential uses and for fundamental science study in a variety of domains [8]. The electrical and optical capabilities of variously shaped ZnO nanowires and nanoparticles have been utilized for a variety of intriguing applications, including light-emitting diodes, phosphors, solar cells, nanolasers, electrical generators, and biosensors [1, 9–14]. Bulk ZnO is also the most used photocatalyst for water purification because it is more efficient and less expensive than TiO2 [15–17]. It is very interesting to create a high-crystalline ZnO film in large quantities at low temperatures (≤90̊°C) [18, 19]. To increase the performance of ZnO, the majority of studies have used these strategies. Nanoparticles and nanowires of various shapes are frequently synthesized, and their optical and electrical properties have been demonstrated for a wide range of applications, including [9–14]. The photoluminescence and antibacterial efficiency of ZnO can be improved by doping with transition metals, rare earth elements, alkaline elements, and noble metals. Doping alkaline earth metals with ZnO causes lattice defects due to charge compensation and ionic radius variation between the host and dopant ions (Mg2+, Ba2+, Sr2+, etc.) and Zn2+, which can boost antibacterial activity, according to a literature report. In this study, we have used a simple soft chemical approach to successfully synthesize improved luminous strontium-doped ZnO nanoparticles, which have the potential to improve the efficiency of optical applications. Such nanoparticles provide new avenues for embedding oxide nanoparticles on ZnO to promote a wide range of fundamental and advanced phenomena. Though there are some works for the investigation of optical and antibacterial activity of ZnO nanoparticles and SR-doped ZnO nanoparticles, the investigation of structural, optical, and antibacterial behaviour of Sr-doped ZnO is still scanty. As ZnO nanoparticles play a vital role in antibacterial activity, we attempted to verify the variations in the impact by introducing Sr ions in the ZnO lattice. In this article, the structural, morphological, elemental, optical, and antibacterial activities of ZnO nanoparticles were analyzed with the influence of Sr ion incorporation.
2. Materials and Methods
2.1. Preparation of the Sample
Sigma-Aldrich provided analytical-grade zinc acetate dihydrate (Zn(CH3COO)2·2H2O), strontium nitrate (Sr(NO3)2), and NaOH. All of the compounds utilized in this study were of analytical grade and were not purified further. The ZnO : Sr nanoparticles were made using a simple soft chemical approach described in a previous paper [20]. In 200 mL of deionized water, 0.2 M zinc acetate dihydrate was dissolved. The solution was continually agitated with a magnetic stirrer until it became homogenous. As a dopant of precursor, strontium nitrate was served at concentrations of 0, 3, 5, and 7 at.%, respectively. The 0.97 mol of zinc acetate and 0.3 mol of strontium nitrate were taken in a separate beaker. 1 mol of sodium hydroxide was taken in another beaker and dissolved. To synthesize Sr-doped ZnO materials, the dissolved solutions were added in a common beaker under magnetic stirring with rpm 400 per min. All the chemical solutions were taken as per the targeted stoichiometry ratio.
To maintain the pH of the starting solution at 8, the mixed solution was agitated at 85°C for 2 hours and then maintained at room temperature for roughly 24 hours without being disturbed. The residual ions were eliminated when the white solid precipitate was filtered out. The end-product was washed with DI water and ethanol. Before characterization, the produced samples were calcined at 570°C for 3 hours using a tubular furnace (Make & Model: Compact).
2.2. Material Identification
The crystal structure was determined using a PANalytical-PW 340/60 X’pert PRO X-ray diffractometer with Cu-K radiation (1.5406) and a scanning rate of 0.02°/sec. Transmission Electron Microscopy (TEM, Hitachi H-7100), Field Emission Scanning Electron Microscopy (FESEM) (Hitachi SU8000), and energy dispersive X-ray (EDX) analysis were used to examine the sample’s morphology and elemental composition (model: JEOL-JSM 6390 with attachment INCA-Penta FETX3 OXFORD). The spectrofluorometer (Jobin Yvon FLUROLOG-FL3-11) was used to examine photoluminescence (PL) spectra.
2.3. Measurement of Antibacterial Activity
The antibacterial behaviour of the synthesized materials was examined using the Mueller-Hinton agar well diffusion method against one gram-positive bacteria (Staphylococcus aureus) and one gram-negative bacteria (Escherichia coli). To distribute the bacterial cultures (fresh) over the plates, the spread plate technique was utilized whereas the prepared medium was placed into petri plates. Discs with a diameter of 6 mm and a weight of 20 g were distributed onto the petri plates and gently pressed to make sure that the discs have adhered with agar. A disc consisting of gentamicin, a typical antibiotic, was also inserted on every plate for comparison. The prepared plates were kept for incubation for 24 hours at 35 degrees Celsius. The spread diameter of the inhibition zone around the paper discs was estimated and denoted in millimeters after the incubation period.
3. Results and Discussions
3.1. Structural Research
The XRD of Sr-doped ZnO nanoparticles with different strontium atomic ratios is shown in Figure 1 (0, 3, 5, and 7 at.%). The hexagonal wurtzite structure is represented by all of the diffraction peaks at (100), (002), (101), (102), (110), (103), and (112). Furthermore, the JCPDS card no. 36-1451 is sufficiently indexed for these diffraction peaks. There are no peaks of metallic ZnO2 or any other phases found. Furthermore, the powerful and crisp diffraction peaks indicate that the as-made nanoparticles are highly crystalline.
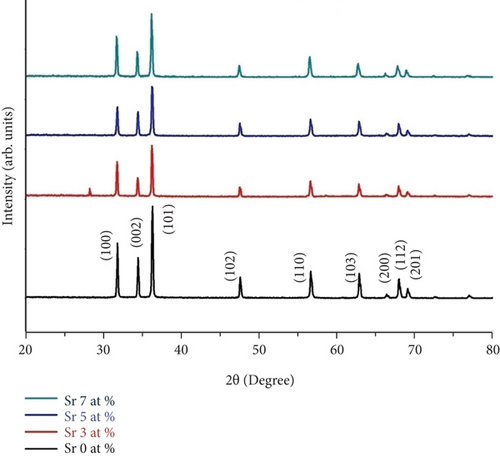
Table 1 shows the computed “D” values for the wavelength of the X-ray used (1.5406), the full width at half maximum (FWHM) of the 101 plane, and the angle of diffraction. The crystallite size measured ranges from 39 to 46 nm. The increasing incorporation of Sr at the ZnO sites, respectively, may be causing the steady declines in crystallinity of produced nanoparticles.
| Sr doping level (at.%) | Lattice constants ∗ (Å) | 2θ | FWHM (β) | D (nm) | Microstrain | |
|---|---|---|---|---|---|---|
| a | c | |||||
| 0 | 3.2701 | 5.2112 | 36.27 | 0.199 | 41.9 | 8.28 |
| 3 | 3.2548 | 5.2034 | 36.25 | 0.183 | 45.5 | 7.61 |
| 5 | 3.2523 | 5.2109 | 36.25 | 0.215 | 38.9 | 8.90 |
| 7 | 3.2525 | 5.2119 | 36.25 | 0.210 | 39.8 | 8.70 |
The computed lattice constants ‘a’ and ‘c’ are remarkably close to the conventional values of strontium-doped ZnO nanoparticles up to 7 at.%. The substitution of strontium increased the particle size because Sr2+ (1.12 Å) has a larger ionic radius than Zn2+ (0.74 Å). The further increase in doping concentration slightly reduced the overall particle size. This increase in the particle size indicated that the dopant has been entered into the host lattice effectively. The C was decreased and the particle size increased for Sr (3 at.%). For Sr (5 at.% and 7 at.%), the C was increased and the particle size reduced. Ouhaibi et al. observed in their research that the particle size was increased up to Sr of 3 at.% and reduced for further incorporation of Sr ions [23].
3.2. Analysis of Morphology and Elements
The surface morphology of ZnO and Sr-doped ZnO nanoparticles is shown in Figure 2. The FESEM pictures reveal a uniform and highly crystalline ZnO nanostructure. The top surface of undoped ZnO nanoparticles had a typical hexagonal cross section (Figure 2(a)). The addition of different concentrations of strontium (3, 5, and 7 at.%) resulted in the development of material on the nanoparticles. These generated nanoparticles are consistently dispersed over the surface and have high communication between them, as seen in the TEM image (Figure 2(e)). As a result, doping leads to a remarkable impact on the grain size of the ZnO nanoparticles, resulting in changes in morphology.
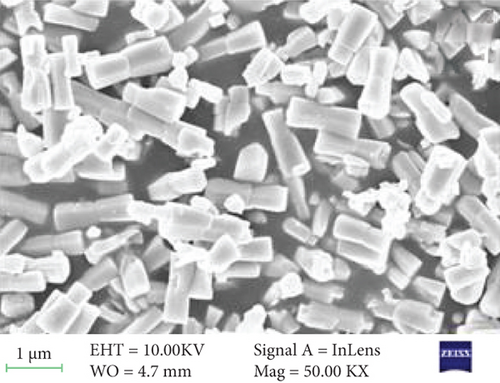
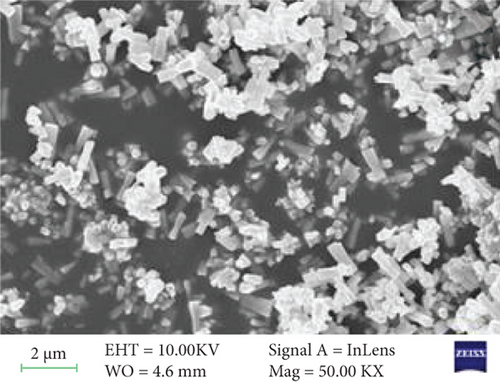
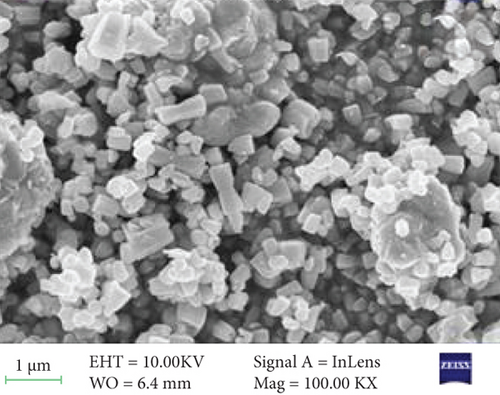
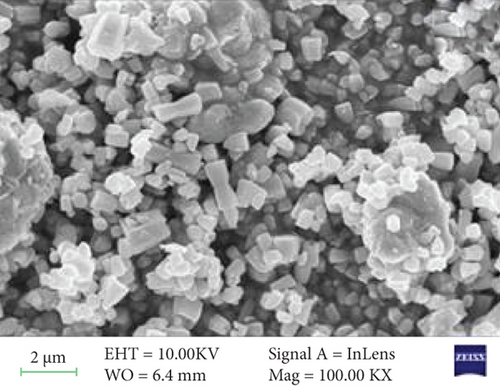
The surface morphology was changed due to Sr doping in the ZnO lattice. The ZnO and Sr particles were highly accumulated at the surface and formed a cluster near the surface, and the size was increased. With further addition of Sr, the cluster size was decreased. The increase in crystallite size indicates that the dopant Sr has been substituted in Zn2+ sites. The incorporation of Sr produces some distortion on the lattice and leads to some supplementary defects. These are responsible for the change in morphology.
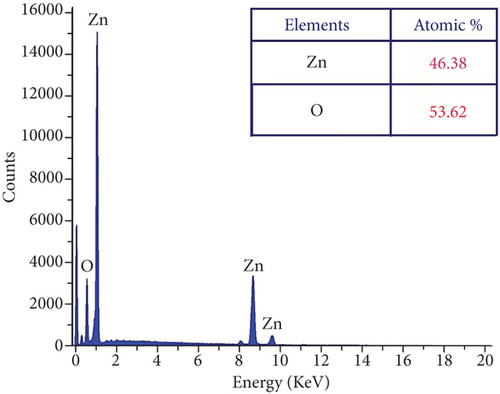
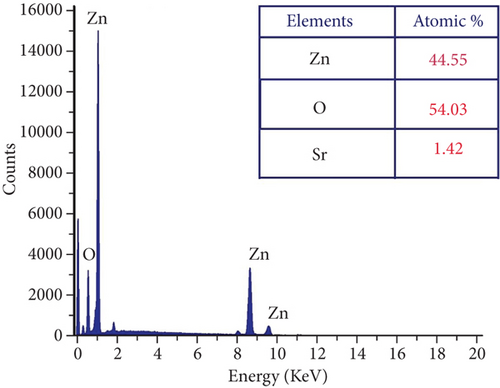
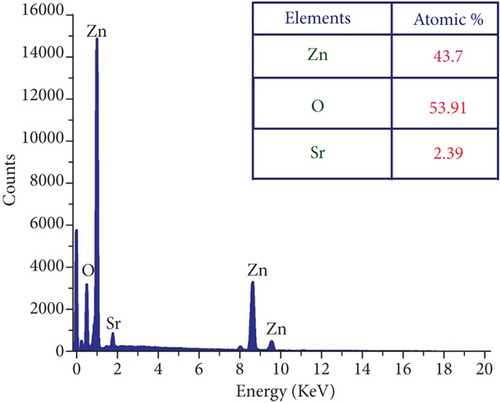
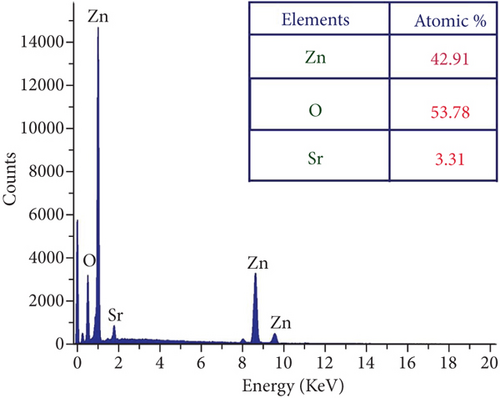
The presence of Zn, O, and Sr atoms in produced nanoparticles is indicated by the EDX spectra (Figures 3(a)–3(d)). The highly intense Zn and O peaks were found, indicating that the nanoparticles were mostly ZnO with a few impurities. The at.% value of each element present in the table samples was listed as a table in each figure. All the elements’ presence ratios are matched well with the targeted stoichiometry ratio. From the EDX spectra, the presence of dopant ions in the host material is proven.
3.3. Photoluminescence of ZnO : Sr Nanoparticles
ZnO and Sr-doped ZnO nanoparticles had photoluminescence spectra that were excited at 325 nm (Figure 4). At 408 nm (2.922 eV), the spectrum reveals a strong peak violet emission. The product’s emission peak positions are nearly unchanged, as can be shown. Shown is an intrinsic characteristic of Sr-doped ZnO nanoparticles themselves when excited at 325 nm. Excitonic recombination is responsible for the UV emission at 361 nm, which indicates the near band edge emission of ZnO [24, 25]. The purple-blue emission around 436 nm is most likely due to a neutral oxygen vacancy defect’s triplet to ground transition [26]. The presence of impurity (Sr) atoms in the host ZnO matrix, as well as zinc and oxygen vacancies, is most likely responsible for the violet emission at 408 nm. Furthermore, doping Sr ions can result in larger active defects in the ZnO lattice, which can enhance the photocatalytic activity of the Sr-doped ZnO crystals in the visible region [27].
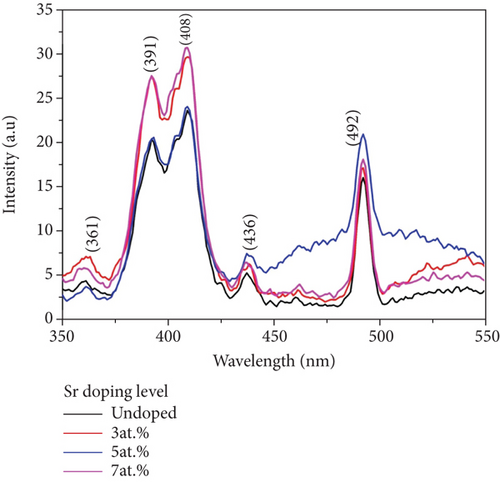
A series of visible emissions have also been reported in the wavelength range of 400 to 600 nm. Various types of intrinsic defects, including defect states, interstitials, and oxygen vacancies, can all be blamed for visual emission. The incorporation of Sr ions can create more active defect sites in the ZnO host lattice, which absorbs more visible light. This produces better photocatalytic activity of the Sr-doped ZnO crystallites in the visible range. Surface imperfections caused blue emission at 436 nm and green-blue emission at 492 nm. As a result, the increased PL emission implies that the flaws that exist in Sr-doped ZnO improve photocatalytic activity.
3.4. Antibacterial Activity
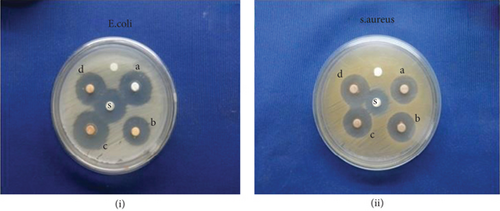
Sr-doped ZnO nanoparticles were tested for antibacterial activity against one gram-positive pathogen (E. coli) and one gram-negative pathogen (S. aureus), which are the most common bacteria that cause dihedral illness. The antibacterial activity of these nanoparticles is stronger in S. aureus and E. coli (Figure 5). Bacterial growth is inhibited by atomic percent in the presence of nanoparticles at specific concentrations. Surprisingly, this amount varies greatly depending on the size of the nanoparticles. Figure 6 shows the measured inhibitory zone diameters of the samples. Gram-positive bacteria possess a thicker cell wall and a single cytoplasmic membrane with many layers of peptidoglycan polymers [28] (20-80 nm). The gram-negative bacterial wall, on the other hand, is made up of two cell membranes and a plasma membrane with a thin layer of peptidoglycan [29] that is 7-8 nm thick. Nanoparticles with sizes in this range can easily pass through the peptidoglycan, making them vulnerable to destruction. The bacterial concentration was found to decrease as the concentration of Sr-doped ZnO was increased. The growth of E. coli and S. aureus was suppressed more at a concentration of 7% Sr-doped ZnO.

These ZnO nanoparticles have a biocidal impact and are effective at delaying bacterial development. These findings could lead to significant technologies in the future, such as antibacterial systems and medical equipment. The antibacterial behaviour of the nanostructure may be ascertained to two possible mechanisms: (i) the generation of increased levels of Reactive Oxygen Species (ROS), such as superoxide anion (O2-), hydroxyl radical (-OH), and hydrogen peroxide (H2O2), and (ii) the deposition of nanoparticles on the surface of bacteria in the cytoplasm region, causing cellular function disruption [30].
UV and visible light can both activate ZnO with a crystal flaw. When an appropriate photon strikes ZnO, an electron is stimulated from the valance band to the conduction band, leaving a hole in the valance band. Superoxide anion radicals are formed when an electron in the conduction band combines with dissolved oxygen molecules (O-2). The valence band hole separated the water molecule into OH- and H+ ions. HO2 radicals are formed when superoxide anion radicals (O2-) combine with H+. H+ reacts with the HO2 radicals to form the H2O2 molecule. The H2O2 can easily enter the cell membrane, killing the bacteria.
The presence of Sr in ZnO structure increased the antibacterial activity against both gram-positive Staphylococcus aureus and gram-negative Escherichia coli. The increment order is the function of the doping ratio of Sr. The maximum zone inhibition was received for the highest doping concentration of Sr (7%).
AL-Jawad et al. observed a similar enhancement of antibacterial activity against S. aureus and E. coli in Ag-doped ZnO thin films [31]. Fe-doped ZnO thin films also exhibited a better antibacterial response under UV light irradiation against S. aureus and E. coli [32].
The Sr-doped ZnO particles are allowed by the cell wall of E. coli for an electrostatic interaction; this might cause a breakdown of the membrane barrier, and ultimately its cell got damaged. This electrostatic interaction is more at gram-positive bacteria than at gram negative-bacteria. A similar effect is produced in S. aureus bacteria also. According to XRD particle size calculation, higher doping percentage of Sr reduced the overall size of the particles. These small-sized particles can enter more numbers, and the cell damage is also proportionately increased [33].
4. Conclusion
A simple soft chemical approach was used to successfully produce both undoped and Sr-doped ZnO nanoparticles. The impacts of Sr on ZnO nanoparticles were investigated in terms of structural, morphological, and optical properties. The nanoscale portion of the prepared samples had a hexagonal wurtzite structure without any impurities or secondary phases, according to XRD data. Physical factors such as crystal size have been found to decrease when Sr is added to the ZnO matrix. The EDX analysis showed the presence of Sr content in the ZnO. The FESEM study determined the change in surface morphology with doping. For the doped nanoparticles, the PL spectrum indicated a high UV emission around the near band edge region (NBE) and defect states encountered in visible emissions. These findings suggested that Sr-doped ZnO nanoparticles could be useful in optoelectronic devices and photocatalytic degradation of organic molecules in the future. The Sr-doped ZnO nanoparticles produced an enhanced antibacterial activity against E. coli and S. aureus. Hence, these materials will be useful for biological applications.
Conflicts of Interest
The authors declare that they have no conflict of interest.
Open Research
Data Availability
Data can be made available from the corresponding author on reasonable request.


