Production of Nanocellulose Crystal Derived from Enset Fiber Using Acid Hydrolysis Coupled with Ultrasonication, Isolation, Statistical Modeling, Optimization, and Characterizations
Abstract
Currently, many scholars are looking for renewable biomass sources for the isolation of nanomaterials that have a sustainable property and are ecofriendly. Thus, effectively synthesize and characterization enset fiber nanocellulose using acid hydrolysis with sonication is focus of study. Additionally, process optimization for isolation of nanocellulose (CNCs) from raw enset fiber using RSM-CCD and characterizations of obtained CNCs was explored. The quadratic model was selected, and optimized values for CNCs yield (77.69%) that were acquired to be H2SO4: 51.6 wt. %, reaction temperature: 47°C, and time: 66.5 min. Chemical composition analysis, XRD, FTIR, PSA, SEM, and TGA were used for characterizing CNCs. The particle size distribution of CNCs is 66 nm. It has a crystalline index of 80.91% and excellent thermal stability. FTIR and chemical composition result indicated the reduction and removal of lignin and hemicellulose components that are usually available in the raw enset fibers. The SEM analysis reveals the structure and arrangement of the fiber bundles inside the raw material to nanocellulose. This property shows its endowing as a possibly consistent load-bearing material. This study could be given a noteworthy thought for designing and emerging CNC isolation, optimization, and industrial application.
1. Introduction
Recently, many scholars are searching for renewable biomass sources for the production material which is an ecoenvironmentally friend and most of all sustainability. In this context, biomasses containing lignocellulosic compounds are the largest access as they are capable of being renewable raw materials for the synthesis of biobased cellulosic nanomaterials, and more than a few researchers have discovered the potential lignocellulosic biomass for supersede fossil-based feedstocks [1–5]. Plants have plenty of cellulose which is the renewable raw material for most biopolymers, and this sight availability of cellulosic material is very abundant as such wood to agricultural waste can be used [6–8]. Ethiopia is one of the fewest countries which are blessed with having more than enough cellulosic-rich materials such as agricultural products, byproducts, and wastes.
Currently, rising attention is being seen in the field of nanotechnology synthesis from potential green-based raw materials which have sustainability [3, 7, 8]. Thus, cellulose nanocrystals (CNCs) synthesized from the plant have wide practical use in various areas due to their physical characteristics, namely, aspect ratio, strength, rheology, lightweight, low density, opticality modification, modification rich hydroxyl group, inexhaustibility, and environmentally friend [9]. Other extraordinary properties of CNCs are their simplicity for modification and dissolvability in water. The surface of CNCs can be improved with numerous chemical treatments in the direction of any anticipated surface adjustment owing to the profuse hydroxyl groups on the surface of CNCs which provide them reactive. This can successfully make the CNSs ultra practicable and facilitate the integration and dispersion of CNCs into various matrices of polymer. CNCs show great potential in the various applications including a barrier in the separation process of hazardous waste, biomedical products, electronic sensors, paints, and coatings, as the thickener in cosmetics, biodegradable package, and CO2 adsorbent, as filler of special textiles, food wraps, and texturing agent which replace the nonbiodegradable plastics, and as fillers and rheology modifiers in different fields like foams, aerogels, and polymer electrolytes [9]. It can also be used as nanocomposite materials in polymer science to improve the mechanical, thermal, and ionic conductivity properties of the polymer [4, 8]. For this interesting material, lignocellulosic biomass from different sources has become the most potential renewable and promising feedstock [8, 10]. The cell wall structure of lignocellulosic biomasses mainly consists of components such as cellulose, hemicellulose, lignin, and additionally some extractable components. Agricultural residues, forest residues, and energy crops have been used as raw materials for CNCs. Some of the raw materials for the isolation of cellulose are sugar cane bagasse [11], wheat straw [12], pineapple leaf [3], corn cob [4], arecanut husk fiber [1], water hyacinth [5], and other plants [8]. Among other plants, Enset ventricosum (E. ventricosum) of the steam fiber major components is cellulose (69.51%) and the small quantity of lignin (5.7%) contents while the leaf has cellulose (37.96%) and a high quantity of lignin (18.93%) content [13]. The chemical method has been used for the isolation of fibrotic nanocellulose material from agricultural residues by removing their hemicellulose and lignin components [1, 2, 4, 5, 14]. Commonly, the isolated nanocellulose is a colloidal suspension with transparent optical property [5].
To obtain a fiber with nanosize, several studies have evaluated the use of mechanical treatment for instance sonication, high-speed blender, high-pressure homogenization, ultrafine grinder, and ball mill [3, 5, 11]. Nevertheless, this treatment by itself is not efficient to separate hemicellulose, cellulose, and lignin. The combination of sonication and chemical treatment can yield pure CNCs. Among the different mechanical treatments, the sonication method has been proved to be the simplest technique to produce pure Cs fibers in combined with chemical treatments [5].
Enset ventricosum, commonly known as enset, is a monocarpic perennial flowering plant native to Ethiopia. It is a drought-resistant plant that is cultivated in more than 200,000 hectares in a wider range of altitude 1100-3000 m of central, southern, and southwestern parts of Ethiopia. It is harvested as food in most of Ethiopia especially in the southern part where it is utilized as nutritional food [13]. As they prepared it for food, a large amount of biomass residues is generated in the process mainly from the enset steam, (i.e., many bundles of fiber are obtained from the leaf sheath and the steam after being scrapped to produce Bula and Kocho which are starchy food) and stack of inflorescence. According to the report by Berhanu et al., 2021, about 150,000 tons of fiber bundles residue are produced annually from enset in Ethiopia. Thus, this enormous quantity of fibers residue could be used to produce CNC products. Several studies have evaluated responses to enset in growing cattle and horses, and its potential has been proven on the production of different products, namely, pulp and paper, food, and medicinal application [15–17]. To date, beyond these studies, no work has been carried out concerning enset fiber-based cellulosic nanomaterial. Keeping the view on the significance of CNCs, there is an immense need for researches on CNC production from an economical source which involves extracting fiber and process optimization for improved production of cellulose nanocrystal. Consequently, enset fiber, lignocellulosic biomass, is the largest reservoir of renewable cellulose source in Ethiopia, and cellulose nanocrystal can be isolated from it.
Up to date, no significant study has been done on the production of cellulose nanocrystal from enset fiber (E. Ventricosum). Thus, the focuses of this study are as follows: (I) novel synthesis of cellulose nanocrystal form enset fiber using chemical hydrolysis technique coupled with sonication, (II) the investigation of the chosen prosses parameters, namely, acid concentration reaction time, and reaction temperature, on the significant of hydrolysis on the yield of cellulose nanocrystal, and (III) the interaction effect of the designated factors was designed with five-level response surface central composite design approach (RSM-CCD); further, the obtained nanocellulose was characterized using different techniques.
2. Materials and Methods
2.1. Materials
Enset ventricosum plant was obtained from enset harvesting area located at Kefa, southwest, Ethiopia. Bundles of enset fiber (EF) are obtained from the stem and leaf sheath after the enset has been scrapped. Sodium chloride (NaCl-99%), toluene (C7H8-99%), ethanol (C2H5OH-98%), sodium hydroxide (NaOH), sodium hypochlorite (NaOCl), acetic acid (CH3CH2OOH), sulfuric acid (H2SO4), and distilled water were used in EF preparation. The chemical reagent used in this study was analytical grade, and they were obtained from the Department of Material Engineering, Jimma Institute of Technology, Jimma University, Jimma, Ethiopia.
2.2. Preparation of Enset fiber
As described in the material section, the fiber is isolated from the enset, and it was dried under the sun for five days. The dried fiber was chopped, grounded, and sieved through a mesh size of 60 (250 μm). Finally, the acquired fiber powder was put in a polyethylene bag and stored in a desiccator till further experimental work. The dewaxing process was carried out, 2 : 1 v/v mixture ratio of toluene and ethanol and in sox-let apparatus at 120°C using oil bath for 5 h to get rid of extractive components such as wax, debris, pectin, and oils. The dewaxed fiber was rinsed with distilled water and ethanol frequently and finally, it was filtered using a 45 μm sieve to remove solvents and at last, it was dried in the oven at 45°C for overnight.
2.3. Alkaline Pretreatments of Enset fiber
To remove lignin and hemicellulose from EF, alkaline treatment was carried out accordingly. The dewaxed EF was treated with 15% NaOH solution in the ratio of 1 : 20 in a high-pressure autoclave at 4 bars for 6 hr and 130°C under steady agitation of 500 rpm. The treated EF was excessively washed with distilled water till the pH is neutral and dried under the sunlight for three days till it has constant weight.
2.4. Bleaching of Enset fiber
The dried EF was bleached by soaking it in a 4 : 1 v/v ratio mixture of acetic acid and 6% sodium hypochlorite solution under a pH of 4 for 2 hr and 60°C. Throughout the process of bleaching, the color of EF changed to clear white. The processed fiber came to neutralize by rinsing it with distilled water successively. Lastly, cellulose was put in a deep freezer to obtain powder cellulose. The powder cellulose was sealed in a polyethylene bag and kept in a desiccator till further experimental work. Bleaching was done to remove the remaining hemicellulose and lignin completely from the EF.
2.5. Cellulose Nanocrystal Isolation from Enset fiber Using RSM
The bleached cellulose was hydrolyzed in different concentrations of H2SO4 with a 1 : 15 v/w ratio of acid, and the reaction time and temperature were also varied according to the central composited design experiment set up (Table S.1) and the bleached cellulose, under a controlled condition and continuous agitation at 500 rpm. The reaction was quenched by adding ice to the mixture to halt the reaction, and the resulting mixture was then cooled to room temperature [18]. The hydrolyzed cellulose was washed frequently with distilled water till the pH is neutral. Furthermore, the hydrolyzed cellulose was dialyzed against deionized water via a cellulose membrane for five days to neutralize and fully remove the remaining acid and other unwanted chemicals. Subsequently, the dialysis suspension of CNCs was sonicated at 20 kHz of frequency and 600 W power supply for 1 hr in an ultrasonic crusher to get aqueous homogenized dispersion, and the resulting nano cellulose was labeled as the CNCs suspension.
For the hydrolysis process, three parameters (Table S.1) were selected after the survey of previous related works from different works of literature [14, 19, 20]. For the RSM study, the experiment set up of chosen parameters was determined using CCD. This statistical tool technique guarantees that each factor and its relations are systematically studied [21].
Moreover, the constraints were optimized using numerical optimization to maximize the yield. Analysis of variance (ANOVA) was accustomed to check the competence of the model for the experimental response. It is a statistical tool applied for analyzing any variation in the average performances of tested constraints [23]. The optimal values of the selected constraints were reached through analyzing the equation of regression. Effects of interaction between the parameters were examined through developing response surfaces [24]. The developed model was validated through prediction using the feature of prediction point of the Design-Expert software, and experimental runs were carried out in triplicate.
2.6. Characterizations of Enset fiber and Cellulose Nanocrystal
2.6.1. Chemical Composition
The enset fiber was characterized in terms of its physiochemical properties. American Society for Testing and Materials (ASTM International) standard methods and Technical Association of the Pulp and Paper Industry (TAPPI) were used for characterization of the enset fiber. Three grams of the prepared dried material was used for testing each sample according to the standard test.
2.6.2. Particle Size Determination of CNCs
The particle size of CNCs which is diluted in distilled water was determined using dynamic light scattering (DNS) by the Malvern Zeta Nano (ZE3600) system. This method is also described as photon correction spectroscopy in that sample’s particle size that is analyzed by measuring arbitrary variations in scattered light intensity from a solution. The measurement was carried out at 25°C with a calibration time of 60 sec. The obtained data were then processed by using Malvern Zeta sizer software.
2.6.3. Scanning Electron Microscope (SEM)
SEM (FEI, INSPCT-F50, Germany) was utilized to investigate the surface image of EF, bleached cellulose, and CNC samples. This operation was done under a vacuum at an accelerating voltage of 2 kV.
2.6.4. X-Ray Diffraction (XRD)
2.6.5. Fourier Transform Infrared Spectroscopy (FTIR)
FTIR (FTIR- iS50 ABX, Germany) analysis was carried out in order to investigate the functional groups of EF, bleached cellulose, and CNC samples. The samples were analyzed with a spectrum wavenumber range of 400 cm-1 to 4500 cm-1 and an average scanning rate of 250. KBr pellet technique was accustomed to accomplish FTIR analysis.
2.6.6. Thermographic Analysis (TGA)
Thermogravimetric analysis (TGA) was used to analyze the thermal decomposition properties of enset fiber, bleached cellulose, and nanocellulose. Before the analysis, the fibers were dry for 24 h at 65°C and saved in a desiccator. These fibers are cut into fine parts and then analyzed by using an aluminum pan from 25°C to 600°C under the atmosphere of inert nitrogen through 100 ml/min of flow rate and 10°C/min of heating rate.
3. Result and Discussion
3.1. Isolation, Interaction Effect, and Parameter Optimization of CNCs via CCD-RSM
The interaction of factors with each other and the optimum operating conditions for the isolation of nanocellulose from raw enset fiber via using acid hydrolysis were examined using a central composite design. The observed and predicted results are presented in Table 1.
| Run | Factor 1 | Factor 2 | Factor 3 | Response: CNCS yield % | |
|---|---|---|---|---|---|
| A: H2SO4 Conc (wt. %) | B: reaction temperature (°C) | C: reaction time (min) | Actual value (mean + SD) | Predicted value | |
| 1 | 60 | 60 | 90 | 45.18 ± 0.05 | 43.94 |
| 2 | 40 | 60 | 40 | 35.52 ± 0.05 | 33.39 |
| 3 | 60 | 60 | 40 | 45.08 ± 0.025 | 43.62 |
| 4 | 50 | 45 | 107 | 30.59 ± 0.033 | 31.96 |
| 5 | 50 | 45 | 65 | 77.68 ± 0.05 | 77.04 |
| 6 | 50 | 45 | 65 | 75.52 ± 0.05 | 77.04 |
| 7 | 50 | 45 | 65 | 78.65 ± 0.075 | 77.04 |
| 8 | 50 | 45 | 23 | 20.94 ± 0.05 | 23.36 |
| 9 | 40 | 30 | 40 | 25.61 ± 0.05 | 24.14 |
| 10 | 50 | 45 | 65 | 78.23 ± 0.0667 | 77.04 |
| 11 | 50 | 45 | 65 | 76.94 ± 0.0333 | 77.04 |
| 12 | 33 | 45 | 65 | 36.12 ± 0.667 | 38.58 |
| 13 | 40 | 30 | 90 | 35.12 ± 0.033 | 34.03 |
| 14 | 67 | 45 | 65 | 50.56 ± 0.05 | 51.89 |
| 15 | 50 | 45 | 65 | 75.85 ± 0.025 | 77.04 |
| 16 | 50 | 70 | 65 | 49.12 ± 0.033 | 51.57 |
| 17 | 60 | 30 | 40 | 39.05 ± 0.1 | 37.87 |
| 18 | 40 | 60 | 90 | 43.36 ± 0.1 | 41.86 |
| 19 | 60 | 30 | 90 | 40.19 ± 0.02135 | 39.64 |
| 20 | 50 | 20 | 35 | 38.82 ± 0.0333 | 40.16 |
- SD: standard deviation.
3.1.1. Model Fitting and Analysis of Variance
The summarized ANOVA is presented in Table S.2. The outcomes gotten in Section 3.1 are explored, coefficient determination (R-squared) for the yield of CNC response from the raw enset fiber weighed 0.9930, and this signified that 99.30% of the response was agreed upon and it could be described amid of the quadratic model. Better yet, the model has inconsistency predicting the response with only 0.70% of extent. Therefore, the higher R-square implied that the predicted value by the quadratic model and the actual response values were very close to one another [25], and this information is also supported by predicted vs. actual data (Figure S.1). Again, the model was very consistent to be promising in investigating the data since Adj R-square is 0.9877, and the pred R-square is 0.9579 proving that they were reasonably in agreement with one another since their difference is less than 0.2 [21].
The consequence of the constraints was examined using F-value and p-value. And, the lesser p-value and higher F-value indicated that the chosen model is extremely significant [21, 26]. Thus, the quadratic model has an F-value of 170.61 and a p-value of less than 0.0001. The terms of the model can be significant if the p-value is less than 0.05 [27]. Accordingly, the process parameters for the isolation of CNCs from raw enset fiber, A, B, C, AC, A2, B2, and C2 were obtained to be quite significant. The lack of fit P value for isolation yield of CNCs was 0.0543 which was not noteworthy compared to the pure error. Signal-to-noise ratio was determined via Adeq precision, and its values were observed to be 34.9332 which indicated an adequate signal for the production of CNCs. it signifies the reputation of the quadratic model if the ratio was more than four. Thus, this model for CNC yield is capable of being considered to use for the navigation of design space. Besides, the coefficient variation (4.35) wants to be smaller since a lower value of it favors the precision with which the experiments were carried on [28].
The model accuracy can be tested by comparing and contrasting the actual value with the predicted value as shown in Figure S.1. It can fairly be inferred from the graph that both values, experimental and predicted data, are close enough to each other. Correspondingly, the smaller predicted residual sum of squares (PRESS) statistic indicates the wellness of data points fit the model [23]. Normal probability plots are too an appropriate graphical technique for analyzing the normality of the residuals [26]. A normal plot of residuals among the normal probability (%) and the internal student zed residuals was gotten to analyze how well the model satisfies the assumptions of ANOVA. The internally student zed residuals can also be used to measure the standard deviations separating the experimental and predicted values [23]. Figure S.1 illustrates the association between the normal probability (%) and the internal student zed residuals. The straight line specifies that neither any transformation of response is required nor outward problem with normality.
3.1.2. Analysis of Interaction Effects of the Parameters
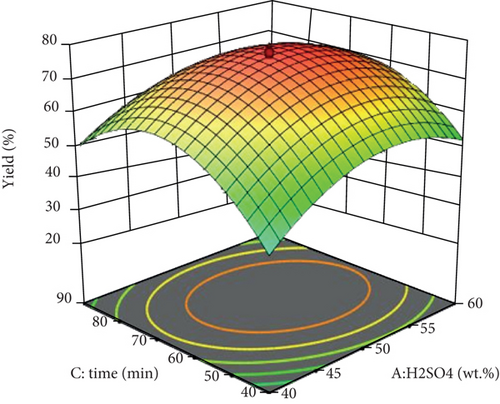
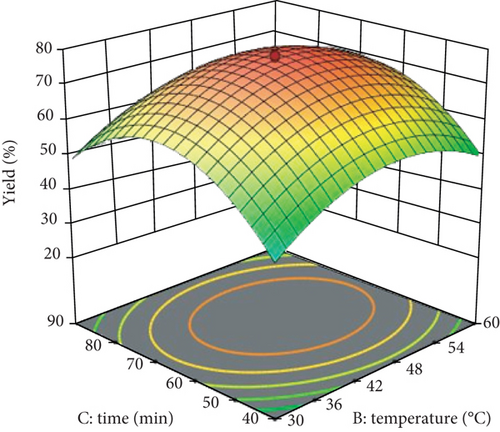
Using the support of the RSM-CCD method, the significant effects of the process constraints, namely, reaction time, reaction temperature, and H2SO4 concentration, were investigated on the isolation yield of CNCs. By putting one variable constant, the interaction effect of two variables at a time on CNC yield was determined and presented as following using 3D response surface plots (Figure 1).
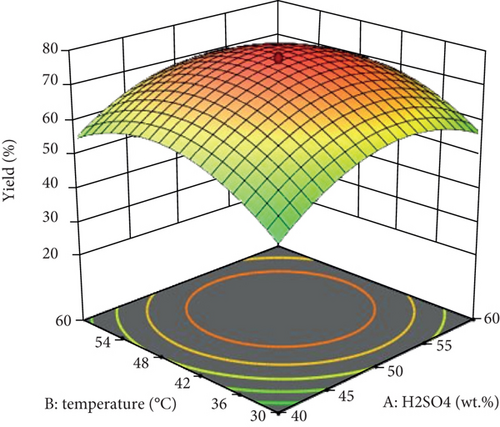
The interaction effect of acid concentration (H2SO4, wt. %) and reaction temperature (°C) is shown in Figure 1. Based on the plots obtained, it is seen that the yield increases as H2SO4 concentration is from 33.18 to 50 wt. % and reaction temperature 20 to 45°C, but the further increment of both parameters has a negative response to the CNC yield. As it is given from the response variable of the coded equation, the combined interaction effect of reaction time and the temperature has a negative effect on the yield of CNC isolation with the coefficient of -0.8750 (Eq. (5)). In another word, higher acid concentration and reaction temperature result in low isolation yield. The pick for isolation yield was obtained at 50 wt. % of H2SO4 and 45°C of reaction temperature.
The interaction effect of acid concentration (H2SO4, wt. %) and reaction time (min) on the isolation yield of CNCs is depicted in Figure 1. The efficiency of isolation became increased with increasing reaction time until it reaches 65 minutes for an acid concentration of 50 wt. %. Further increases in both resulted in low CNC yield. As it is presented from the quadratic equation of the response (Eq. (5)), the interaction effect of acid concentration and reaction time of raw enset fiber has a negative effect on isolation yield with a coefficient of -2.03. The maximum isolation yield is attained at a reaction time of 65 minutes and an acid concentration of 50 wt.%.
The interaction effect of reaction temperature (°C) and time (min) of enset raw fiber on CNC yield is shown in Figure 1. As it is illustrated through the 3D, it is well observed that the isolation yield of CNCs from the raw enset fiber increases with increasing the reaction temperature from 20 to 45°C and reaction time from 23 to 65 minutes. The combined interaction effect of reaction temperature and time affects the isolation yield negatively with the coefficient of – 0.3550 (Eq. (5)). The maximum isolation yield of CNCs is gotten at the reaction temperature of 45°C and a reaction time of 65 minutes.
H2SO4 concentration, reaction temperature, and time are the utmost significant parameters on the synthesis of CNCs during the acid hydrolysis isolation process. Reaction time affects various CNCs characterization such as crystallinity index, size, and most of all, the yield. This is due to as reaction time increases, some hydrolyze crystalline surfaces will, in turn, decrease the yield and as time is lower, the polymerization rate will be high due to undispersed fiber, and also the obtained nanocellulose will have an amorphous structure and larger diameter. According to different previous studied data, reaction time varies from 30 min to 4 hr [1, 14, 19, 20, 29]. The concentration of sulfuric acid has a potential effect on synthesizing of CNCs. H2SO4 concentration can range from 40 to 60 wt. %, and it has been widely used for the isolation of nanocellulose from residues of agriculture. The other parameter which has a significant role in the yield increment of nanocellulose is reaction temperature. At low temperatures, most of the process reactions takes a long time to get the desired yield and at high temperatures, the reaction is hard to control. The temperature can range from 25 to 70°C. Previous works on the isolation of nanocellulose via acid (H2SO4) hydrolysis are briefed in Table 2.
| Raw materials | Condition | Yield % | Crystalline index (%) | Particle size (nm) | References | ||
|---|---|---|---|---|---|---|---|
| H2SO4 concentration (wt. %) | Reaction temperature (°C) | Reaction time (min) | |||||
| Sugar cane bagasse | 60 | 50 | 40 | 65 | 65.37 | — | [30] |
| Sisal fiber | 60 | 45 | 30 | — | 75 | 30.9 | [20] |
| Laminaria japonica | 51 | 30 | 70 | 52.3 | 69.4 | — | [2] |
| Rice hulls | 63.7 | 45 | 60 | — | 70 | 100 | [19] |
| Corncob | 62 | 44 | 90 | 23.5 | 79.3 | 70 | [14] |
3.1.3. Optimized Condition for CNC Yield and Parameter Validation
The experiment has been performed, pretreatments, and interaction via the aid of RSM. The sole purpose of all of these is an examination for optimum operating conditions but nothing more. The isolation process of CNCs from raw enset fiber is governed by at least the three variables that were discussed in the above sections. The search for optimum numerical values of these variables on isolation yield was summarized in Table S.3.
Grounded on the criteria set in Table S.3, the optimum values of H2SO4 concentration, reaction temperature, and reaction time for isolation of CNCs from raw enset fiber come out to be 51.6 wt. %, 47°C, and 66.5 minutes, respectively, and with these parameters, the isolation yield of CNCs was 77.69% with a desirability of 0.983. Finally, to validate the parameters, a triplicate experimental run was conducted at optimum conditions and showed a good agreement with the predicted isolation yield (4.27% error).
3.2. Characterizations
3.2.1. Chemical Composition Analysis
The compositional characteristics of EF after each step of treatment are presented in Table 3. The raw enset fiber contains 32.68% hemicellulose, 40.09% cellulose, and 10.53% lignin. Before the treatment of EF, the content of lignin is very high due to the bonding between hemicellulose and lignin that is close. Most agriculturally based raw materials have similar cellulose content such as teff straw (36.7%) [31], arecanut husk fiber (34.18%) [1], coffee husk fiber (41.34%) [32], straw of wheat fiber (43.2%) [12], Laminaria japonica (42%) [2], and sisal fiber (50%) [20].
| Sample | Cellulose (%) | Hemicellulose (%) | Lignin (%) | MC (%) | AC (%) | VM (%) |
|---|---|---|---|---|---|---|
| Raw EF | 40.09 | 32.68 | 10.53 | 15.76 | 4.15 | 8.46 |
| Pretreated and bleached | 51.37 | 22.26 | 5.8 | — | — | — |
| Hydrolysis | 80.91 | 14.53 | 2.91 | — | — | — |
The purpose of alkaline pretreatment and digesting of EF is to break down the bond between hemicellulose and lignin and as a result, it decreases the proportion of hemicellulose and lignin content in the raw enset fiber [1, 33, 34]. The result after the treatments validates that the process effectively removed hemicellulose and lignin as has been established in works of literature. The results were also reinforced by FTIR and SEM characterization.
Alkaline pretreatments followed by digesting and hydrolysis coupled with sonication result in a higher increment of celluloses of the enset fiber from the raw enset fiber. This is due to the disintegration of hydrogen bond linkage among hemicellulose and cellulose chains and also hemicellulose decomposition [1, 35, 36]. This process has increased the crystallinity of the material. The XRD characterization and previous works are in agreement with these results [5, 20].
3.2.2. Particle Size Distribution
DLS is commonly accustomed for the measurement of particle size in colloids, suspensions, polymer, emulsions, etc. The lead of this system is it has a significant up to 1 nm in measuring the particle size. The particle size distribution of CNCs prepared by the process of acid hydrolysis coupled with sonication is presented in Figure 2. The result reveals that the fiber isolated from enset is in the range of nano (66 nm), and it has an intensity of 100%.
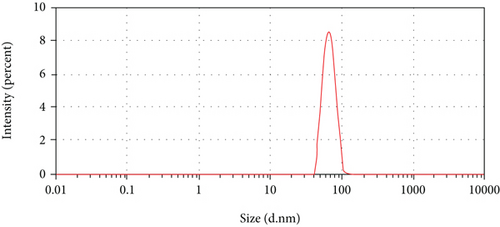
Britannica reported that the nanoparticle sizes can vary between 1 nm to 100 nm ranges [37]. [38, 39] reported that the nanocellulose size of 115 nm and 70 nm, respectively. [40] reported that the size distribution of nanocellulose is about 100 nm with a unimodal peak. Determining the distribution of particle size by laser diffraction produces the most promising results [41].
3.2.3. SEM Analysis
The dimension and the morphology of the enset fiber are affected by acid hydrolysis and sonication treatment. Figure 3 presents the SEM morphology of the enset fiber at different steps of treatments.
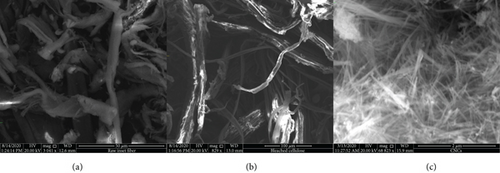
Figure 3(a) presents the SEM morphology of raw enset fiber. The untreated raw enset fiber surface is accredited to the existence of lignin, hemicellulose, wax, pectin, oil, etc. Succeeding treatment with alkali and bleaching of enset fibers produces surface morphology that confirms removal of lignin, hemicelluloses, and other extractives components (Figure 3(b)). The effect bleaching treatment with the mixture of acetic acid and sodium hypochlorite solution was manifest through the assessment of surface morphology in Figure 3(b). This phenomenon is also supported by physiochemical composition analysis. It is observed that the enset fiber separated into individual fibers and finally, the CNCs were isolated from it using acid hydrolysis and sonication of the fibers (Figure 3(c)). Further, it indicates that practically all of the components that attach the fibril bundle assembly of the enset fibers were eliminated under the strong chemical treatment and sonication.
The obtained result also demonstrates the effectiveness of the parameters used during hydrolysis and also validates that CNCs’ aqueous suspensions contained individual nanocrystals. From these images (Figure 3(c)), it is also observed that the chemical treatment coupled with mechanical treatment affects the morphological structure of the fibers concerning the size.
3.2.4. XRD Analysis
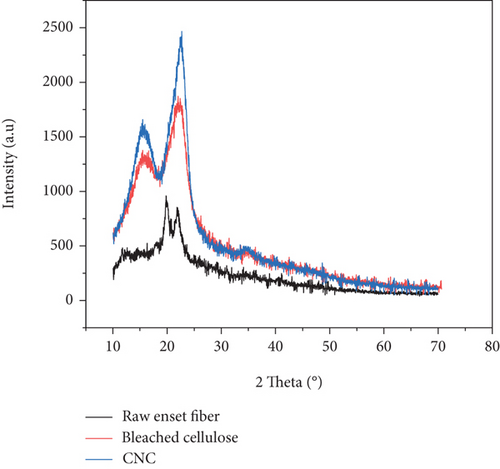
The XRD intensity curve of raw enset fiber, encet fiber cellulose, and CNCs is presented in Figure 4. Peaks at 2θ =15.58 and 22.13 have appeared in Figure 4, which signifies the characteristics features of the crystalline region. This typicality is alike to cellulose type-I material. According to previous literature works, these crystallographic planes epitomize the CNC sample in structural category of cellulose Iβ [42]. There is a valuable difference in the intensity of peak between the three samples which indicates the difference in index of crystallinity. The crystallinity area of the raw enset fiber (Table 4) was much lower than that of the bleached and acid hydrolysis-treated enset fiber. This phenomenon is due to the removal of lignin and hemicelluloses components in alkaline, the bleaching treatment, and acid hydrolysis. This result was endured by chemical composition and FTIR analysis.
| Treatments | Index of crystallinity | Average crystalline size (nm) | d-spacing (Å) |
|---|---|---|---|
| Raw enset fiber | 10.4264% | 0.06437 | 4.2585 |
| Bleached cellulose | 63.9827% | 0.23265 | 4.0186 |
| CNCs | 80.91% | 1.56888 | 3.9734 |
As presented in Table 4, the highest crystallinity percentage was obtained after the hydrolysis treatment. This is due to the amorphous components of enset fiber that was acid hydrolyzed; lignin and hemicellulose components were removed in turn increase the yield of cellulose nanocrystals [1, 33, 34]. The space between atoms’ lattices was decreased after each treatment step. The obtained data was reinforced by the area value of the domain crystalline structure.
As seen from Table 4, the crystallinity index has a direct relationship between crystallites thickness. After hydrolysis reaction and sonication, the thickness of the crystals has increased that indicates the contact surface area increment of the crystalline structure. Different researchers who have worked on nanocellulose material isolated from agricultural residues reported similar results [1, 5].
3.2.5. FTIR Analysis
Amorphous hemicellulose, lignin, and crystalline cellulose are the main components of natural fiber, and with the aid of FTIR, their functional groups can be characterized [5, 18, 20]. Raw enset fiber, bleached enset fiber cellulose, and CNC FTIR spectra are given in Figure 5.
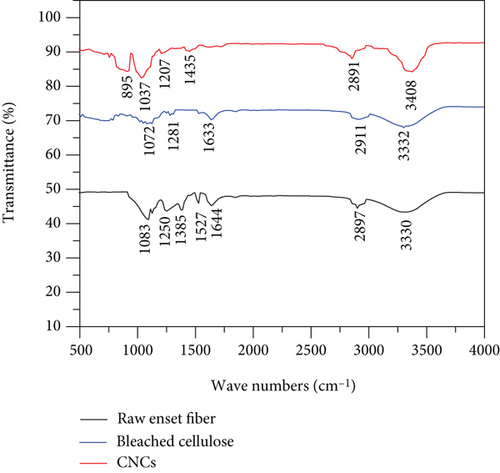
The FTIR spectrum acquired cellulose nanocrystal isolated from enset fiber corresponds to the characteristic spectrum of natural nanocellulose material (Figure 5). The typical broad peak in the province of 3330-3408 cm-1 confirms the existence of stretching motion hydrogen-bonded -O-H. The small peak in the zone of 2897 cm-1 corresponds to C-H stretching of the alkane group. Strong alkane compound (C-H stretching) functional group found in the region of 2911 cm-1. These clusters of peaks signify that all of them have aliphatic saturated functional groups.
The detected peak around 1435 cm-1 in all samples indicates that the existence of -OH bending absorbed water. The raw enset fiber has lower transmittance than the bleached cellulose and cellulose nanocrystal. It also has a characteristics peak at 1250 cm-1 and 1527 cm-1 because of the presence of streaking C=O double bond. This reveals the existence of lignin and hemicellulose in the untreated fiber [5]. This peak did not appear after pretreatment and acid hydrolysis of the enset fiber.
The characteristics peak at 1644 cm-1 shows the presence of the hemicellulose or the ester linkage of the carboxylic group of ferulic and p-coumaric acids of lignin and hemicelluloses [40]. This was disappeared after the treatment process.
The peak observed at 895 cm-1 shows the presence of β-glycosidic linkages in cellulose [43]. These results were confirmed by chemical composition investigation too.
3.2.6. Thermal Stability Analysis
The thermal stability behaviors of raw enset fibers, bleached cellulose, and CNC samples were analyzed using TGA. The results of TGA and DTG curves for each sample are presented in Figure 6. Previous literature works regarding fiber and fiber-based nanocellulose categorize the thermal degradation stages as two main parts [5].
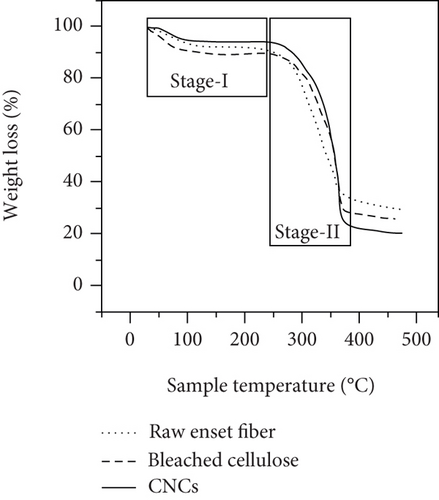
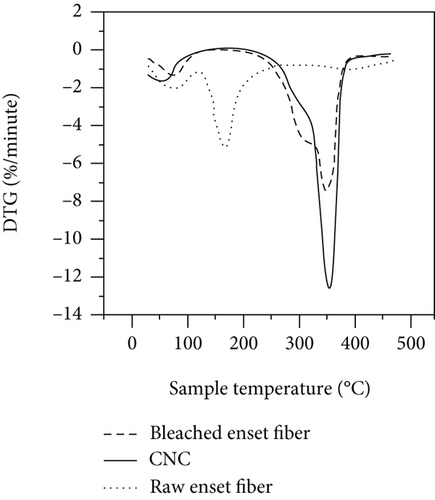
The temperature range from 25 to 185°C covers the initial weight loss, and it is called stage I. In stage I, the weight loss of the samples is 7.1%, 7.15%, and 3.77% that corresponds to raw enset fiber, bleached cellulose, and CNCs, respectively (Figure 6(a)). The equivalent stages of the DTG graph also show a minor trough of about 102°C for a similar reason. As observed in DTG curves (Figure 6(b)), also, the raw enset fiber had a sharper V-shaped than the curves of bleached cellulose and CNCs. The maximum weight loss observed at stage I was 7.43% owing to a more swollen and less compact characteristic structure. The treated enset fiber with alkaline treatment, digesting, and acid hydrolyzed lost a few weight since the hemicellulose and lignin components have been eliminated as stated in different literature works [2, 5, 20].
The temperature from 190 to 395°C (active pyrolysis) is called stage II. At this stage, substantial weight losses are recorded. Previously studied data shows that lignin and hemicellulose degrade mainly in the temperature range of 200 to 315°C [5]. Stage II is further divided into two parts, (190-350°C) and (350–395°C). Raw enset fiber, about 279°C temperature of degradation, losses a large amount of its weight at starting of stage II or in the stage of pyrolysis than bleached cellulose and CNC.
4. Conclusions
In the present work, RSM was used to determine the optimum value of parameters that could maximize the yield of CNCs during the acid hydrolysis and sonication treatment. Accordingly, second-order polynomial predicts the yield of CNCs. The predicted and actual values are in respectable agreement with each other (R2 = 99.3%). ANOVA analysis showed the effects of process parameters, and their interactions influence significantly on the CNC yield. The values of optimum isolation (77.69% of CNCs) levels are H2SO4 concentration (51.6 wt. %), reaction temperature (47°C), and reaction time (65.5 min). The present study undoubtedly indicated that the isolation of CNCs from raw enset fiber can be ameliorated using optimized process parameters, and the obtained CNCs showed excellent properties regarding crystallinity index and crystallite domain and thermal stability. FTIR, XRD, TGA, PSA and chemical compositions investigation support the claims made in this study. The SEM morphology of CNCs reveals the structure and arrangement of the fiber bundle inside of enset. XRD study indicated that the crystallinity of yielded products had been improved after each successive treatment subjected to the treated fiber. The crystallinity index of bleached cellulose and CNCs was 63.98% and 80.91%, respectively. And the average crystalize size was obtained at 66 nm. FTIR spectrum indicated that the reduction and removal of lignin, hemicellulose, and other amorphous parts found in raw enset fibers. These remarkable findings of enset fiber nanocellulose indicate that CNCs could be utilized as striking reinforced material for a biobased film.
Disclosure
This research did not receive any specific grant from funding agencies in the public, commercial, or not-for-profit sectors.
Conflicts of Interest
The authors declare that they have no conflicts of interest.
Authors’ Contributions
Corresponding author ensures that the descriptions are accurate and agreed by all authors. Surafel Mustefa Beyan (first author and corresponding author) contributed to the primary data collection and carried out experimental work, designed the experimental setup and do characterization of the samples, and contributed to draft formulating, draft checking, and manuscript writing and finalizing. Temesgen Abeto Amibo designed the experiment and provided necessary facilities. Venkatesa S. Prabhu edited the paper and assisted in writing papers and overall improved the manuscript. Abraham A. Getahun assisted in the characterization of the sample.
Acknowledgments
The authors would like to extend their sincere appreciation to the Department of Material Engineering at Jimma University for providing facilities and laboratories for this research.
Open Research
Data Availability
The data used to support the findings of this study are included within the article.


