A Method to Simulate the Migration and Accumulation of Hydrocarbon with Analogue Modeling
Abstract
Subsurface migration and accumulation of oil and gas have interested researchers for a long time, but these processes may occur over very long geological periods and are difficult to observe directly, so experimental simulations are warranted. In this study, an experimental method was developed to model hydrocarbon migration in the subsurface structure. Oil migration was simulated in a sandbox model, and industrial CT scanning was used to observe both the internal geometry of the model and the oil migration pathways. In the sandbox model, a NaI solution was used to simulate water, white oil was used to simulate hydrocarbon, and fine quartz sand, glass bead, silica powder, and brown corundum were chosen to represent brittle crust, based on suitable material parameters. A NaI-saturated layered sandbox model was constructed with an along-strike basal discontinuity, which during compression allowed a simple anticline with doubly verging reverse faults to form. Oil was then released continuously at a low rate from an orifice under one limb of the anticline. Initially, the oil migrated vertically through the fault zone until it reached the top of the fault zone; it then migrated laterally along the core of the anticline, saturating a model reservoir by buoyancy and capillary force. This experimental analog helps to explain hydrocarbon migration and accumulation within the Anjihai and Santai anticlines in northwest China.
1. Introduction
Hydrocarbon migration from source rocks through water saturated carrier beds, faults, and unconformities to reservoir rocks is a complex subsurface process [1, 2]. Although migration is important to hydrocarbon exploration, our understanding of the process has been limited by the long geological time involved and by the inability to observe it directly [3–6].
Physical experiments can be effective methods to study the process of oil migration in porous media (e.g., [7, 8]). Early experiments were limited by observation techniques; in most published works, researchers could only observe oil migration pathways along the edges of the models [9, 10]. With recent developments in science and technology, new technical methods have been used to observe the oil migration process, including migration pathways and oil saturation: (a) ultrasonic techniques [11], (b) magnetic resonance imaging (MRI; [12–14]), and (c) X-ray computed tomography (CT; [15–18]).
Analogue modeling is an effective method to study the mechanics, kinematics, and dynamics of geologic structures and can help us better understand geological processes in space and time [19–24]. Among recent sandbox studies, new technical approaches are being used to analyze the sand models, such as laser scanning [25, 26], strain gauges [27, 28], centrifuges [29, 30], particle imaging velocimetry (PIV; [24, 31, 32]), and X-ray computed tomography (CT; [33–35]).
The previous physical experiments to study oil migration were commonly focused on oil migration in reservoirs, and did not combine oil migration with structure. Therefore, in order to study oil migration within a subsurface structure, this paper innovatively combined oil migration with structural analogue modeling.
Prior research has shown that although ultrasonic techniques and magnetic resonance imaging allow observation of migration pathways in porous media models, neither technique allows observation of the distribution of different granular materials and the location of fault zones through density differences. In this study, we selected an industrial CT to visualize both the internal geometry of the sandbox model and oil migration and accumulation.
Colletta et al. [36] have shown that CT is a nondestructive technique to analyze the internal kinematic evolution of a physical model. The CT technique is fundamentally based on the distinct attenuation of X-rays through different materials as a function of material density, effective atomic number, and thickness [37]. As the experimental materials have distinct attenuation values, their boundaries can be visualized, and a stratified model can be obtained.
In this study, a simulation experiment was carried out and the suitable fluid and granular materials were tested and proposed. The sandbox model experiment was focused on oil migration pathways and on comparing the model results with the hydrocarbon accumulation profile. The model results showed that the experiment simulated the process of oil migration and accumulation in the underground structure well, especially under the influence of fault zones. The results of the simulation experiment provide an analogue to better understand the controls on oil migration and accumulation in the subsurface fault zones of the Anjihai and Santai anticlines in northwest China.
2. Experimental Approach
2.1. Experimental Materials
To simulate underground hydrocarbon migration, the sandbox model was saturated, but instead of water and in order to increase the density difference with oil [16], a NaI solution was used; this resulted in more distinct X-ray attenuation values that improved the CT visualization of fluid boundaries. The NaI solution was a 10 : 17 mixture of NaI and water by weight, with a density of ~1.380 g/cm3, viscosity of 1.348 mPa, and surface tension of 67.0 mN/m. The oil used for the experiment was white oil, with a density of ~0.824 g/cm3, viscosity of 6.266 mPa, and surface tension of 27.8 mN/m. All parameters were measured at 20°C.
In the sandbox model, the reservoir rock was represented by glass bead and the cap rock by pure silica powder. A layer of fine quartz sand was put on the bottom of the sandbox so that the oil migration pathway would not be affected by the different wettability and pore structure of the sandbox bottom boundary compared with the porous medium [11, 14]. A layer of brown corundum was placed on the silica powder to keep it stable during deformation and oil injection, as the silica powder was unstable when settled in the NaI solution. When the glass bead, silica powder, and fine quartz sand were saturated with NaI solution, their attenuation differences were diminished and their boundaries became unclear. Therefore, thin layers of brown corundum were placed between every two layers of the materials as marker layers, so that structural features would be clearly displayed.
A natural sand was used whereas the glass bead, silica powder, and brown corundum were artificial products. From information provided by the suppliers, the glass bead has a grain size of ~550 μm, the silica powder has a grain size of ~18 μm, the brown corundum has a grain size of ~150 μm, and the quartz sand has a grain size range of 120–150 μm.
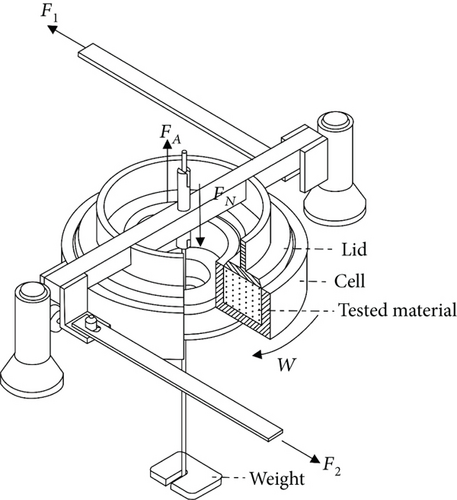
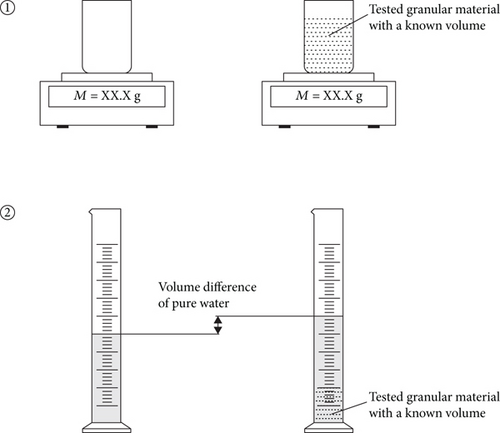
The bulk density is calculated by measuring the mass of a known volume of material with an electronic balance. To be consistent with the stacking pattern in the analogue model, the granular materials were sifted into the measurement container from a height consistent with the analogue experiment. The porosity was determined using a measuring cylinder. A known volume of a material was poured into a measuring cylinder containing a certain amount of pure water, and the volume of the empty space and material particles were obtained through the volume difference of the pure water (Figure 2). The porosity was then calculated from the known volume of the empty space divided by the total volume of the material. The approximate values of bulk density and porosity for the quartz sand are 1390 kg/m3 and 38.0%, for the glass bead are 1490 kg/m3 and 36.5%, for the silica powder are 1400 kg/m3 and 32.5%, and for the brown corundum are 1770 kg/m3 and 42.7%.
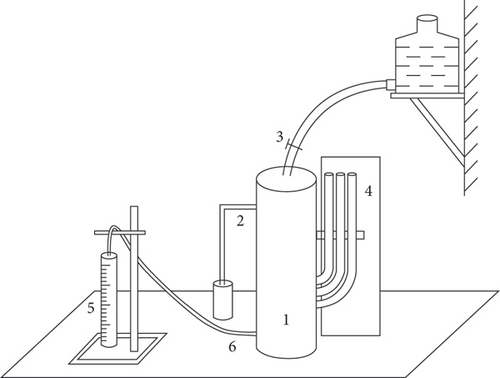
For comparison, all the granular material properties are listed in Table 1.
| Materials | D (μm) |
C (pa) |
ϕ (°) |
ρb (kg/m3) |
θ (%) |
K (m2) |
|---|---|---|---|---|---|---|
| Quartz sand | 120-150 | 69 | 35.2 | 1390 | 38.0 | 1.8 × 10⁻¹¹ |
| Glass bead | 550 | 23.2 | 27.4 | 1490 | 36.5 | 2.9 × 10⁻¹⁰ |
| Silica powder | 18 | 354.7 | 38.8 | 1400 | 32.5 | 3.0 × 10⁻¹³ |
| Brown corundum | 150 | 56.1 | 37.2 | 1770 | 42.7 | 2.4 × 10⁻¹¹ |
2.2. Experimental Setup
To compare the model results with the geological sections and study the migration and accumulation in the anticlines, a simulation experiment was carried out. An along-strike basal velocity discontinuity was incorporated to allow for the formation of noncylindrical structure in the center of the experiment [43].
The model was run in a plexiglass rectangular box with a horizontal rigid basement, two stationary sidewalls, one fixed wall, and one moving wall. The basal velocity discontinuity at the bottom of the sandbox was created by a plexiglass sheet, measuring 70 × 200 × 2 mm, which was fixed to the moving wall and was able to slide over the basement during shortening. A motor-driven piston was connected to the moving wall to move it forward. The sandbox had a fixed width of 200 mm, depth of 120 mm, and an initial length of 170 mm parallel to the axis of compression. The sandbox was cleaned with an alcoholic solution prior to layering in the granular materials.
The NaI solution was poured into the box before layering to ensure there was no air in the model. The sand body, which was 45 mm thick, had four layers consisting of (from the base up) the following: fine quartz sand 7 mm thick, glass bead 23 mm thick, silica powder 12 mm thick, and brown corundum 13 mm thick (Figure 4). The shortening rate was 0.0005 mm/s, and the shortening length was 40 mm. After the deformation, oil was injected into the sand body by pumping through an orifice under one limb of the anticline at a constant rate and set distance from the bottom. During the injection of the oil, successive internal cross-section images were obtained near the injection orifice by industrial CT.
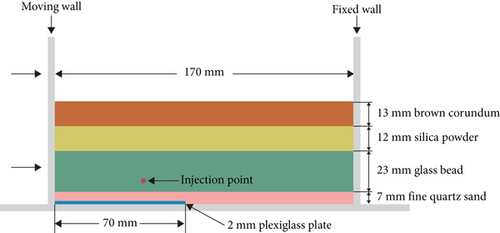
Due to the low speed of the current industrial CT in single slice scanning mode, and the fast oil migration process in the model, only a single slice of the model could be scanned at each stage during the experiment. Experimental results could be improved in the future as industrial CT becomes more efficient and increased data volumes can be scanned.
3. Experimental Results
The model deformation resulted in a doubly verging thrust system and a wide uniform anticline, with thrusts nucleated at the leading edge of the basal plate in the center of the experiment (Figure 5). After the deformation, oil was injected at a relatively low rate of about 0.02 ml/min to prevent the injection pressure from affecting the migration path of the oil. The location of the oil injection orifice is shown in Figure 5.

The result shows that the fault planes forming in granular material correspond to zones of dilation and act as conduits that oil migrates preferentially within the fault zone (Figure 6). In the experiment, the fault zone had an effect on the oil migration pathway since the beginning of oil injection because the oil injection orifice was just below the fault zone. After 1 ml of oil was injected, because of the influence of the fault zone, oil migrated vertically up to the middle of the fault zone. After 2 to 3 ml of injection, oil continued to migrate vertically within the fault zone and migrate up to the top. After 4 to 5 ml of injection, the migration path in the fault zone widened. Finally, after 12 to 18 ml of injection, the oil migrated laterally along the core of the anticline and began to pool.
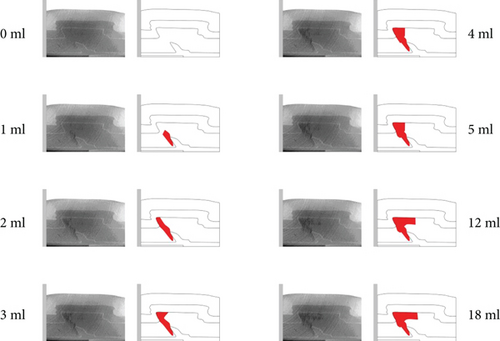
On the whole, the fault zone controlled the pathway of oil migration in the modeling experiment. The oil migrated vertically to the top through the fault zone and then migrated laterally and began to pool.
4. Discussion
Faults play an important role in hydrocarbon accumulation, affecting oil and gas reservoirs through all phases of exploration and development [44–46]. Faults can act as conduits or barriers, depending on whether they are active or inactive during hydrocarbon migration [47–50]. The experimental result shows that the fault zone has a great influence on the oil migration pathway and acts as conduits in sandbox modeling experiments (Figure 6).
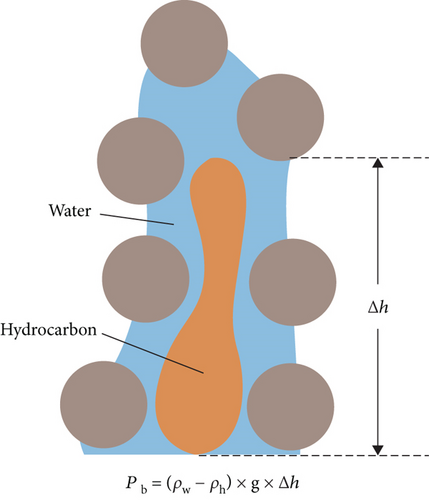
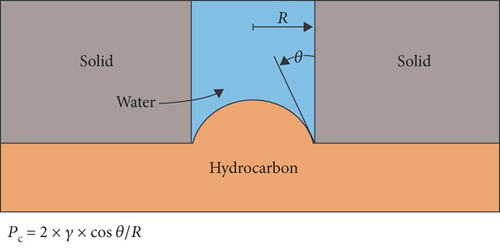
In sandbox modeling experiments, the normal arrangement of grains is disturbed within the fault zones, causing the fault zones to become zones of dilation and the bulk density decreased within the fault zones. This results in a decrease of X-ray attenuation in the fault zones, allowing the development of the faults to be observed [53–55]. For oil migration in the sandbox modeling experiments, the decrease of the bulk density within the fault zones causes the pore size within the fault zones to be greater than without. Therefore, the capillary force which is the main restricting force for oil migration is smaller within the fault zones than without and oil preferentially migrates within the fault zones. This is consistent with what was observed in this study that the faults serve as flow paths for the oil.
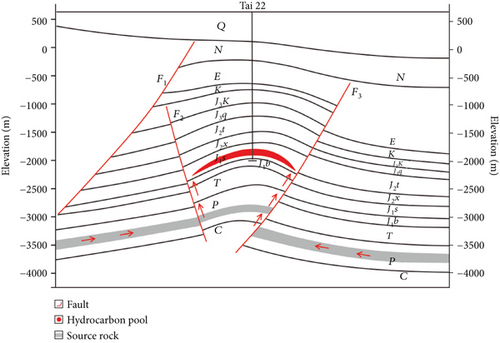
The results of the simulation experiment provide an analogue to help understand hydrocarbon migration and accumulation in the Anjihai anticline (Figure 9) and the Santai anticline (Figure 10) in northwest China, which are similar to the structure formed in the sandbox model. The structures and the well information of the two anticlines have been studied by researchers from the Research Institute of Petroleum Exploration and Development-Northwest, PetroChina.
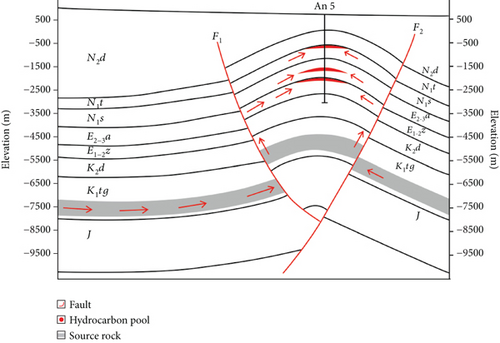
The Anjihai anticline, a typical fault-related fold located in the Northern Tianshan fold-thrust belt, is controlled by the North Anjihai and the South Anjihai faults. Fine-grained Cretaceous source rocks within the oil generation window are developed within the Anjihai anticline, and a hydrocarbon pool was discovered in Cenozoic clastic reservoirs drilled by the An 5 well. The hydrocarbon pool in N1s Formation generated in a 6 m thick muddy siltstone. Its porosity is 14.60–17.70%, and permeability is 0.97–6.14 × 10⁻³ μm2. The vertical and horizontal migration distances are 4.4 and 3.9 km, respectively. The hydrocarbon pool in E2-3a Formation generated in a 6 m thick siltstone. Its porosity is 6.30–6.48%, and permeability is 0.24–0.56 × 10⁻³ μm2. The vertical and horizontal migration distances are 3.4 and 3.8 km, respectively. The hydrocarbon pool in E1-2z Formation generated in a 4 m thick siltstone. Its porosity is 16.30–18.30%, and permeability is 5.16–8.13 × 10⁻³ μm2. The vertical and horizontal migration distances are 3.0 and 3.5 km, respectively.
Santai anticline is located in the footwall of Fukang fault, between the North Ganhezi and the South Ganhezi faults. The Permian Lucaogou Formation mudstones, the most important source rocks in Junggar Basin, are developed in this area at peak hydrocarbon generation maturity. Well Tai 22 was drilled through the Lower Jurassic clastic reservoir in the anticline, where a hydrocarbon pool was discovered. The hydrocarbon pool in J1s Formation generated in an 8 m thick muddy siltstone and fine sandstone. Its porosity is 9.43–23.30%. The vertical and horizontal migration distances are 2.5 and 2.9 km, respectively.
Comparing the modeling result with the two anticlines, it is clear that the faults acted as conduits, connecting the deeper source rocks with the shallow reservoirs. In the Anjihai anticline, the hydrocarbon generated in the Cretaceous source rock migrated laterally and then vertically to the Cenozoic reservoir through the fault system, finally accumulating in the core of the anticline. In the Santai anticline, the North Ganhezi and the South Ganhezi faults acted as conduits, connecting the deeper Permian source rocks with the shallow Jurassic reservoir. The hydrocarbon generated in the Permian source rocks migrated laterally and then vertically to the Jurassic reservoir through the fault system, finally accumulating in the core of anticline.
5. Conclusions
In this paper, an experimental method was developed to simulate hydrocarbon migration in the subsurface structure. The approach combined the initial selection of sandbox materials, testing their parameters, building the sandbox model, and injecting oil during sandbox deformation. Industrial CT scanning was used to track the progress of the analogue modeling experiment. A NaI solution and white oil were used as the fluid materials, and fine quartz sand, glass bead, silica powder, and brown corundum as the granular materials.
The deformed state sandbox model consisted of a broad anticlinal structure with a doubly verging thrust system. In the simulation experiment, oil was injected at a relatively low rate under one limb of the anticline, at a set distance above the bottom of the sandbox model. The experimental results showed that faults served as flow paths for the oil. Initially, oil migrated vertically to the top of the fault zone, and then laterally along the core of the anticline, pooling at the crest.
The Anjihai and Santai anticlines are similar to the structure formed in the analogue model. Comparing the model results with the subsurface structures provides an explanation of how oil migrated and accumulated in the two anticlines. In both anticlines, faults acted as conduits, connecting the deeper source rocks with the shallow reservoirs. The hydrocarbon generated in the source rocks migrated laterally, and then vertically to the reservoirs through the fault system, finally accumulating in the core of the anticlines.
Conflicts of Interest
The authors declare that they have no conflicts of interest.
Acknowledgments
We thank the Research Institute of Petroleum Exploration and Development-Northwest, PetroChina, for their help in the experiments. This study was funded by the National Natural Science Foundation of China (Grant No. 41927802) and National S&T Major Project of China (2017ZX005008001).
Open Research
Data Availability
The datasets used in the present study are available from the corresponding authors upon reasonable request.


