Fluid Performance in Coal Reservoirs: A Comprehensive Review
Abstract
The fluids in coal reservoirs mainly consist of different gases and liquids, which show different physical properties, occurrence behaviors, and transport characteristics in the pore-fracture system of coal. In this study, the basic characteristics of fluids in coal reservoirs are firstly reviewed, consisting of coalbed methane (CBM) components and physical properties of CBM/coalbed water. The complex pore-fracture system mainly provides the enrichment space and flow path for fluids, which have been qualitatively and quantitatively characterized by various methods in recent years. Subsequently, this study has summarized CBM adsorption/desorption behaviors and models, the CBM diffusion-seepage process and models, and gas-water two-phase flow characteristics of coal reservoirs. Reviewed studies also include the effects of internal factors (such as coal metamorphism, petrographic constituents, macroscopic types, and pore structure) and external factors (such as pressure, temperature, and moisture content) on CBM adsorption/desorption and diffusion behaviors, and the relationship between three main effects (effective stress, gas slippage effect, and coal matrix shrinkage effect) and the CBM seepage process. Moreover, we also discuss in depth the implication of fluid occurrence and transport characteristics in coal reservoirs for CBM production. This review is aimed at proposing some potential research directions in future studies, which mainly includes the control mechanism of the microscopic dynamics of fluids on CBM enrichment/storage; enhancing CBM desorption/seepage rate; and the synergistic effect of multiple spaces, multilevel flow fields, and multiphase flow in coal reservoirs. From this review, we have a deeper understanding of the occurrence and transport characteristics of fluids in pore-fracture structures of coal and the implication of fluid performance for CBM production. The findings of this study can help towards a better understanding of gas-water production principles in coal reservoirs and enhancing CBM recovery.
1. Introduction
Coal is one of the most widely available energy sources with a huge world consumption, which is formed from the remains of ancient organisms through deep burial and coalification under the conditions of incredible heat and pressure (Figure 1(a)) [1–3]. It is estimated that the global methane reserves in coal seams can be up to 269 × 1012 m3, which constrains production safety in coal mines and contributes significantly to greenhouse gas emissions [4]. From the last century, United States, Canada, and Australia have carried out extensive exploration and commercial exploitation of the CBM resource in multiple coal-bearing basins, such as San Juan Basin, Black Warrior Basin, Bowen Basin, and Surat Basin [5–9]. Due to the complex geological conditions of coal-bearing basins and primitive CBM development technology, the CBM commercial exploitation process is comparatively slow in China even though the total CBM amount is proven as high as 36.81 × 10¹² m3 [10, 11]. Since 2002, a breakthrough of CBM development has been made in the medium–high-rank coal reservoirs, and several large-scale CBM fields have been built in the southern Qinshui Basin and eastern margin of Ordos Basin, China [12–15]. The efficient development and utilization of CBM are of great significance to reverse the situation of coal mine safety production, improve the energy structure, and alleviate the natural gas supply shortfall.
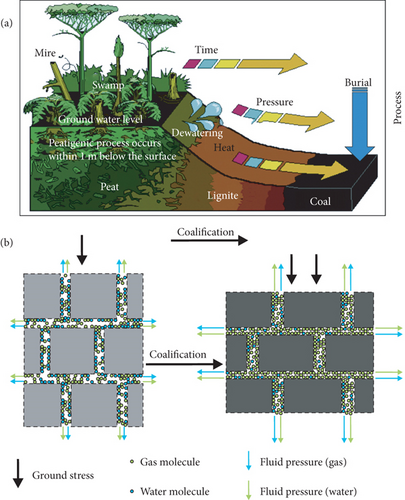
During the process of coalification, complex physical and chemical changes occur in coal-forming materials, which demonstrates the decrease of volatile fraction and water content, the increase of calorific value and fixed carbon content, and also the generation of fluids accompanied with methane as main components in coals (Figure 1(b)) [16, 17]. CBM mostly exists in the pore surface as the adsorbed state in a coal matrix and in the cleat/fracture system as the free state, whereas ground water is generally replenished into the coal seam and mainly migrates through the cleat/fracture system under reservoir pressure [18]. The pore structure of coals is characterized as a dual pore system consisting of micropores (<10 nm) and mesopores (10-102 nm) that provide a large pore surface area for CBM storage, and macropores/microfractures (>102 nm) that supply the pathway for CBM flow [19–21]. During the CBM production process, the reservoir pressure gradually decreases as the water in the coalbed is drained, and CBM desorbs from the pore surface and diffuses to the cleat/fracture system accompanied by an increase in effective stress and coal matrix shrinkage as gas desorbs [5, 22]. The increase of effective stress may cause the original pores and fractures to partially close, which can further result in a decrease in the porosity and permeability of coals [23], whereas the coal matrix shrinkage effect may lead to the cleat/fracture opening and an increase in permeability [24, 25]. Therefore, the occurrence and flow characteristics of fluids (CBM and water) in the pore-fracture system of coal reservoirs have a significant implication for understanding the CBM production characteristics and enhancing CBM recovery.
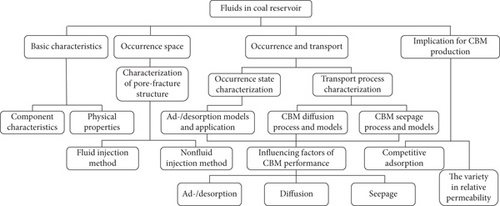
As shown in the general sketch in Figure 2, we firstly provided an overview of the basic characteristics of fluids in coal reservoirs, including the component characteristics of CBM and the physical properties of fluids in coal reservoirs. Secondly, different characterization methods of a pore-fracture structure were reviewed, and the characteristics and modelling of fluid occurrence and transport in coal reservoirs were expounded in detail. Moreover, the influencing factors of CBM adsorption/desorption and diffusion behaviors and the fluid seepage process were analyzed. Finally, we also studied the implications of fluid occurrence and transport characteristics for CBM production, and proposed three key scientific problems to be solved in future studies. Compared with previous studies, a comprehensive summary of different fluids in coal reservoirs has been made in this study, including occurrence properties, storage/transport characteristics, and their influencing factors. Meanwhile, the effects of fluid performance on CBM production characteristics have also been thoroughly summarized.
2. Basic Characteristics of Fluids in Coal Reservoirs
Fluids occurring in coal reservoirs mainly consist of CBM generated by coalification and water originating from adjacent strata [16, 17, 26]. The physical properties of fluids in coal reservoirs can be characterized by inertia, density, specific volume, compressibility, modulus of elasticity, thermal expansion, viscosity, and the surface tension/capillary phenomenon [27]. Moreover, the chemical properties of fluids mainly consist of their components, the determination and distribution of main ion concentration, and the plane distribution of pH value and its controlling factors [28]. Due to the special occurrence status and properties of fluids in coal, there is a special fluid-solid coupling state between fluids and the coal matrix.
2.1. Component Characteristics of CBM
The components of CBM mainly consist of hydrocarbon gases (CH4 and its congeners) and nonhydrocarbon gases (CO2, N2, H2, CO, H2S, He, and Ar). It is known that the main factors controlling the components of CBM are (1) microscopic components of coal, especially the abundance of hydrogen-rich components; (2) the degree of coal metamorphism; and (3) hydrogeological conditions, which affect the components of CBM by transporting the bacterial (biogenic) gas and dissolved gas [29]. For hydrocarbons, the CH4 content is generally greater than 80%, and the content of the other hydrocarbons (C2+) is comparatively smaller in CBM. It has been confirmed that the content of hydrocarbons increases with the increase burial depth in the same coal seam [17], whereas heavy hydrocarbons are mostly distributed below the oxidation zone of the coal seam and its content depends on the degree of coal metamorphism (medium − rank coals > low − and high − rank coals) [28]. Moreover, the content of nonhydrocarbon gases is typically less than 20% of the total CBM content in which the N2 content accounts for about 2/3 and the CO2 content approximately occupies another 1/3 [5]. The N2 molecule is small and moves quickly, and it is mainly influenced by the weight of overlying strata [17]. In contrast, CO2 is easily soluble and taken away by groundwater, and its content is mainly controlled by groundwater activities [30]. Similarly, the content of N2 and CO2 is also influenced by the burial depth of the coal seam and the degree of coal metamorphism [17]. Generally speaking, the content of N2 and CO2 in CBM is higher when the burial depth of the coal seam is shallower or the degree of coal metamorphism is higher.
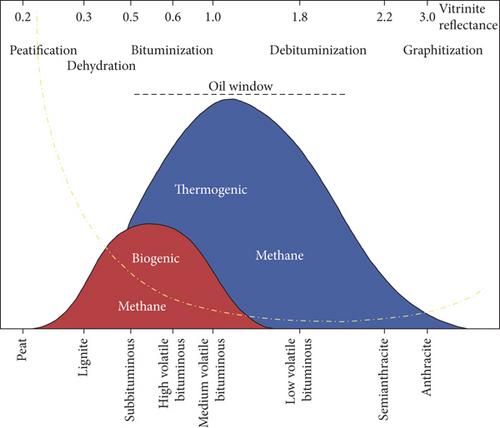
As the coalification deepens, biogenic gas and thermogenic gas are successively generated in coals, and the content of biogenic gas is much lower than that of thermogenic gas, as shown in Figure 3. For the same basin, the CBM in a shallow coal seam may be mainly the biogenic gas, whereas the CBM in a deep coal seam is dominated by the thermogenic gas [29]. The differences in generation time, formation temperature and pressure, the parent material, composition, and generation mechanism (presence of bacterial activity) of biogenic gas are quite different from those of thermogenic gas [31]. Biogenic gas is produced by CO2 reduction and organic acid fermentation, and its δ13C1 value is usually low (-55‰ ~ -90‰) because of the enrichment effect of organisms on 12C. In general, the biogenic gas generated by CO2 reduction has a light carbon isotope and is rich in deuterium, whereas the biogenic gas generated by the organic acid fermentation shows a heavier carbon isotope and consumes deuterium [5]. It is worth noting that the δ13C1 value of biogenic gas produced by CO2 reduction is related to the δ13C1 value of the CO2 matrix and formation water. Compared to biogenic gas, thermogenic gas demonstrates the following characteristics: (1) heavy hydrocarbons are generally found in high/medium volatile bituminous coals and other higher-rank coals; (2) the 12C-12C bond in the gas molecule breaks more frequently than the 12C-13C bond as the degree of coalification increases, which causes the enrichment of heavy isotope 13C in CH4 and C2H6 during the generation of thermogenic gas; and (3) thermogenic gas is comparatively rich in deuterium with the increase of coalification [31].
2.2. Physical Properties of CBM and Water
As shown in Table 1, the occurrence of CBM in coal reservoirs is mainly comprised of the free state, the adsorbed state, and the water-soluble state [26]. The proportion of CBM with different occurrence states depends on the pore-fracture structure, reservoir temperature and pressure, the defects of the coal macromolecular structure, and the adsorption capacity: (1) The proportion of the free-state CBM generally accounts for about 8% to 12% under the condition of reservoir pressure and temperature. However, its proportion will gradually increase when the reservoir pressure is reduced by drainage during the CBM production process. (2) The adsorbed-state CBM refers to a general term for CBM adsorbed in fractures, microcracks, and micropore surfaces of coal reservoirs, which accounts for 80% of the total amount of CBM. There is a constant motion and exchange between adsorbed and free CBM (dynamic equilibrium status) under conditions of reservoir temperature and pressure. (3) The proportion of the dissolved-state CBM is approximately 3%, and the solubility of CBM increases with an increase of pressure [32]. Moreover, the solubility of CBM decreases with an increase of salinity. The solubility of CBM decreases with an increase in temperature when the temperature is <80°C, whereas the solubility of CBM increases with an increase in temperature when the temperature is >80°C [33]. Therefore, the dissolved gas may significantly increase in the coalbed water under high temperature and pressure or if saturated with CO2.
| Occurrence location | Occurrence states | Proportion (%) |
|---|---|---|
| Within water-soluble fractures, macropores, and block spaces | Free, water-soluble | 8~12 (1~3) |
| Fractures, macropores, and internal surfaces of blocks | Adsorbed | 1~5 |
| Microfractures and micropores | Adsorbed | 75~80 |
- Note: medium rank coal, with a buried depth of 800-1200 m.
The main sources of coalbed water are the primary sedimentary water in the peat bog, the converted water in the coal-forming process, the infiltration water, and the water introduced by tectonic movement [32]. During the coalification process, a series of physical and chemical reactions happen to coal, such as carburetion, dehydration, aerogenesis, and the reduction of porosity. Meanwhile, CBM is firstly gathered in the pore-fracture system of coal, and then water is gradually displaced between coal particles with the increase of gas pressure in pores, which results in CBM occupying micropores and coalbed water existing in larger pores. An interesting phenomenon is that partial coalbed water has not been dislodged and occurred in micropores with an adsorbed state, forming the coexistence of gas and water [34].
3. Characterization of Fluid Performance in CBM Reservoirs
Due to the unique and complex pore-fracture structure of coals, the occurrence and transport process of fluids demonstrate the multiphase and multiscale characteristics in coal [27]. Therefore, it requires diversified methods and appropriate instruments to investigate fluid performance in the pore-fracture structure of coals.
3.1. Characterization of Pore-Fracture Structure
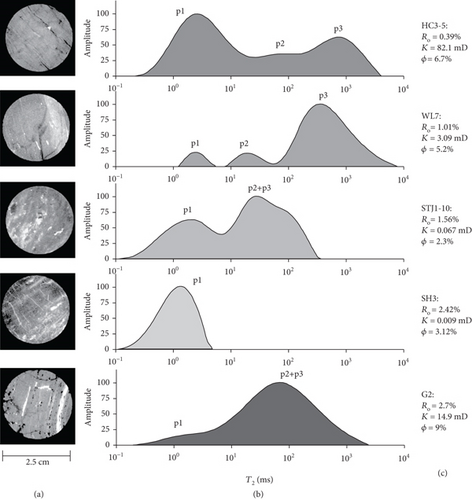
For over decades, characterization techniques of the pore-fracture structure have evolved from the observation of orientation/spacing to the understanding of spacing, size, orientation, connectivity, and porosity for both pores and fractures/cleats [35, 36]. The quantitative characterization and quantitative analysis techniques of the pore-fracture structure have been gradually developed as well as widely used [37], which are divided into two types: the fluid injection method and the nonfluid injection method (Figure 4). The fluid injection method mainly uses liquids (e.g., H2O and Hg) and adsorptive gases (e.g., CO2 and N2) to inject powder/core coal samples under different pressure conditions, and while it records the corresponding injection volume or adsorption amount data. Generally, CO2 adsorption, low-temperature N2 adsorption, and mercury intrusion porosimetry (MIP) methods are combined to quantitatively characterize the micro–nano-sized pore-fracture structure of coal in which the pore diameter distribution, pore volume, specific surface area, and pore connectivity of coal samples can be calculated by different mathematical methods, such as the Brunauer, Emmett, and Teller method (B.E.T. method) [38]; the Barrett, Joyner, and Halenda method (BJH method) [39]; and the Washburn equation [40]. Moreover, the heterogeneity of the pore-fracture at different scales can also be quantitatively described by the fractal dimension, which is calculated from the pore volume or specific surface area data by using different mathematical models [41]. Recently, nuclear magnetic resonance (NMR), as an accurate and nondestructive technique, has been rapidly developed and widely used to quantitatively characterize the full-size pore-fracture structure of coal [42]. Yao et al. [42–44] firstly used the low-field NMR (LFNMR) method and the transverse relaxation time (T2) cutoff-value-based model to study the pore type, pore structure, porosity, and permeability of coals, and meanwhile, they compared the results of LFNMR with other traditional methods in revealing the characteristics of the pore-fracture structure (Figure 5). It is found that the distribution of NMR T2 is closely related to the pore structure and coal rank of coal, and the porosity of coals decreases with an increase in coal rank [45]. Meanwhile, the variation of pore-fracture heterogeneity caused by the effect of stress can also be evaluated based on the T2 spectrum [46].
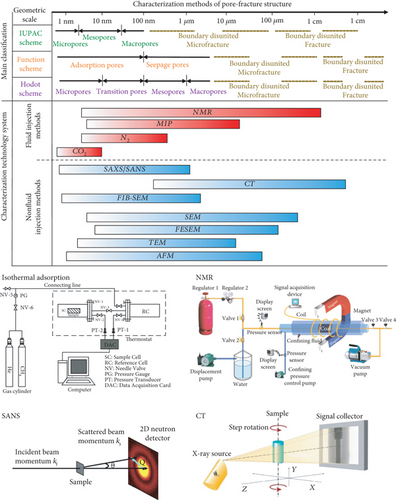
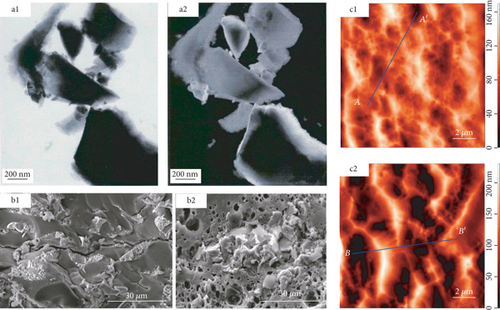
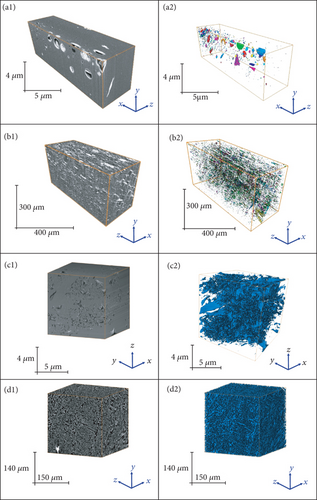
Due to the limitation of the experimental principle and method, fluid injection methods are mostly used to characterize open pores in coal and may change the original pore-fracture structure because of the damage in a coal sample [47]. On this basis, a variety of nondestructive and efficient nonfluid injection methods, such as transmission electron microscopy (TEM), scanning electron microscopy (SEM), atomic force microscopy (AFM), focused ion beam scanning electron microscopy (FIB-SEM), and microfocus computed tomography (μ-CT), have been gradually applied to more accurately and quantitatively characterize the pore-fracture network of coals. Hereinto, TEM, SEM, and AFM techniques are usually used to analyze the size, shape, connectivity, and morphological characteristics of a pore-fracture in two-dimensional (2D) surface (Figure 6) [48–50]. In recent years, it has become a hot topic to obtain the quantitative data of pore-fracture structures from 2D SEM images on the basis of the qualitative analysis of pore-fracture morphology in coal. Moreover, based on the continuous scanning technology and the three-dimensional (3D) reconstruction method, FIB-SEM and μ-CT techniques can effectively reveal the continuous changes and the strong heterogeneity of a pore-fracture structure in 3D space (Figure 7) [51, 52]. Meanwhile, CT scanning can obtain the aperture, direction, and spacing distribution of cleavage [53], determine the pore size, distinguish between organic and mineral components combined with other methods (between-class variance maximisation) [54], and further characterize the occurrence of mineral components in coals [55].
In general, the research progress and development trends of the quantitative characterization of the pore-fracture of coal are mainly concentrated on three aspects: (1) the systematic and advanced quantitative evaluation of a pore-fracture structure based on a variety of characterization techniques; (2) the improvement of the accuracy of characterization methods in quantitative characterization of a pore-fracture structure by introducing the knowledge of other disciplines; (3) the establishment of a more advanced, quantitative, and practical characterization system for pore-fracture structures.
3.2. Fluid Occurrence Characteristics and Modelling
3.2.1. Characterization of Fluids with Different Occurrence States
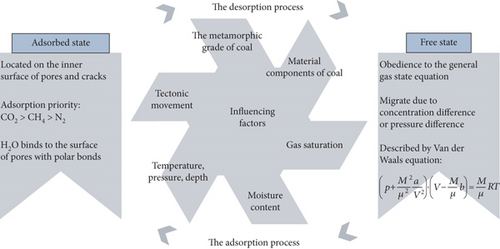
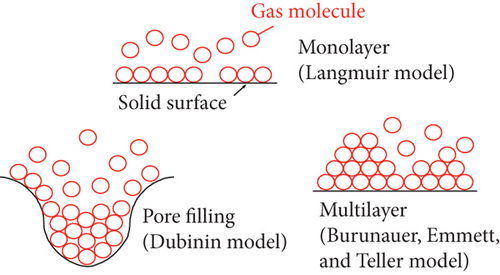
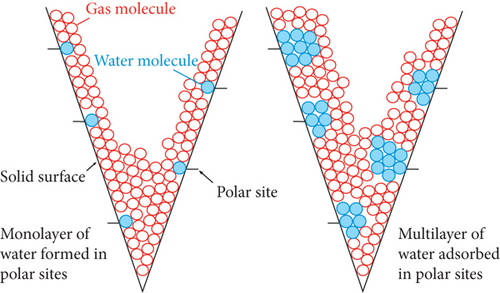
For dissolved gas, the solubility experiment of CH4 in coalbed water shows that (1) the solubility of CH4 in mineralized coalbed water is greater than that in deionized water, which is more obvious with the higher reservoir pressure [60]; (2) for the same coal seam, the solubility of CH4 in coalbed water samples increases with increasing reservoir pressure [32]; and (3) the effect of salinity on CH4 solubility is obvious when the temperature and pressure are low, whereas CH4 solubility is obviously weakened as the temperature and pressure increase [26, 32].
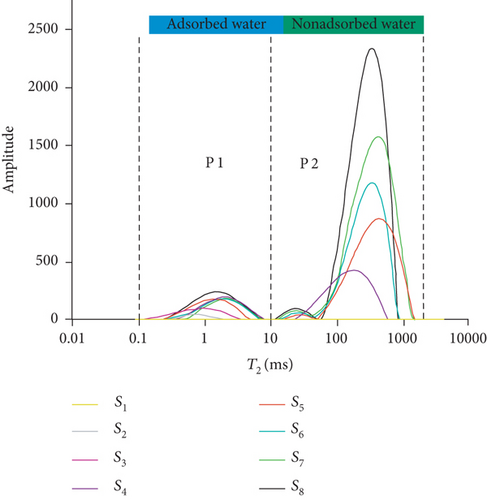
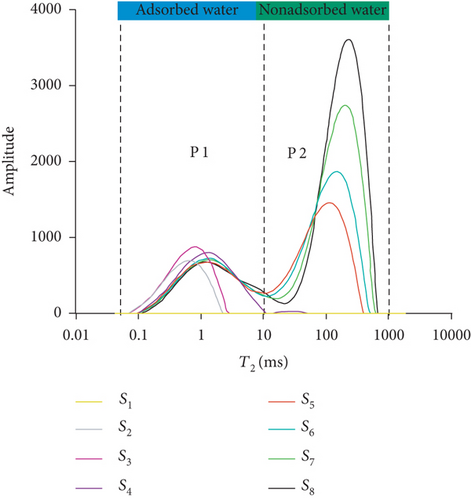
The traditional methods for determining gas adsorption/desorption behavior mainly consist of the manometric method [61], the volumetric method [62], and the gravimetric method [63]. The manometric method and the volumetric method both measure the gas adsorption amount by recording the adsorption volume corresponding to the pressure, while the gravimetric method obtains the gas adsorption amount through a high-precision balance [28]. The adsorption and desorption hysteresis usually occurs in CH4, CO2, and N2 or multicomponent gas isotherms by using the volumetric method [64]. Recently, a NMR-based method has been developed to determine the gas/water adsorption/desorption process in coals by utilizing the correlation between the hydrogen strength and CH4/H2O volume (Figure 10) [44, 65, 66]. The advantage of this NMR-based method is that the gas/water adsorption process can be detected in real time [44]. However, it is noted that the calculated values of the Langmuir volumes from the NMR method are usually lower than those from the volumetric method, which is related to the slight change of temperature, the undetected CH4 with relaxation less than 0.1 ms, and more desorbed behavior under the magnetic field. In addition, mathematical simulation and molecular methods have also been established to explore the adsorption/desorption behavior of fluids in coals [67, 68].


3.2.2. CBM Adsorption/Desorption Models and Application
Table 2 shows the classic CBM adsorption/desorption models, which are widely used to characterize the CBM adsorption/desorption behavior and amount. Based on the monolayer adsorption theory, the Langmuir equation assumes that gas is adsorbed on a solid surface as a single molecule and the thickness of adsorbed gas is one molecular layer [69]. The B.E.T. equation is based on the Langmuir single-layer adsorption model, and its theory points out that the gas adsorbed on the pore surface is a multimolecular layer adsorption phenomenon in which the first layer is composed of the gas molecules adsorbed on the surface under the Van der Waals force, and the other layers mainly depend on the interaction force between gas molecules [38, 70]. In general, the B.E.T. equation is often used to study water-coal interaction and low-pressure coal-gas interaction. The adsorption potential model is mainly applied to discuss the gas adsorption of microporous solid surfaces, which is based on the theory that the gas adsorption process is not adsorbed on the pore surface of coal, but on the aggregation of gas molecules under the force field [71]. For a microporous structure, the residual force field on the surface may generate a superposition of force fields because the spacing of the pore wall is very small, and a superimposed force field area may be formed in the micropores, which results in a stronger gravitational field in the micropores for gas molecules. On this basis, a variety of classic adsorption isotherm equations have been established, such as the Dubinin-Astakhov (D-A) equation [72] and the Dubinin-Radushkevich (D-R) equation [73]. The D-A equation can well fit most of the gas adsorption data though its theoretical basis remains incomplete and unknown [74]. The D-R equation is a special case of the D-A equation and assumes that the pore distribution of coal is the Gaussian distribution, which has good applicability of studying gas adsorption in a uniform microporous system with a narrow pore size distribution [73, 75]. According to the change of interfacial tension before and after gas adsorption, the gas adsorption amount can be calculated by the Gibbs adsorption formula, and meanwhile, the state information of gas molecules adsorbed on the interface can be obtained [76]. The basic theory of this formula is to use the classic thermodynamic theory to study the adsorption equilibrium process, and consider the adsorbed gas as a 2D microscopic fluid to study its adsorption process. Moreover, the gas adsorption isotherm can be expressed as an exponential equation (the Freundlich equation) in which two important constants are related to temperature and coal pore distribution [72].
| Name of the model | Mathematical expressions of the model | |
|---|---|---|
| CBM adsorption | The Langmuir equation [69] | x = abp/1 + bp |
| The B.E.T. equation [38] | V = (VmpC/(ps − p)[1 − (p/ps) + C(p/ps)]) × 100% | |
| The adsorption potential theory and model [71] | Va = f(ε) = f(RTlnps(Ps/p)) | |
| The Dubinin-Astakhov (D-A) equation [72] | w = w0exp[−(A/E)n] | |
| A = RTln(Ps/P) | ||
| The Dubinin-Radushkevich (D-R) equation [73] | LogW = logW0 − b(ε/β)2 | |
| The Gibbs adsorption formula [76] | A(∂π/∂p)r = n(RT/p) | |
| The Freundlich equation [72] | w = fp1/b | |
| CBM desorption | The Barrer desorption model [27] |
|
| The Winter and Janas desorption model [67] | Qt = (V1/1 − Kt)t1−k | |
| The Airey desorption model [79] |
|
|
Of all these commonly used gas adsorption models, the Langmuir equation is the most widely used and its parameters have clear physical meanings. However, there could also be some problems when the Langmuir equation is applied in coals, particularly since it is not suitable for fitting the isothermal adsorption experimental data of water-bearing coal under high pressure conditions [77]. Clarkson and Bustin [75, 78] have used four different adsorption models to describe the CH4 adsorption process of coal and found that the accuracy order of simulation models is as follows: D − A equation > D − R equation > B.E.T.equation > Langmuir equation. For the characterization of gas desorption behavior, Barrer’s model suggested that the cumulative gas desorption amount is proportional to the square root of time under a constant pressure system [27]. In addition, Winter and Janas’s model proposed that the gas desorption speed with time can be expressed by a power function [67], whereas Airey’s model established an empirical formula of gas desorption based on Darcy’s law [79].
3.3. Fluid Transport Process and Modelling
3.3.1. CBM Diffusion Behaviors and Models
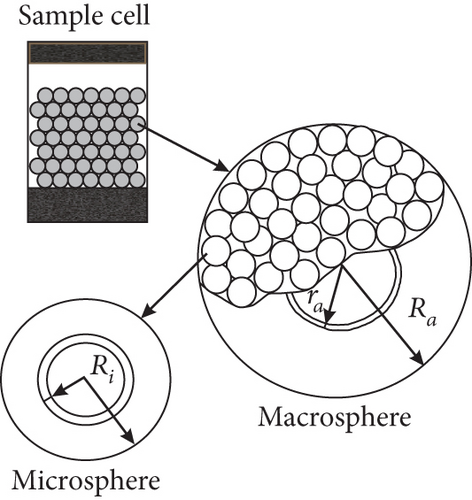
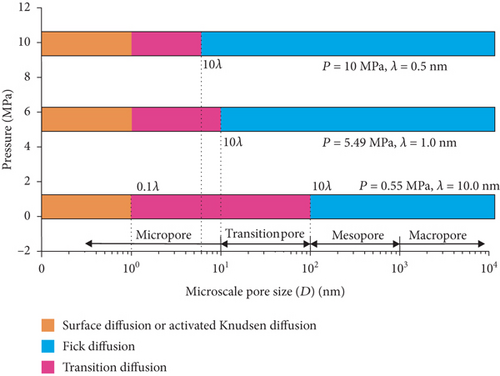
During the process of drainage and depressurization in CBM reservoirs, the adsorbed CBM is initially desorbed from the pore surface in the coal matrix, and then it diffuses into the fracture network caused by the concentration difference [80]. Generally, there are three modes of gas diffusion in coal: the Fick diffusion, the Knudsen diffusion, and the transitional diffusion (Figure 11). Moreover, gas transport in pores is also controlled by the surface diffusion or the configurational diffusion [81]. The specific mode of gas diffusion in CBM reservoirs can be determined by the Knudsen number (Kn = λ/d), which represents the ratio of the gas molecular mean free path length (λ) to the pore diameter (d) of coal [35]. When Kn ≤ 0.1, the gas diffusion in coal pores still follows Fick’s law (the Fick diffusion) because the pore diameter is much larger than the mean free path of the gas molecule and a collision mainly occurs between free gas molecules; meanwhile, the collision between gas molecules and the capillary wall is relatively small (Figure 11(a)). When Kn ≥ 10, the gas diffusion no longer follows Fick’s law and tends to the Knudsen diffusion because the mean free path length of the gas molecule is larger than the pore diameter and the collision between gas molecules and the capillary wall primarily happens in coal pores (Figure 11(b)). Moreover, when 0.1 ≤ Kn ≤ 10, the gas diffusion in coal pores is a transitional diffusion between the Fick diffusion and the Knudsen diffusion as a result of the pore diameter being close to the mean free path of gas molecules (Figure 11(c)). During this diffusion process, both the collision between free gas molecules and the collision between gas molecules and the capillary wall are equally important. Therefore, CBM diffusion characteristics are mainly governed by the pore structure and the heterogeneity of its coals [80, 82].

At present, there are several models to describe the gas diffusion process in coals, as shown in Table 3. Based on Fick’s second law for spherically symmetric flow, the unipore model is established by assuming that the gas concentration on the pore surface of coal matrix is constant [78, 83]. It simplifies the pore structure of coal into a homogenous structure and supposes that the diffusion coefficient is independent of gas concentration. However, due to the strong heterogeneity of the pore structure in the coal matrix, the unipore model has been proven to have certain limitations in some dull coals or low–medium-rank coals [82]. Consequently, Ruckenstein et al. [84] and Clarkson and Bustin [78] proposed a bidisperse model to describe the gas diffusion behavior of CBM reservoirs developed with a bimodal pore structure, and they divided the gas diffusion process into a fast macropore diffusion stage and an extremely slow micropore diffusion stage (Figure 12). Based on experimental analysis and mathematical derivation, Pan et al. [85] proposed an overall diffusion formula to calculate the proportions of the macropore diffusion stage and the micropore diffusion stage in bituminous coals. Moreover, a new multiporous diffusion model was established by Li et al. [86], which provides better fitting results than the bidisperse model for low-rank coals, especially for the initial diffusion stage. However, due to the limitation of interpreting the interactions of multicomponent gas molecules, the above formulas derived from Fick’s second law cannot well describe the multicomponent gas diffusion behaviors in coals [87, 88]. In comparison, the Maxwell-Stefan diffusion theory is superior in characterizing the diffusion process of mixed gaseous molecules in coals [89].
3.3.2. CBM Seepage Process and Models
Taking the aspects of coal matrix shrinkage effect, gas slippage effect, and effective stress into consideration, different permeability models have been established to predict the permeability of CBM reservoirs (Table 4) [91]. Through analyzing the permeability variation and gas flow mechanisms of coals by these models, the CBM seepage process in coals can be characterized by the following aspects: (1) CBM seepage in underground coal is generally under the control of high reservoir pressure, and both the CBM compressibility and coal matrix compressibility should not be neglected [57, 92]; (2) due to the complex shape and distribution of pore-fractures in coals, the impacts of capillary force and intermolecular force should also be considered to analyze the permeability [40, 93]; (3) the CBM seepage process occurs synchronously with the desorption and diffusion in coals, and CBM desorption may cause the spontaneous adjustment of coal (coal matrix shrinkage), which further results in the opening of the original fractures and the increase of permeability [57, 94, 95].
| The author of the model | Mathematical expressions of the model |
|---|---|
| Gray (1987) [139] |
|
| Seidle et al. (1992) [140] | k/k0 = exp[−3Cf(σ − σ0)] |
| Seidle et al. (1992) [140] | Δk(slippage effect) = k − k0 = k0(1 + (bMe/Pm)) − k0 = k0(bMe/Pm) |
| Seidle and Huitt (1995) [25] | ϕ = ϕ0 + ϕ0(1 + (2/ϕ0))ε1[Bp0/1 + Bp0 − Bp/1 + Bp] |
| Harpalani and Chen (1995) [141] |
|
| Levine (1996) [94] |
|
| Palmer and Mansoori (1998) [22] | ϕ/ϕ0 = 1 + (Cm/ϕ0)(p − p0) + (ε1/ϕ0)(K/M − 1)(p/ps + p − p0/ps + p0) |
|
|
|
| Gilman and Beckie (2000) [142] | , |
|
|
|
| Shi and Durucan (2005) [35] | σ − σ0 = −(V/1 − V)(p − p0) + (E/3(1 − V))ε1(p/p + pε − p/p0 + pε) |
| Cui and Bustin (2005,2007) [124, 143] | σ − σ0 = −(2(1 − 2V)/3(1 − V))[(p − p0) + K(εs − εs0)] |
| Robertson and Christiansen (2006) [144] |
|
| Liu and Rutqvist (2010) [95] | Δσ = −(V/1 − V)ΔP + (E(Δεs − Δεf)/1 − V) |
|
|
|
| Moghaddam and Jamiolahmady (2016) [127] |
|
|
|
|
|
|
|
| Fan and Liu (2019) [93] | bm = −(12μvisL(t)Q(t)/WΔP) |
|
|
3.3.3. Two-Phase Flow Characteristics of CBM and Water
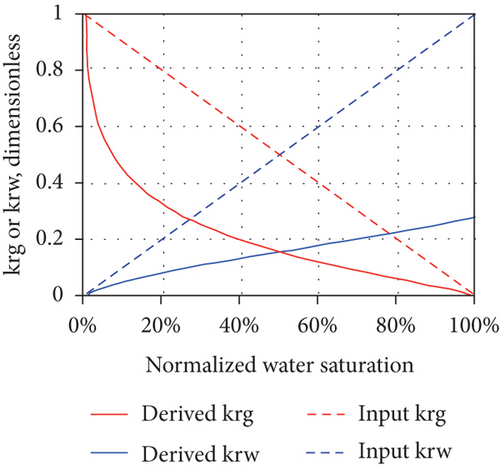
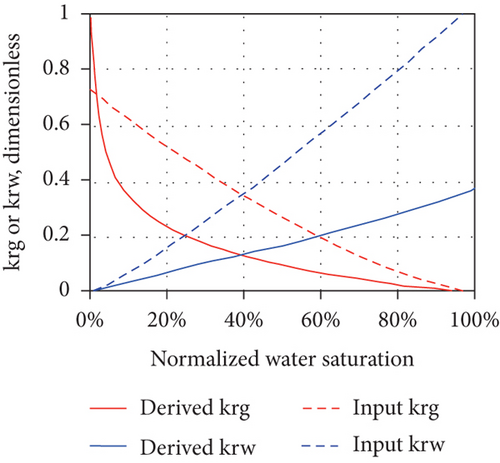
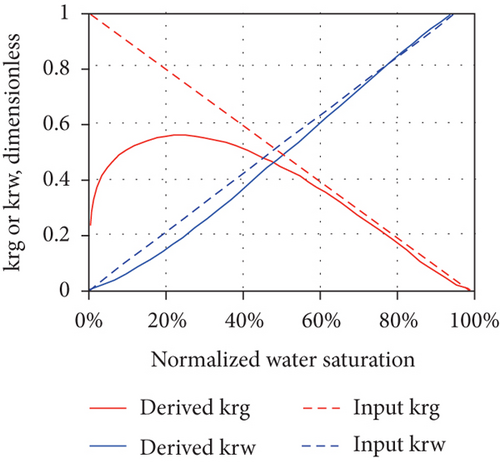
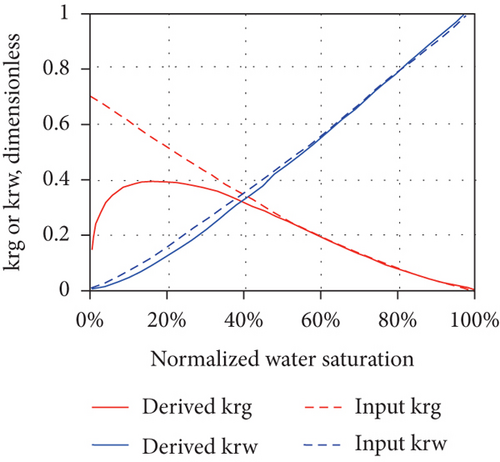
The production of CBM from a well usually goes through the following three stages after drainage and depressurization: (1) the unidirectional flow stage—wellbore pressure is greater than the critical desorption pressure and only water flows in a single phase; (2) the unsaturated flow stage—water flows with discontinuous CBM; and (3) the two-phase flow stage—CBM continuously flows with water [49]. In general, the multiphase flow occurs during both the primary and enhanced CBM recovery processes under reservoir conditions [96]. As water continues to be discharged, the reservoir pressure in the wellbore gradually decreases and CBM begins to desorb from coal when the flowing bottom pressure is less than the critical desorption pressure, resulting in the decreases of water-phase permeability and the increases of gas-phase permeability [88]. Thus, relative permeability is one of the most important parameters affecting the CBM production from reservoirs [97]. For porous media, the effective permeability of each flow phase is always less than the absolute permeability, and the sum of the effective permeabilities of all flow phases is also less than or equal to the absolute permeability [98]. Because the effective permeability of each flow phase varies with the saturation, the relative permeability curve can be used to determine the effective permeability of each flow phase for all possible saturation conditions in the reservoir. However, the shape of the relative permeability curve can be affected by the dynamic changes and operating characteristics of CBM reservoirs, which indicates that a series of factors, including nonstatic absolute permeability and porosity during depletion, multilayer effects, and gravity segregation and transient flow, can control the curve shape [98]. Figure 13 shows the changes of the absolute permeability of coal (mainly an exponentially increasing or exponentially decreasing trend), which can also cause a dramatic change in the concavity of the gas and water relative permeability curves (highly nonlinear concave up in Figures 13(a) and 13(b) or highly nonlinear concave down in Figures 13(c) and 13(d)). This means that the changes of absolute permeability and transient flow have a significant impact on the derived relative permeability curves, and meanwhile, the set of derived relative permeability curves are not universal.
4. Factors Influencing the Fluid Performance in CBM Reservoir
4.1. Influencing Factors of CBM Adsorption/Desorption Behavior
The influencing factors of CBM adsorption/desorption behavior can be divided into two categories: internal factors (such as coal metamorphism, petrographic constituents, macroscopic types, and pore structure of coals) [99] and external factors (such as pressure, temperature, gas type, moisture content, and geophysical and electromagnetic fields) [26, 28].
4.1.1. Coal Type
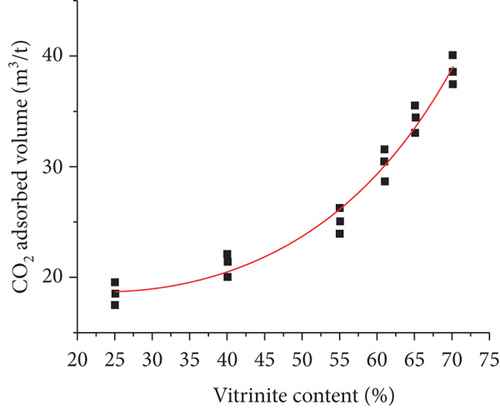
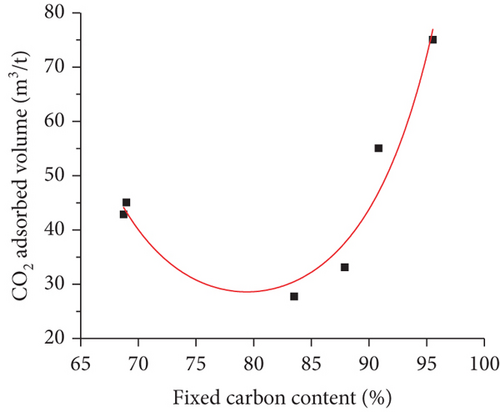
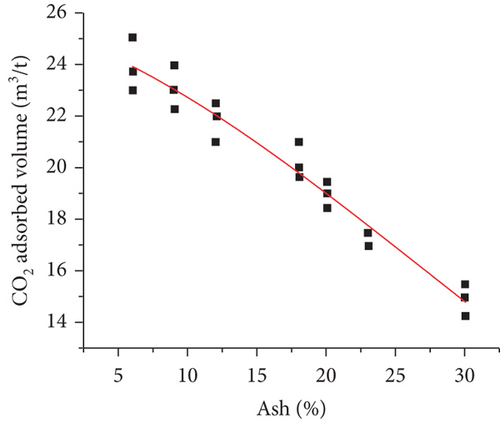
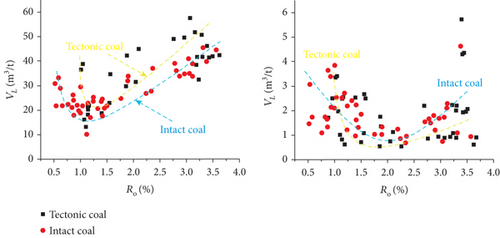
Coal type mainly refers to the physical properties, such as coal rank, maceral composition, minerals, fixed carbon, ash, and volatile matter [100]. It been confirmed that the degree of coal metamorphism is the main controlling factor that controls the gas adsorption/desorption capacity of coals [71]. Bustin and Clarkson [17] proposed that coal rank generally has no universal effect on the gas adsorption of coals, whereas the gas adsorption capacity may be significantly enhanced as the coal rank increases from medium to high volatile bituminous coal (Figure 14(a)) [101]. Some researchers have found that the methane adsorption capacity of coals presents a “U-shaped” correlation with the increase of the fixed carbon content in which the minimum value appears in the stage of high volatile bituminous coal (Figure 14(b)) [102]. Moreover, the gas adsorption capacity of coals is positively correlated with pore surface area, but negatively correlated with ash and mineral content (Figures 14(c) and 14(d)) [103]. For maceral composition, vitrinite has the strongest adsorption capacity, followed by inertinite and exinite [99, 104]. Therefore, there is no simple functional relationship between coal type and gas adsorption capacity because of the complex components of coal and their different effects on gas adsorption.

4.1.2. Coal Deformation and Pore Structure
According to whether it has experienced the force of tectonic stresses, coal reservoirs can be divided into primary coals and tectonically deformed coals (TDCs) [37]. For TDCs, the primary structure is destroyed, and the pore structure is changed as well. The porosity and specific surface area obviously increase with the increase in the degree of coal deformation, which results in the larger Langmuir volume and lower Langmuir pressure of TDCs (Figures 15(a) and 15(b)) [105, 106]. Meanwhile, the deformation also changes the intramolecular and macromolecular structure of the coal matrix, which further causes the stronger affinity between the coal surface and molecular CH4 [26]. The variation of gas adsorption capacity is mainly related to the pore structure (especially micropores) of coals, whereas the initial fast desorption process is strongly influenced by the mesopores and macropores, and the slow desorption process is dominated by the micropores [99].
4.1.3. Temperature and Pressure
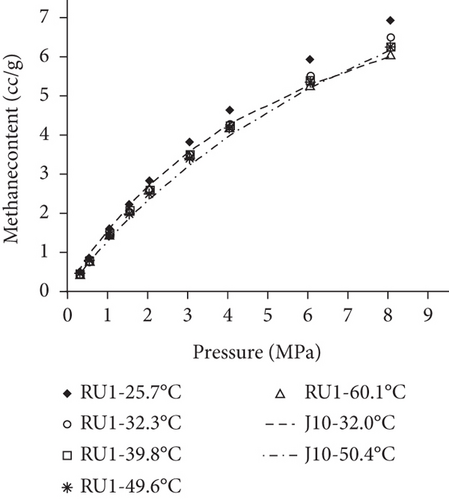
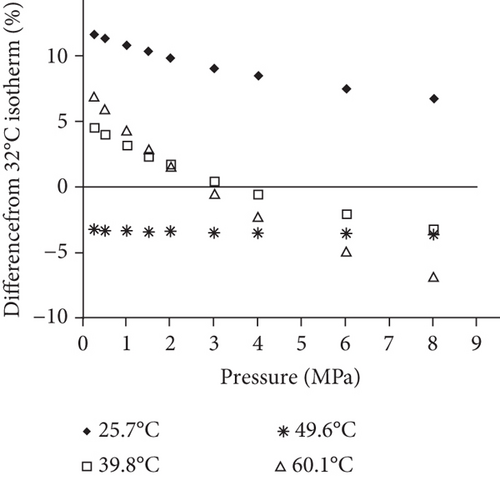
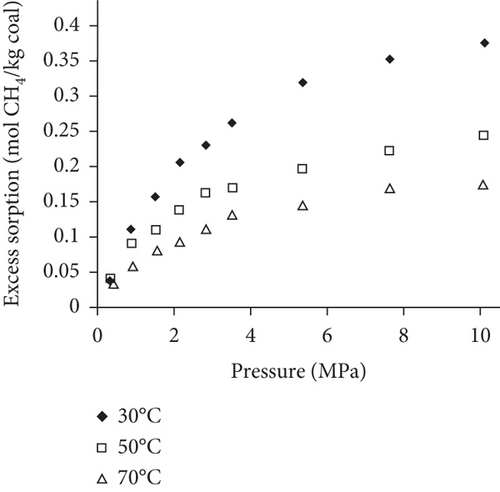
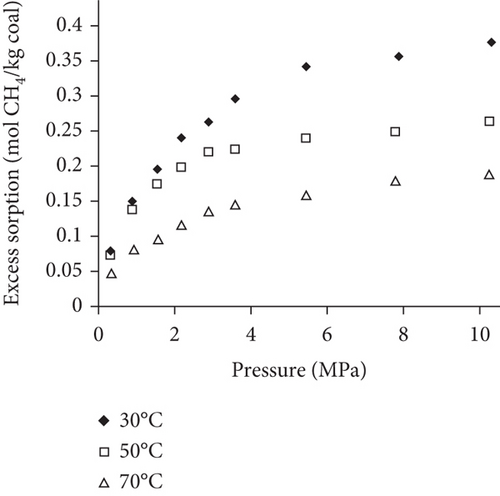
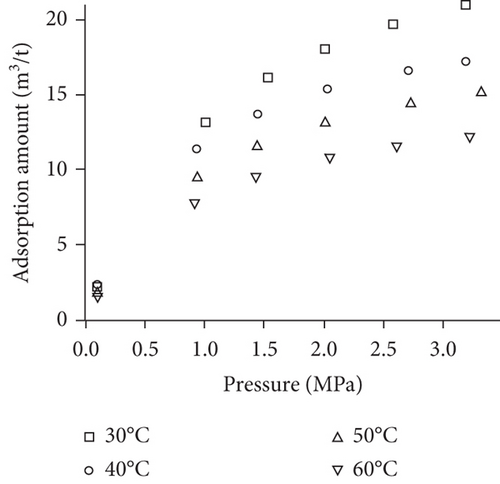
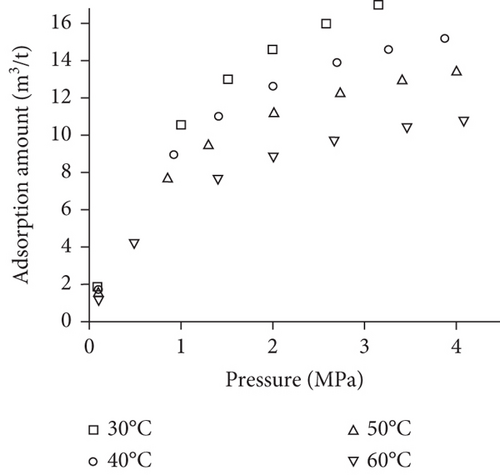
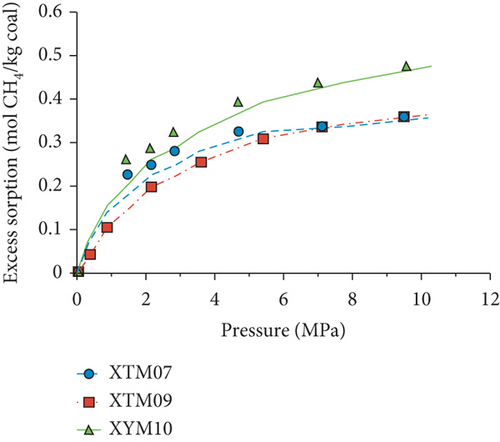
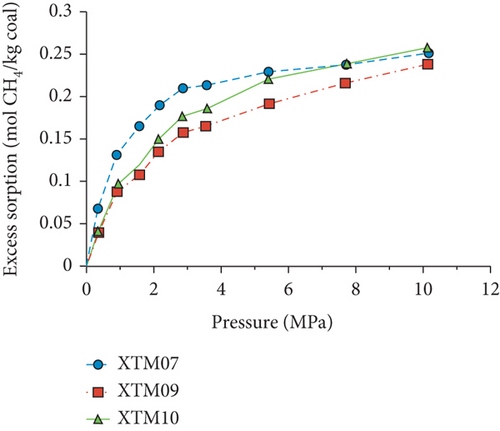
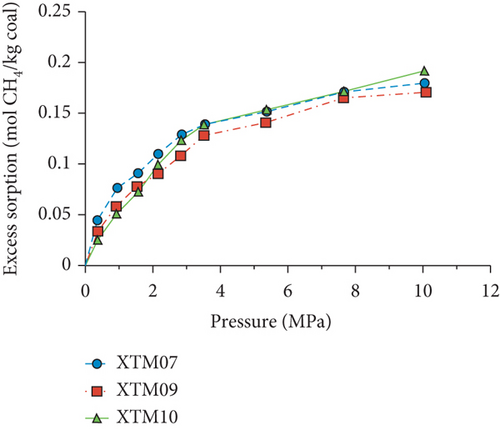
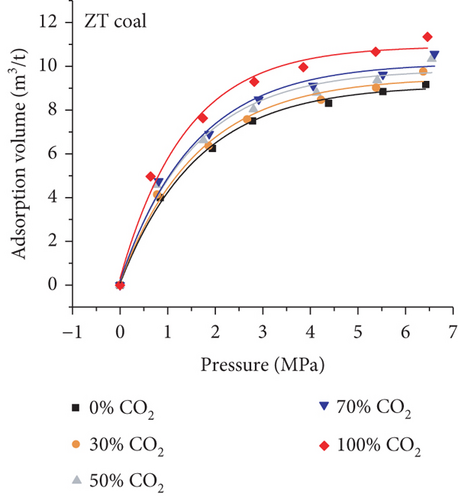
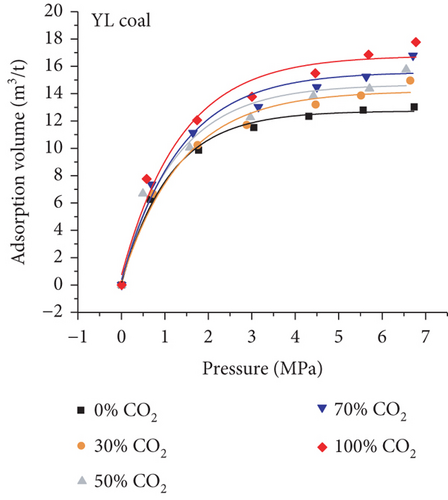
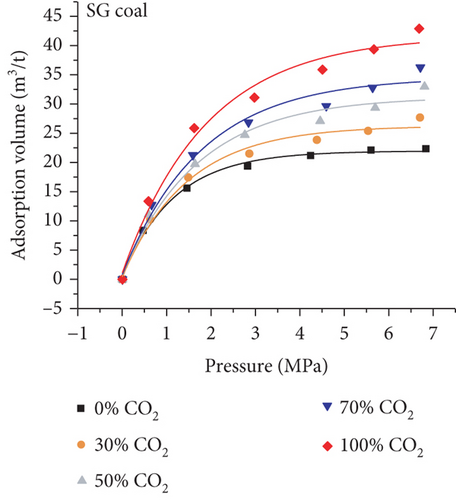
Because the heterogeneity of coal reservoirs is very strong, the variation of gas adsorption/desorption behavior with temperature is relatively complex in different coals. Crosdale et al. [107] found that the absolute difference between all isotherms of subbituminous coals is small when the temperature ranges from 26°C to 32°C (Figures 16(a) and 16(b)). However, many studies have demonstrated that the gas adsorption capacity generally decreases with the increase of temperature (Figures 16(c)–16(f)) [108, 109]. It has been noted that the gas adsorption rate is positively correlated with the temperature [110]. For a single-component gas, the adsorption capacity always increases with the increase of gas pressure (Figures 17(a)–17(c)). For a multicomponent gas, the total amount of adsorbed gas in the gaseous mixture at a fixed pressure also gradually increases as the proportion of readily adsorbable gas in the gaseous mixture increases, whereas it increases in varying degrees because SG anthracitic coal has a more absorbing substrate than the other two coals (Figures 17(d)–17(f)) [111].
4.1.4. Moisture Content
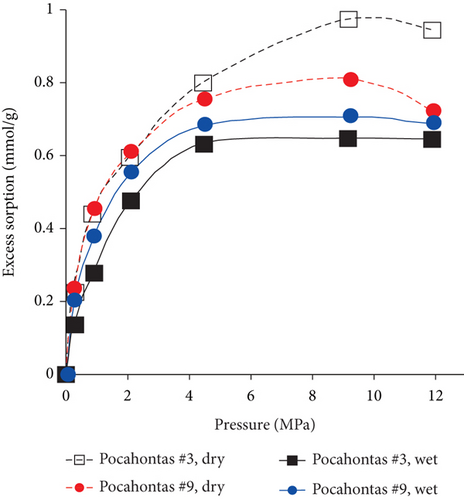
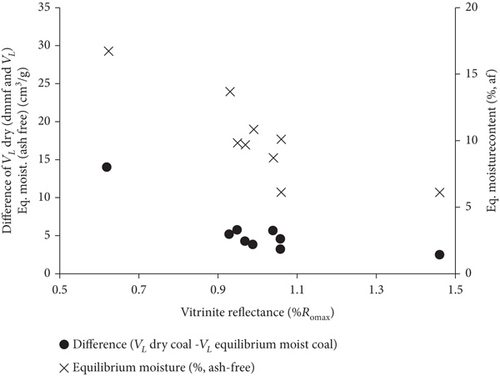
The effect of moisture content on gas adsorption capacity is clearly observed in Figure 18(a), indicating that the amount of adsorbed carbon dioxide of dry coals is significantly higher than that of wet coals. The reason for this phenomenon is that the surface of the coal matrix can firstly adsorb H2O molecules with a strong polarity, which results in the reduction of the adsorption space of adsorbed gas in the coal matrix. Moreover, moisture can cause the secondary hydrocarbon blockage of micropores [112]. Because the low-rank coals have a stronger affinity to moisture, their maximum amount of adsorbed gas is significantly reduced (Figure 18(b)). As coal rank increases, the equilibrium moisture content of coals significantly decreases, resulting in the increase of gas adsorption capacity and the smaller difference of gas adsorption capacity between dry and wet coals [112]. Moreover, the sorption capacity and stability of CO2 show a decreased trend with the structural change of wet coal under high gas pressure [113].
4.2. Influencing Factors of CBM Diffusion
4.2.1. Pore Structure
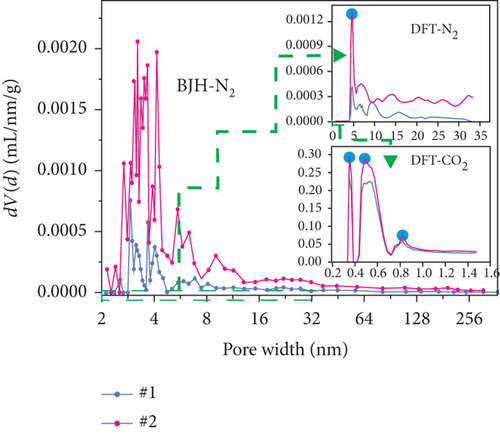
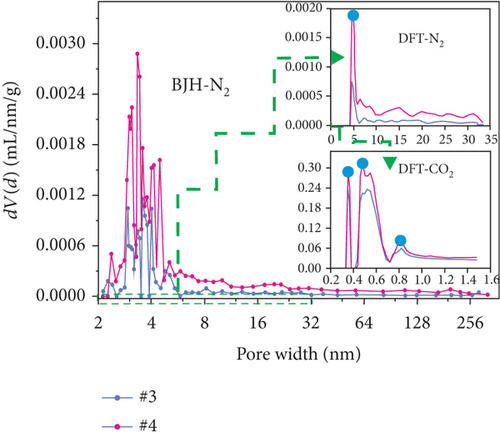
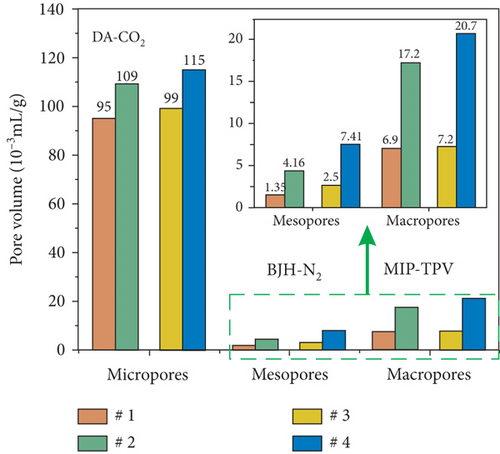
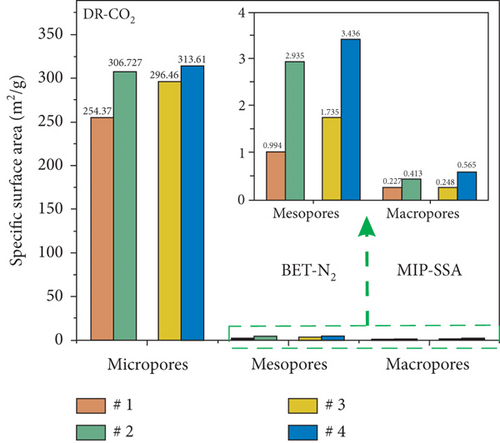
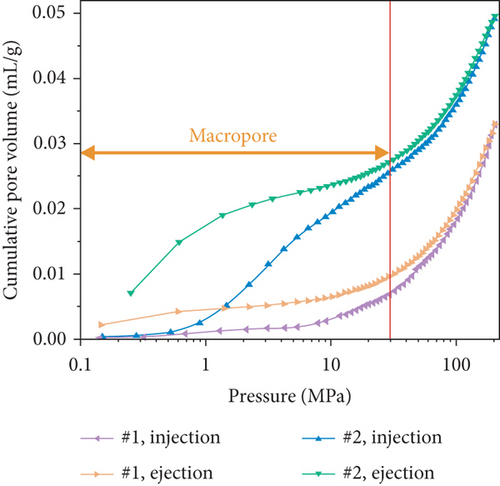
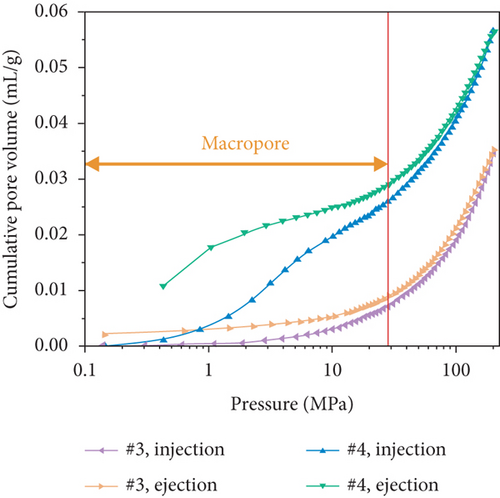
The pore structure is closely related to the coal rank and tectonic movement, where mesopore and macropore volumes and the specific surface areas (SSA) and porosity of coal reservoirs increase after having experienced tectonic damage [114, 115]. Based on N2/CO2 adsorption and MIP measurements, Wang et al. [115] found that the pore structure of tectonic coal is more developed than that of intact coal (Figures 19(a) and 19(b)), and meanwhile, it shows higher values of pore volume and SSA (Figures 19(c) and 19(d)) and better connectivity (Figures 19(e) and 19(f)). There are different gas diffusion patterns in coals developed with different PSDs in which more micropores can cause a high proportion of transitional diffusion, whereas more mesopores (100-1000 nm) and macropores (1000-10,000 nm) can result in a high proportion of Fick’s diffusion in coals [78, 81]. Moreover, the mean free path of molecular gas generally increases with the decrease of gas pressure, which leads to the decrease of the proportion of the Fick diffusion in multiscale pores of coals (Figure 19(g)).
4.2.2. Gas Components and Moisture Content
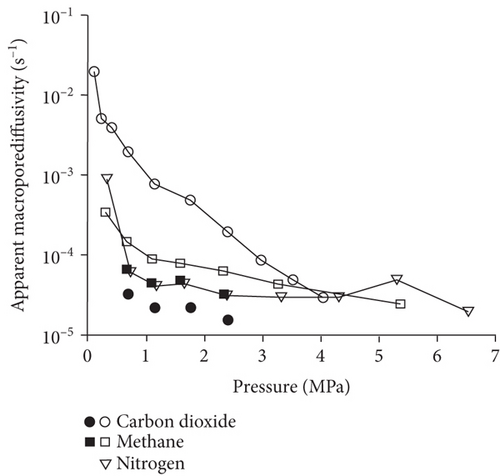
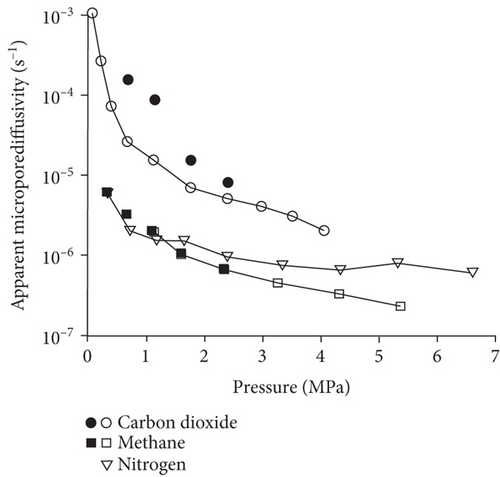
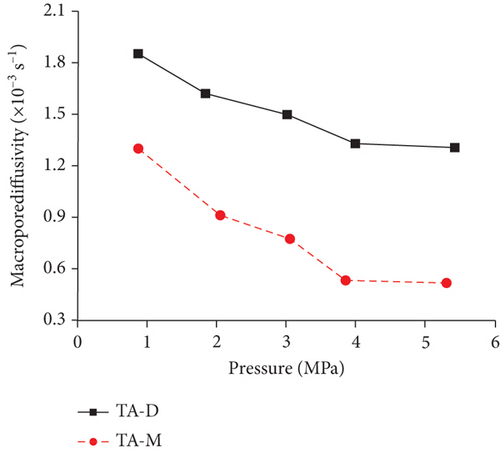
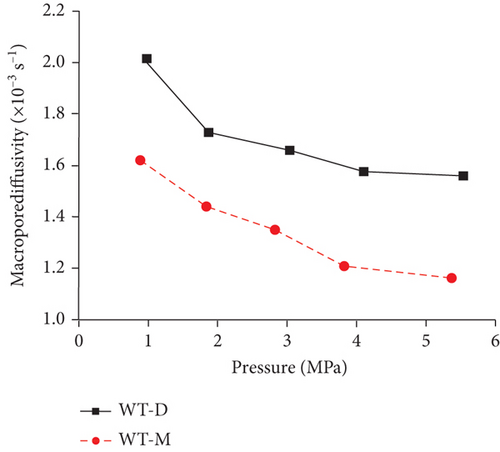
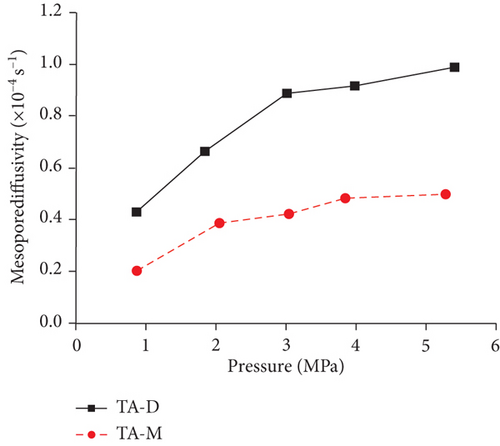
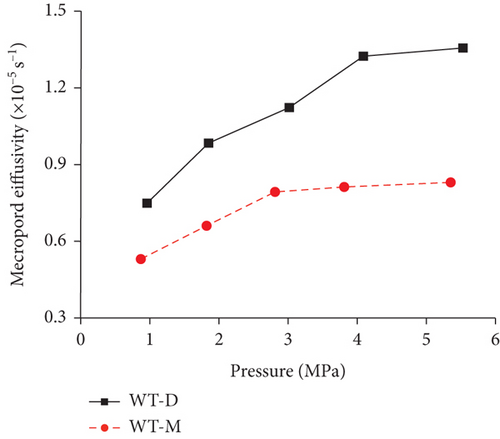
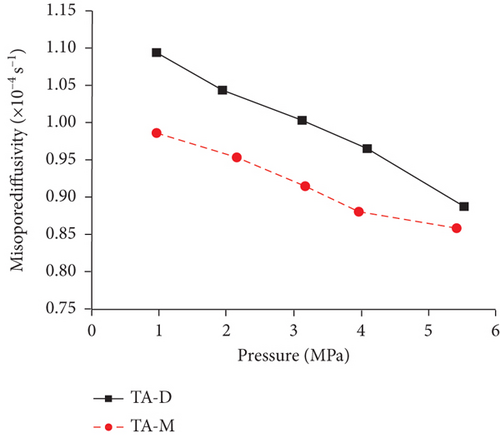
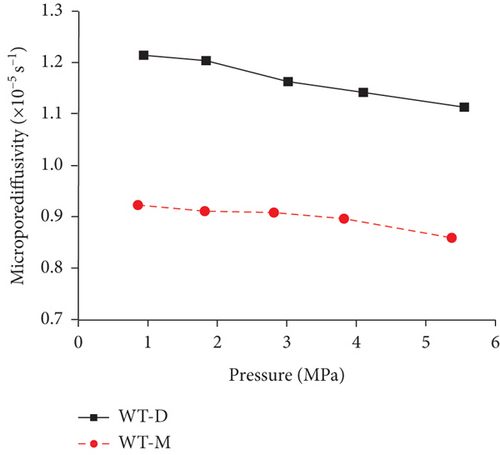
Knowledge of CBM belongs to the multicomponent mixed gas, which mainly consists of CH4, C2+, CO2, N2, and partially inert gases. Firstly, the concentration differences of different gas components can inevitably lead to different diffusion rates of CBM in coals [85]. Moreover, the adsorption kinetics of different gas molecules on the pore surface are different in coals, which may also cause different diffusion behaviors [116]. Clarkson and Bustin [78] found that CO2 diffusivity is generally higher than that of CH4 and N2. Based on the smallest relative molecular size and kinetic diameter, the diffusion coefficients of three gases in coals decrease with the order of CO2 > N2 > CH4 (Figures 19(a) and 19(b)) [116]. Li et al. [86] found that the gas diffusion rate of wet coal is slower than that of dry coal, and this is because the moisture adsorbs to the pore surface and further occupies the pore space. Moreover, partial minerals in coal can swell through adsorbing moisture, which may block the path of pores and result in the decrease of the gas diffusion rate [117]. As shown in Figures 20(c)–20(h), the CH4 macropore and micropore diffusivities decrease with the increase of pressure, whereas the mesopore diffusivities increase with the increase of pressure, which may result from the different performance of gas diffusion in different pore structures [86]. Moreover, the CH4 diffusion coefficient is more easily affected by moisture than that of CO2 [85]. It has been noted that gas diffusion generally occurs in both the gas phase and liquid phase in water-saturated coals, indicating that the effective diffusion rate mainly depends on the saturation and distribution of water in the coal matrix [118].
4.2.3. Temperature and Pressure
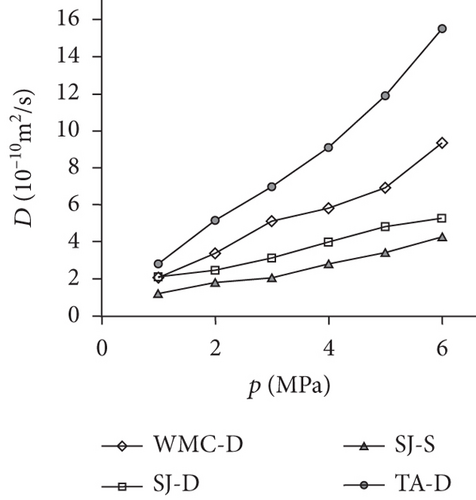
Previous research [61, 78, 110, 119] has shown that the diffusivity of CO2 in coal is greater than that of CH4 and N2 because of their different kinetic diameters, and gas diffusivities generally increase with the increase of pressure and temperature (Table 5). On one hand, the molecular gas becomes more active and diffuses more easily with the increase of temperature. On the other hand, the molecular gas desorbs more easily from the pore surface and then accumulates in the coal matrix with the increase of temperature, resulting in the increase of the gas diffusion rate [85]. As shown in Figure 21(a), a strong positive correlation exists between the gas pressure and the diffusion coefficients of differently ranked coals with the increase of gas pressure, which is influenced by different diffusion mechanisms under different pressures [120, 121]. However, Clarkson and Bustin [78] found that gas diffusivities calculated from their numerical model decrease as gas pressure increases, whereas gas diffusivities calculated from the unipore model also increase as the gas pressure increases (Figure 21(b)). The negative trend between gas diffusivities and pressure may be dominated by different mechanisms of gas diffusion in coals, whereas the positive trend between gas diffusivities and pressure may be due to the nonlinearity of gas isotherms.
| Gas species | Temperature | Pressure (MPa) | β | |||
|---|---|---|---|---|---|---|
| From | To | |||||
| CH4 | 20 | 0.00 | 1.03 | 0.70 | 9.26 × 10⁻⁷ | 9.16 × 10⁻⁶ |
| 1.03 | 2.75 | 0.70 | 9.88 × 10⁻⁷ | 1.00 × 10⁻⁶ | ||
| 2.75 | 3.80 | 0.70 | 1.68 × 10⁻⁶ | 7.35 × 10⁻⁵ | ||
| 50 | 0.00 | 1.60 | 0.56 | 6.83 × 10⁻⁶ | 1.94 × 10⁻³ | |
| 1.60 | 2.95 | 0.56 | 8.98 × 10⁻⁶ | 2.54 × 10⁻³ | ||
| 2.95 | 3.95 | 0.56 | 1.50 × 10⁻⁵ | 2.10 × 10⁻³ | ||

4.3. Influencing Factors of the CBM Seepage Process
The CBM seepage process is mainly dominated by the physical properties of coals, fracture development, in situ stress/effective stress, matrix shrinkage effect, and gas slippage effect [91, 122]. Generally, the extensive development of fractures is beneficial to the permeability of coal [90]. As the in situ stress increases, the permeability of coal shows a decreased tendency (a power exponential relationship with the in situ minimum principal stress) because natural fractures/cracks may be compressed or even closed [91, 123]. However, the dynamic change of coal permeability mainly depends on the effective stress, gas slippage effect, and coal matrix shrinkage effect during the drainage and depressurization process.
4.3.1. Effective Stress Effect
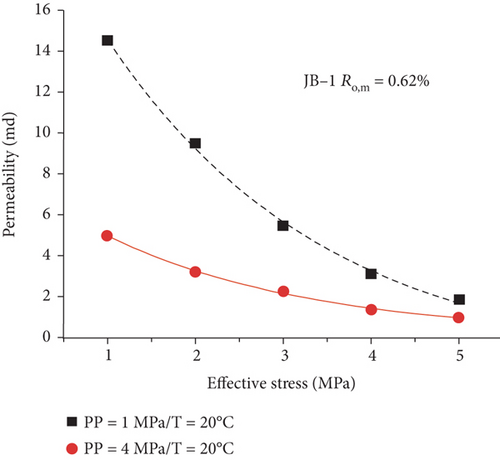
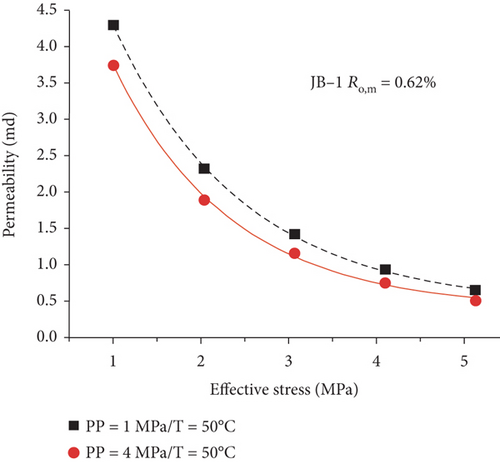
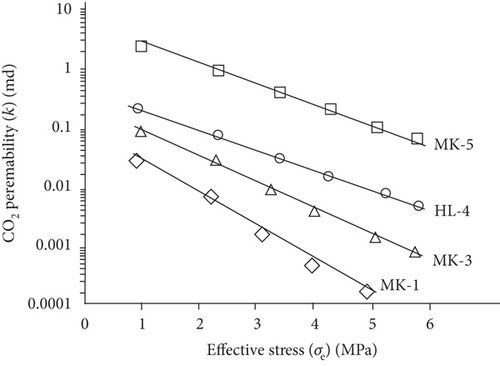
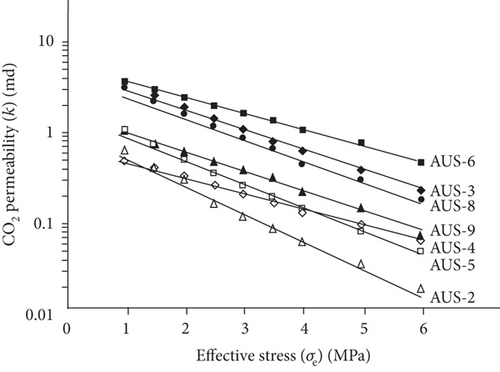
Compared with the conventional oil/gas reservoirs, coal reservoirs have obvious elastoplastic deformation characteristics and stress sensitivity in which the increase of effective stress can compress or close the fractures/cracks and further decrease the absolute permeability of coal. During the CBM production process, the pore pressure decreases and the effective stress increases with the continuous extraction of underground fluids, which causes the compression deformation of the coal matrix and the continuous reduction of pore-fracture space and permeability [124]. As shown in Figure 22, there is an exponential or linear decreasing relationship between permeability and the effective stress [120, 125]. This trend may be contributed to the compression of pore-fracture space with the increase of effective stress during fluid migration in coals.
4.3.2. Gas Slippage Effect
Under the conditions of low gas pressure and gas density, the gas slippage effect becomes more obvious in the smaller path. As fluids are extracted from the coal reservoir, the gas slippage effect generally causes an increase in the apparent permeability and presents a positive effect on the CBM seepage in coals [127]. Moreover, the characteristics of the gas-water two-phase flow can be accurately predicted by considering the dynamic gas slippage factor.
4.3.3. Coal Matrix Shrinkage Effect
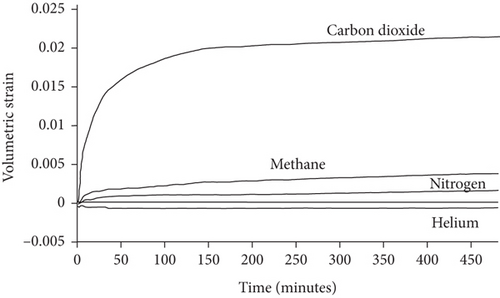
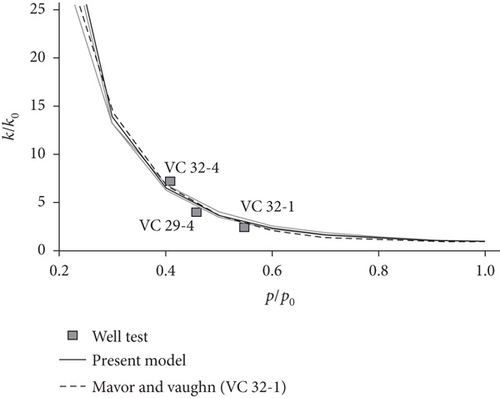
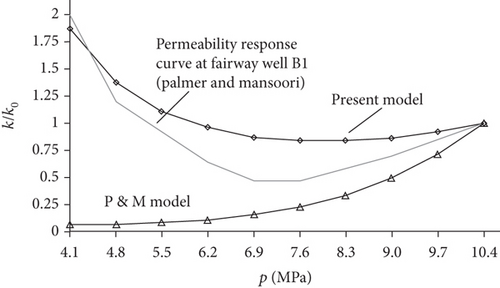
Taking the effects of coal matrix shrinkage and different elastic properties into consideration, Shi and Durucan [128] proposed a model to simulate coal permeability (solid thin lines, Figure 23(b)), which is in accordance with the history-matched permeability response curve (thick broken line, Figure 23(b)) and shows better application than the previous model (Figure 23(c)). When the shrinkage degree of the coal matrix is less than the compaction degree by in situ stress, the porosity and permeability of coals may gradually decrease with the continuous production of CBM. Conversely, the porosity and permeability of coals show an increasing trend.
5. Implication of Fluid Performance for CBM Production
5.1. Competitive Adsorption of Different Gas Components
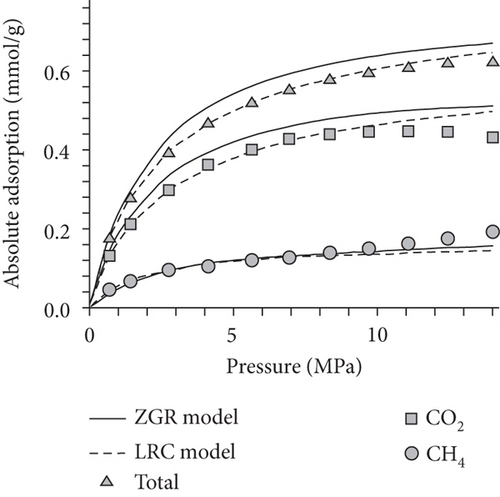
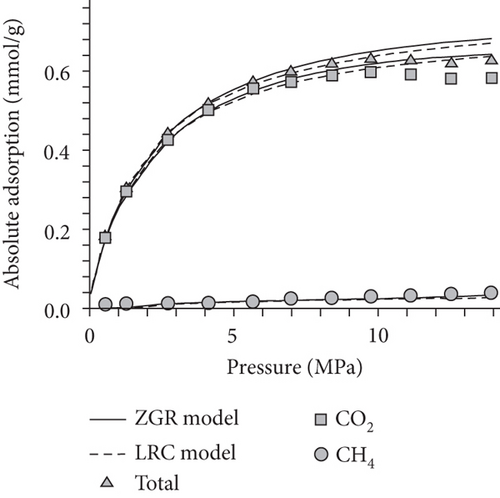
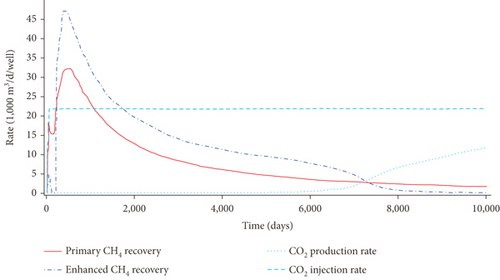
As shown in Figure 24(a) and Figure 24(b), the absorption capacity of CO2 is almost three times that of CH4 and 20 times that of N2 in coals under a certain pressure [62]. This phenomenon can be attributed to the following three aspects: (1) the adsorbents with higher atmospheric boiling points are preferentially adsorbed [129]; (2) the diameter of molecular CO2 is smaller than that of molecular CH4 and N2, which can go through the smaller micropores or throat; and (3) the critical temperature of CO2 (31.3°C) is closer to the reservoir temperature compared to that of CH4 (-81.9°C) [130]. Based on this property, the process of CO2 injection into coal reservoirs to replace or displace CH4 can improve CBM recovery [131–133]. As CO2 is injected into the coal seam, pores with different scales have different effects on different gas molecules in which the macropores provide a channel for molecular CH4 migration and the micropores can capture molecular CO2 by providing adsorption sites [134]. Sander et al. [135] found that the CBM production peak value of the primary recovery is increased by 46% with CO2 injection, and the total CBM production has also been improved during the long-term production process (Figure 24(c)). However, it is worth noting that CO2 is beginning to appear in production wells after 6000 days, which means CO2 may be extracted to the surface again with the decline of CO2 storage capacity in the coal seam.
5.2. Fluid Transport Process in CBM Reservoir
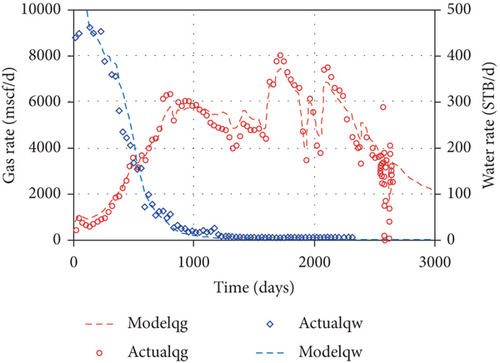
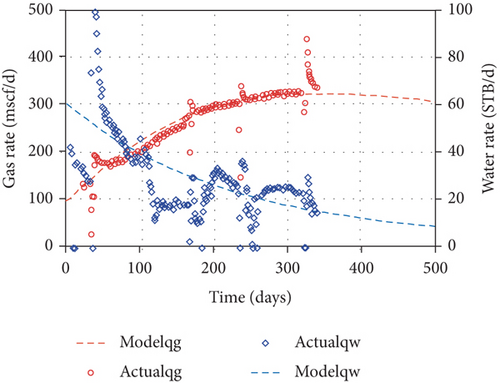
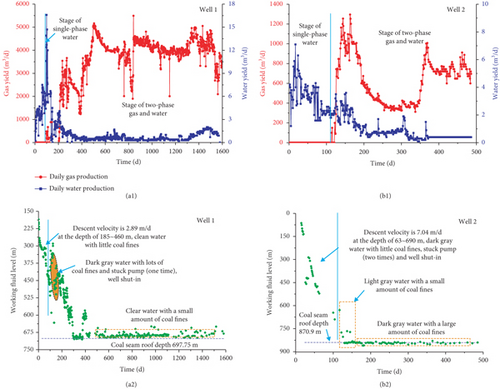
As the coalbed water is pumped out from a CBM well, the original pressure balance of a coal reservoir is broken, and the CBM flow velocity and pressure at any point in the flow field constantly changes with time. The CBM production process generally undergoes three seepage stages: (1) the single-phase water flow stage, (2) the gas-water two-phase flow stage, (3) the single-phase gas flow stage [136, 137]. By comparing the simulation results of different permeability models and the gas and water production data, Clarkson et al. [98] found that the water relative permeability decreases and the gas relative permeability increases during the CBM production process, and large increases in gas rate after 1500 days are related to the decrease of backpressure (wellhead compression and line pressure decreases) (Figure 25). Two CBM production wells in the Zhengzhuang area of southern Qinshui Basin are compared. The drainage rate of Well 1 is relatively slow (2.89 m/d) in the single-phase water stage, and the CBM production quickly increases to its peak with a higher value (~4000 m3/d) and shows a long stable production period of ~1200 days (Figures 26(a1) and 26(a2)). In comparison, the drainage rate of Well 2 is fast (7.04 m/d) in the single-phase water stage, and the CBM production decreases rapidly after reaching the peak value (~1200 m3/d) and has a short stable production period (~100 days) (Figures 26(b1) and 26(b2)). This indicates that the relative low drainage rate can flush coal fines so that it cannot block pore-fractures; thus, it improves CBM production. In comparison, the fast drainage rate can create new coal fines that may block the effective seepage paths and the wellbore area, which is not conducive to CBM production [49]. Therefore, the flow velocity of gas and water in coal reservoirs has a significant influence on the production characteristics of a CBM well [138].
6. Summary and Conclusions
The occurrence and transport characteristics of fluids (CBM and water) in a pore-fracture system of coal reservoirs have great significance for understanding the CBM production patterns and enhancing CBM recovery. This paper has reviewed and summarized several important aspects related to the fluid performance in coal reservoirs: (1) the component characteristics of CBM and the physical properties of fluids in coal reservoirs; (2) different characterization methods of the pore-fracture structure and the characteristics and modelling of fluid occurrence and transport in coal reservoirs; (3) the influencing factors of CBM adsorption/desorption and diffusion behaviors and the fluid seepage process; and (4) the implications of fluid occurrence and transport in coal reservoirs for CBM production. Moreover, although different methods have been constructed and used to characterize the fluid performance in coal reservoirs, there are still some key scientific problems to be investigated in future studies: (1) the control mechanism of the microscopic dynamics of fluids on CBM enrichment and storage under complex geological conditions; (2) the need for increasing the CBM desorption/seepage rate in coal reservoirs and clarifying its coupling effect with the evolution of geological structure; and (3) the synergistic effect of multiple spaces (pore-fracture system), multilevel flow fields (diffusion field, seepage field, and laminar flow-turbulence field), and multiphase flow (multiphase gas, water, and coal fines) in coal reservoirs.
Nomenclature
-
- b:
-
- the “Klinkenberg coefficient”
-
- bHe:
-
- the Klinkenberg coefficient of helium
-
- bMe:
-
- the Klinkenberg coefficient of helium
-
- k0:
-
- the absolute permeability
-
- k (methane):
-
- the measured permeability using methane
-
- [K]:
-
- the permeability tensor
-
- M:
-
- the fluid molecular weight
-
- P:
-
- the free gas pressure in the actual state (MPa)
-
- P0:
-
- the free gas pressure in the standard state (MPa)
-
- Pm:
-
- the mean gas pressure
-
- R:
-
- the universal gas constant
-
- T:
-
- the free gas temperature in the actual state (K)
-
- T0:
-
- the free gas temperature in the standard state (K)
-
- V:
-
- the free gas volume in the actual state (m3)
-
- Vg:
-
- the free gas volume in the standard state (m3)
-
- :
-
- the CBM seepage velocity
-
- w:
-
- the flow path width
-
- Z:
-
- the gas compression factor
-
- ∇:
-
- the Hamiltonian
-
- μ:
-
- the fluid viscosity
-
- He:
-
- helium
-
- Me:
-
- methane
-
- g:
-
- the gas
-
- m:
-
- mean
-
- 0:
-
- Standard state.
Conflicts of Interest
The authors declare that they have no conflicts of interest.
Acknowledgments
This research was funded by the National Natural Science Foundation of China (grant nos. 41830427, 41922016, 41772160, and 41902165).


