PL Spectra and Hot Charge Carrier Phenomena in an Undoped GaAs/AlGaAs Tunnel-Coupled Quantum Well
Abstract
In this research, we experimentally investigated the photoluminescence (PL) spectra of an undoped GaAs/Al0.36Ga0.64As Tunnel-Coupled Quantum Well (TCQW) at 300 K and 77 K. At 300 K, PL spectra were broadened at various laser intensities due to the characteristic quantum-confinement electron levels in the active region of the TCQW during pumping excitation. At 77 K, at selected excitation intensities, the high-energy tails in the PL spectra of the studied structure corresponded with hot electron temperatures as functions of the energy of emitted photons. The average scattering energy rate of hot electrons in the system was also studied at a lattice temperature of 77 K. The average scattering energy rate of hot electrons obtained from this experimental study was in agreement with the calculated theoretical value.
1. Introduction
The lattice constants at the heterojunctions of GaAs/AlxGa1-xAs quantum wells are among the most closely matched of all heterostructures. The ease of fabrication of this heterostructure makes it a favored source of radiation for laser and optoelectronics devices emitting in the near-IR range. The IR wavelength region plays important roles in microscopic and macroscopic applications such as molecular spectroscopy combined with Raman spectroscopy [1] and techniques employed in pharmaceutical analysis [2]. However, improving the performance of QW near-IR and mid-IR laser sources is a constant challenge to researchers. The Quantum Cascade Laser (QCL) [3], which is based on intersubband charge-carrier transition, is a familiar source that operates in this spectrum region. However, because the design of QCL is complicated, researchers are always striving to develop simpler QW structures that optimize as much as possible the near-IR and mid-IR output. Among near-IR sources, one of the most applied designs is a Tunnel-Coupled Quantum Well (TCQW) laser of GaAs/AlxGa1-xAs based on the interband transition of carriers. TCQWs have special characteristics of carrier occupation in the active region that encourages population inversion, which is one of the most important features of laser creation.
One approach that has successfully improved the performance of near-IR QW laser sources is the study of hot charge carrier phenomena caused by external perturbation of the lattice. Several experimental and theoretical studies of hot charge carrier phenomena in TCQW structures have reported improved physical properties that enhanced performances. For instance, hot charge carrier phenomena were studied under high laser pumping intensity and electric field application to the lattice [4–9]. These reports of mid-IR and near-IR QW lasers used photoluminescence (PL) spectra to show that hot charge carrier phenomena can improve properties such as interband threshold energy. Moreover, the study of the energy loss rate during hot charge carrier relaxation was an important aspect of investigations into carrier scattering effects on physical properties of nanostructures during external perturbation [10, 11].
Thus motivated, we propose this experimental research into the PL spectra and hot charge carrier phenomena of an undoped TCQW of GaAs/AlxGa1-xAs. This research is aimed at providing useful information about the influence of external perturbation on the energy levels of carriers in the system, focusing on the scattering energy loss rate of carriers and hot electron temperatures. Therefore, this research can be considered an investigation of the initiation of physical properties of carriers to improve the performance of semiconductor heterostructure IR sources. In addition, research into hot carrier phenomena can introduce innovations which advance nanofabrication technology with the application of electric fields at the Schottky contact of QW structures [12].
2. Materials and Methods
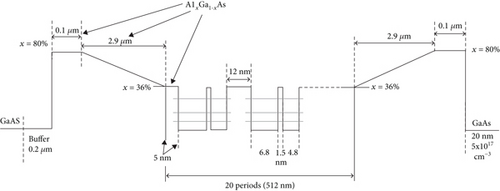
The studied structure was an undoped GaAs/Al0.36Ga0.64As TCQW grown by molecular beam epitaxy (MBE) on a semi-insulating GaAs substrate on a 0.2 μm thick GaAs buffer layer (see Figure 1). Its active region consisted of 20 periods of tunnel-coupled GaAs QWs with Al0.36Ga0.64As barriers. The periods comprised GaAs QWs arranged in pairs. One well of each pair was 6.8 nm wide, and the other was 4.8 nm wide. The Al0.36Ga0.64As layer separating the QWs of each pair was 1.5 nm wide, and each period was separated by an Al0.36Ga0.64As barrier 12 nm wide. The capping layer protecting the top Al0.36Ga0.64As layer from oxidation was 0.1 μm wide.
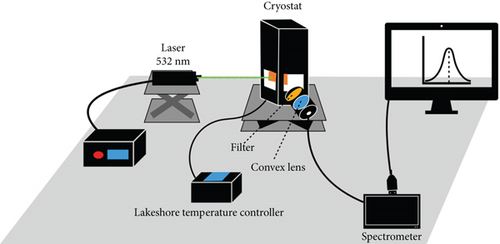
The fabricated heterostructure was mounted in a variable temperature cryostat (Cryo Industries Variable Temperature Dewar sn 5780), which could vary temperature from 77 K to 300 K. Two PL experiments were conducted in this research. In the first, PL spectra were produced that displayed PL intensity as a function of laser pumping energy at lattice temperatures of 77 K and 300 K. In the second experiment, PL was measured under a pumping intensity of 23.8 kW/m2 at various lattice temperatures from 77 K to 300 K. The studied structure was excited by a continuous-wave (CW) laser producing a wavelength of 532 nm. The temperature range was controlled between 77 K and 300 K by a Lakeshore Model 335 temperature controller. The near-IR interband PL signals were collected and focused into a spectrometer. The experimental setup is shown in Figure 2.
3. Results and Discussion
3.1. PL Spectrum Measurement at 300 K and 77 K with Varied Laser Pumping Intensities
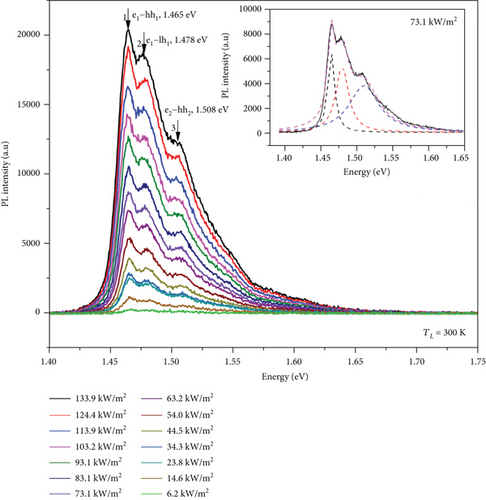
At 300 K, the PL spectrum of the studied structure presented three emission peaks (see Figure 3). The quantum-confinement energy levels were calculated based on the quantum well widths of the TCQW structure, which were 6.8 nm and 4.8 nm. A similar structure was described by Firsov et al. [6]. The peak at 1.465 eV conformed to the interband transition of electrons from electron subband level e1 to holes at heavy hole subband level hh1 of the TCQW region (e1-hh1). The peak at 1.508 eV corresponded to transition from the e2 level to the hh2 level (e2-hh2). The remaining peak at 1.478 eV (peak number 2) was attributed to the transition of carriers from electron subband level e1 to holes at light hole subband level lh1 (e1-lh1). Our assumption was that broadening of the spectrum took place in the high-energy regions of emission because of the increased electron concentrations at level e2. Therefore, the PL spectrum at 300 K presented three transitions in superposition. To confirm this assumption, the Lorentzian contours were applied (inset Figure 3). The three peaks in the PL spectrum in Figure 3 corresponded well to the three transitions (e1-hh1, e1-lh1, and e2-hh2) and fitted well with the decomposed curves produced by Lorentzian approximation. The quantum-confinement energy levels and transitions in the active region of the TCQW at 300 K were presented schematically in an energy band diagram (see Figure 4).
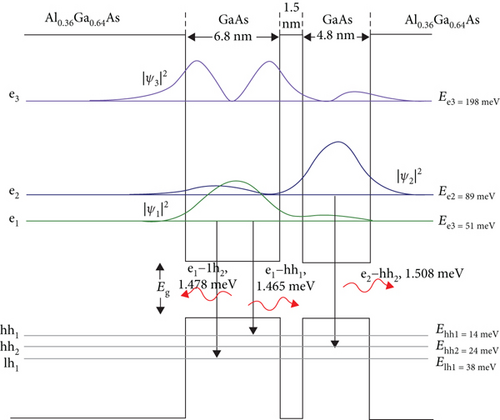
To investigate hot charge carrier phenomena of the studied structure, the temperature of the lattice structure was reduced to a constant 77 K because it is difficult to observe hot electron temperature at the high-energy tail of PL spectra produced at a lattice temperature of 300 K. PL spectra were then produced at various optical pumping intensities. Under a pumping intensity of 81.07 kW/m2, PL peaks occurred at 1.555 eV and 1.568 eV (see Figure 5). Based on the calculated quantum-confinement energy levels and squares of envelope wave functions (see Figure 4), we concluded that these PL peaks corresponded to the e1-hh1 and e2-hh2 transitions, respectively.
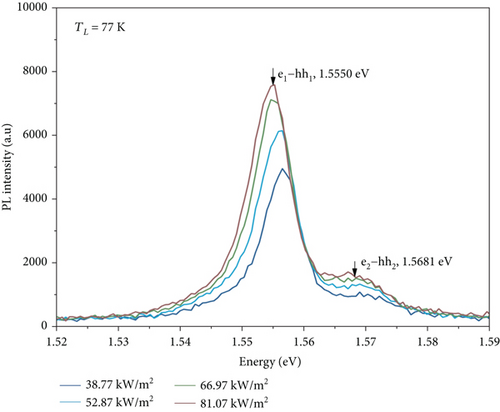
Under the influence of a sufficiently intense optical excitation, the lattice temperature of a TCQW will rise, and free carriers will have more kinetic energy. To maintain the stationary energy state of the system, these free carriers transfer their excess energy back to the system through collisions with other carriers or by emitting and absorbing optical phonons. These events are known as hot charge carrier phenomena. Since we had obtained information about hot electron temperatures from the high-energy tails of PL spectra produced at a lattice temperature of 77 K, we recorded PL spectra produced at the same lattice temperature under selected laser pumping intensities and then considered the high-energy tails as functions of the energy of photons emitted at 77 K (see Figure 6).
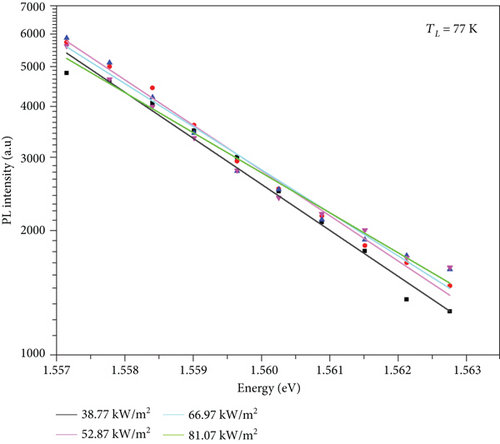
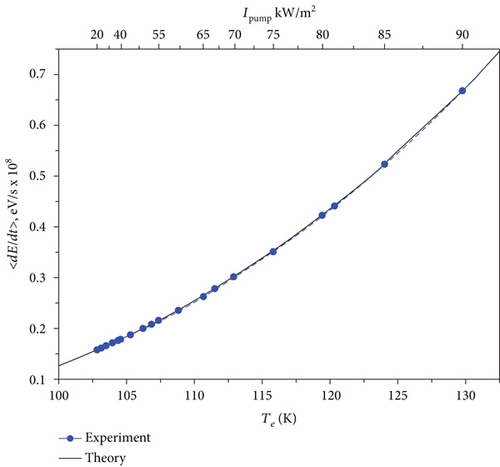
As discussed above, using Equation (1) and data from the high-energy tails of the experimentally obtained PL spectra (see Figure 6), we obtained Te ranging from 105 to 120 K. Using Equation (6), 〈dε/dt〉(Te) was theoretically calculated from the derived data as a function of hot electron temperatures. The 〈dε/dt〉(Te) obtained from experiment varies exponentially, thus in agreement with theoretical expectation. The results of the calculations from experimental and theoretical data were presented in Figure 7.
3.2. PL Spectrum Measurement at a Constant Pumping Intensity at Various Lattice Temperatures from 77 K to 300 K
To investigate the hot charge carrier phenomena of the undoped GaAs/Al0.36Ga0.64As TCQW at different lattice temperatures, PL intensity was measured at a constant pumping intensity of 23.8 kW/m2 while lattice temperature was varied from 77 K to 300 K by increments of approximately 10 K. The experimental results showed that at lattice temperatures higher than 96.7 K (see Figure 8), the interband transition peaks of e1-hh1 were shifted to the low-energy region because of heating in the active region of the structure during pumping.
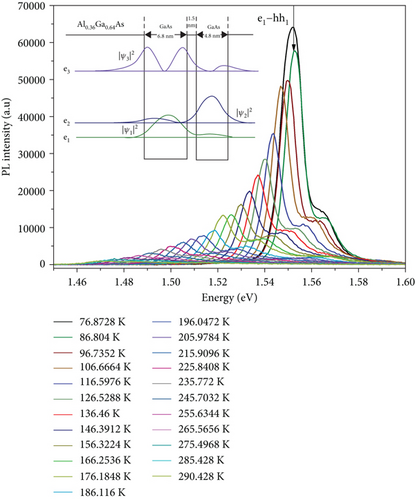
Besides the redshift behavior of e1-hh1 transition, the interband transition peak intensity of e1-hh1 was higher at 77 K than at 300 K at the same laser pumping intensity. The main reason for this higher transition energy was the difference in the quantum-confinement energy levels of e1 and e2, which was about 38 meV. This energy difference is not much more than thermal energy at room temperature (26 meV). Also, the square of the envelope wave functions of the first () and second () subbands of the first electron level e1 and the second electron level e2 were, respectively, located at the wider QW and at the narrower QW of the TCQW structure. Therefore, at room temperature under sufficiently high interband optical pumping, electrons can possibly occupy levels e1 and e2 at the same time; consequently, the e1-hh1 peak intensity was lower at 300 K than at 77 K. The squares of the envelope functions of e1 (), e2 (), and e3 () are presented in the inset of Figure 8.
4. Conclusions
We investigated the intensity of photoluminescence spectra produced by an undoped GaAs/Al0.36Ga0.64As Tunnel-Coupled Quantum Well under various laser pumping intensities at lattice temperatures of 77 K and 300 K. At a lattice temperature of 300 K, all photoluminescence spectra showed three peaks corresponding to interband transitions, which were electron-hole transitions from e1-hh1, from e2-hh2, and from e1-lh1. The three transitions fitted well with Lorentzian curves. Broadening of the spectrum was discussed as a possible indication of injected electrons at subband level e2. The proposition was confirmed by the calculated quantum-confinement energy and the square of the envelope wave functions of electron subband levels in the active region of the TCQW. At a lattice temperature of 77 K, photoluminescence spectra showed two peaks that corresponded to e1-hh1 and e2-hh2 electron-hole transitions. These transition peaks shifted to the low-energy region as laser pumping intensity increased. The slight shift in the peak e1-hh1 from a higher energy region to a lower energy region of emission was a result of heat transfer due to air convection in the cryostat during the continuous laser pumping excitation of the sample. High laser pumping intensity affected the physical properties of carriers in the system, increasing their temperature, thus creating hot electrons. Hot electron temperature in this structure was investigated by studying high-energy tail photoluminescence intensity. The results of the average scattering energy rate at a lattice temperature of 77 K as a function of hot electron temperatures were compared with results obtained from theoretical calculations. Finally, we experimentally studied the photoluminescence intensity spectra produced at lattice temperatures from 77 K to 300 K under a fixed pumping intensity of 23.8 kW/m2. At higher lattice temperatures, characteristic photoluminescence peak broadening occurred, producing interband transition peaks from e1-hh1 that had higher intensity at 77 K than at 300 K.
Conflicts of Interest
The authors declare that there are no conflicts of interest.
Acknowledgments
This research was supported by the Program Management Unit for Human Resources & Institutional Development, Research and Innovation (grant number B05F630108), the Thailand Excellence Center in Physics (ThEPCenter) (grant number ThEP-60-PHY-PSU4), and the Development and Promotion of Science and Technology Talents Project (DPST). The fabrication of the TCQW and the calculation of quantum-confinement energy levels were carried out at the Nonequilibrium Electrons Optics Laboratory, Institute of Physics, Nanoelectronics and Telecommunications, Peter the Great Saint Petersburg Polytechnic University, Russian Federation. The authors would like to thank Dr. Komrit Wattanavatee for supplying the LN2 used in this research. Mr. Thomas Duncan Coyne helped with the English grammatical revision.
Open Research
Data Availability
The calculation of quantum-confinement energy level data used to support the findings of this study are included within the article.


