Production Data Analysis and Practical Applications in the Sulige Tight Gas Reservoir, Ordos Basin, China
Abstract
Successful exploitation of tight sandstone gas is one of the important means to ensure the “increasing reserves and production” of the oil and gas initiative and also one of the important ways to ensure national energy security. To further improve the accuracy of historical matching of field data such as gas production and bottom-hole pressure during the production process of this type of gas reservoir, in this study, a new expression of wellbore pressure for the uniform flow of vertical fractured wells in Laplace space based on the point sink function model of vertical fractures in tight sandstone gas reservoirs is constructed. This innovation is based on a typical production data analysis plot of the Blasingame type that uses the numerical inversion decoupling mathematical equation. After analyzing the pressure and pressure derivative characteristics of each flow stage in the typical curves, a new technique of type-curve matching was proposed. In order to verify the correctness of the model and the application value of the field, based on the previous production data of Sulige Gas Field in China, a new set of production data diagnostic chart of tight sandstone gas reservoir was formed. A case analysis showed that the application of the production data analysis method and data diagnosis plot in the field accurately evaluated the development effect of the tight sandstone gas reservoirs, clarified the scale of effective sand bodies, and provided technical support for optimizing and improving the well pattern and realizing the efficient development of gas fields.
1. Introduction
Tight gas is widely distributed in China, and the favorable area is 32 × 104 km2 and is primarily distributed in Ordos, Sichuan, Tarim, Songliao, and other sedimentary basins. These areas have become important fields for oil and gas production and storage [1, 2]. According to the fourth China oil and gas resources census, China’s tight gas geological resources reached 21.86 × 10¹² m3, and the recoverable resources were 12.14 × 10¹² m3 [3]. The Sulige gas field is a typical representative of a tight sandstone gas reservoir in China. The primary production layers are the Upper Paleozoic Shihezi Formation and the Shanxi Formation. These have the characteristics of many gas-bearing strata, a thin single-layer thickness, poor reservoir physical properties, strong heterogeneity, a low formation pressure coefficient, and a low reserve abundance [4]. To achieve the scale-benefit development of tight gas reservoirs, it is necessary to implement fracturing measures for reservoirs to minimize the gas flow distance and reduce the flow resistance, so as to maximize the effective scale utilization. With the deepening of development, the well type put into production in Sulige gas field has gradually changed from a single-well to a multiwell cluster deployment. However, it is still dominated by vertical well development, accounting for more than 80% of the total number of wells [5]. The reliability of the productivity evaluation results of the fractured vertical wells directly affects the stable production, development technology optimization, and surface engineering construction of the Sulige gas field.
The traditional production data analysis methods have a rich history experience. For example, the early Arps production decline analysis method has been widely used as the primary means to analyze production declines due to its simple application and use of less actual development data. However, gas wells in tight gas reservoirs often have the characteristics of unstable working systems and large differences in production characteristics at different production stages. These led to many unfavorable conditions in the application of the Arps method, such as data dispersion, more singular points, a low fitting accuracy of the test data, and difficulty in identifying the correlation coefficient close to the decline type under the different types of decline. The modern production decline analysis method is based on the theory of unstable flow and combines the advantages of the reservoir engineering method and the modern well test analysis to establish a new type of simulation chart. It uses the daily production dynamic data to quantitatively analyze the seepage characteristics of oil and gas wells, determine reservoir parameters, and calculate well-controlled reserves. This method primarily includes the empirical method represented by the Arps method [6], the classical analysis method represented by the Fetkovich method [7], the modern double logarithmic curve fitting method represented by Blasingame et al.’s method [8], and the reservoir engineering method represented by the FMB method [9]. This method and the entire life cycle of the modern well test analysis have become the primary methods of reservoir dynamic description, and the corresponding analysis software has been widely used in various oilfields at home and abroad. The decline analysis models of vertical wells, vertical fractured wells and horizontal wells in composite, and double permeable and triple media have been established successively. But some researchers have confused the concepts of Blasingame et al.’s material balance (pseudo) time with Fetkovich’s dimensionless time, causing errors in the typical graphs. In addition, the production integral curve and the production integral derivative curve of the vertical fractured wells in tight gas reservoirs and the fitting calculation of effective permeability and the effective fracture half-length are rarely provided in detail.
Therefore, this study redefines the material balance (pseudo) time function, transforms the dimensionless pressure reciprocal under the condition of bottom-hole production into the dimensionless production under the condition of bottom-hole pressure, and discusses the productivity dynamics of vertical fractured wells under the condition of unstable flow in a closed formation. After integrating the point source function of the vertical fractured wells, the typical curves of the Blasingame-type production data analysis are obtained using the Laplace space change and numerical inversion calculation, and a new production data analysis method for vertical fractured wells in low permeability tight gas reservoirs is formed. Combined with a large number of field production data research work, by the fitting and regression of actual production data under different reservoir conditions, the problems caused by poor quality of data during each flow stage of the gas wells are summarized. A set of data diagnosis plot suitable for tight sandstone gas reservoirs is formed so as to evaluate the development effect of a vertical fracture single well and a gas zone more accurately.
2. Production Data Analysis
2.1. Material Balance (Pseudo) Time
The results of the liquid percolation can be directly used in the gas percolation problem. After the deformation of Equation (3), the gas variable flow inflow performance relationships in the same form as the liquid percolation proposed in references [16, 17] can be obtained:
2.2. Mathematical Production Model of the Fractured Well
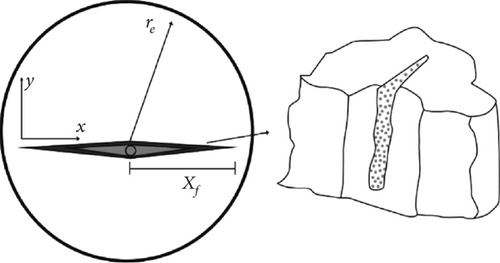
As shown in the model in Figure 1, a vertical fractured well with a fracture half-length (xf) was located in the center of the homogeneous formation with a drainage radius (re). The fluid was assumed to be single-phase compressible, regardless of the capillary force and gravity, and when isothermal Darcy percolation occurred, the production was constant.
Equation (9) is the dimensionless bottom-hole pressure expression of the well with a uniform flow vertical fracture in the Laplace space.
Substituting Equations (12) and (13) into Equation (11), the dimensionless production decline curve of the Blasingame type was obtained (Figure 2).
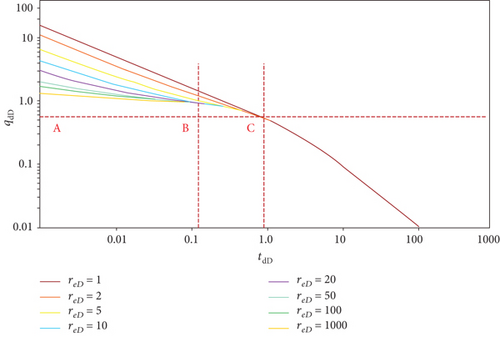
As shown in Figure 2, the decline curve of the Blasingame was a set of curves with different dimensionless reservoir drainage radius (reD) values during the early unsteady flow process. When reaching the boundary of the closed formation, this set of curves controlled by the dimensionless reservoir drainage radius converges into a harmonic decline curve. The decline curve can be divided into three flow stages: the AB section is an unstable flow stage in the early stage of the well opening. The production data of this stage showed that the fluid was not affected by the boundary, which was equivalent to flowing in an infinite formation. The boundary had no effect on the flow. The dimensionless production was primarily controlled by the dimensionless reservoir drainage radius. When the dimensionless reservoir drainage radius increases gradually, the dimensionless production decline curve will move downward. According to the curve of this period, the relevant information of near well zone can be obtained, such as the effective permeability and skin factor. There were few corresponding production data points in the BC section, primarily due to the short flow period, which was the transition part from the unstable flow stage to the pseudo-steady flow stage. The CD section is a pseudo-steady-state flow stage. The pressure disturbance completely spreads to the boundary; that is, the pressure drop propagates to the boundary and has an impact on the flow. The production of the CD section is completely derived from the expansion of rock and fluid due to pressure drop, and the pressure drop velocity at each point was the same. According to the analysis of this stage, the required parameters, such as the well control dynamic reserves and the reservoir drainage radius, can be calculated and deduced.
2.3. Production Integral and Integral Derivative Curve
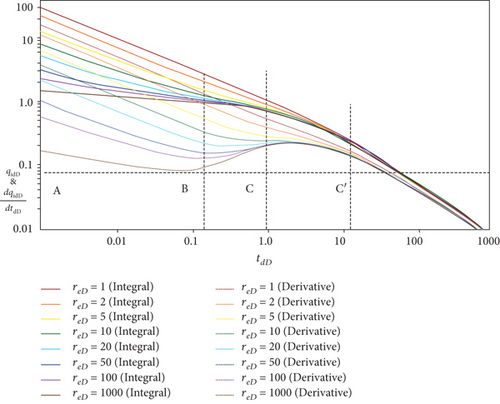
The dimensionless production decline curve plot can make the derivative curve smoother and easier to judge through the application of the derivative form after the integration of the dimensionless production. As can be seen in the actual derivation process, since the output integral results are sensitive to the error of the early data points, a small error of the early data points will make the derivative curve produce a relatively large cumulative error. According to the field data and the data obtained in the laboratory, the obtained plot can be used to fit the actual data. Reservoir-related physical properties can be obtained by the dimensionless production decline curve, the dimensionless production integral curve, and the derivative curve fitting.
A linear interpolation on the interval (ti, fi) and (ti+1, fi+1) is able to obtain the Blasingame-type dimensionless production rate integral curve and the dimensionless production rate integral curve of the derivation (Figure 3).
3. Production Data Diagnosis
It was found in the field research that the quality of production data was crucial for the analysis results. Some production data will have some “illusions,” and these “illusions” may be due to data acquisition instrument problems or improper practical operation methods, which are inevitable [24]. These “illusions” should be removed when processing the data. In common cases, such as the poor quality of the wellhead pressure into bottom-hole pressure, the early production data analysis will be affected by the so-called well washing operation.
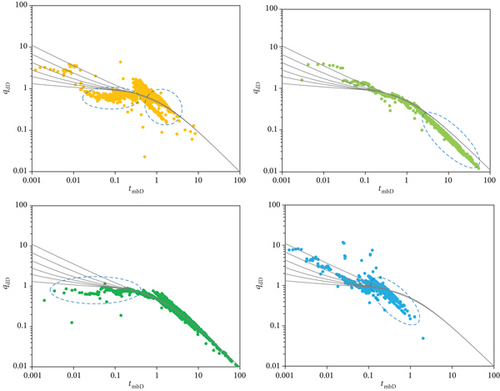
The number of vertical fractured vertical wells in the Sulige gas field is huge, and because of the gas well’s own factors or external reasons, the actual production data curve fluctuates more. Hence, it is difficult to intuitively see the quality of the gas well production data. A set of typical curves is an effective diagnostic tool. By noise reduction processing of production data, the processed production data curve can be compared with the typical curve chart, and the real interpretation of data can be quickly and directly sought. Based on a large number of production data analyses, this study comprehensively summarizes several common problems encountered in the comparison of production data of vertical fractured gas wells in the Sulige gas field using typical curve charts (Figure 4). In addition, a set of diagnostic plots for production data of the tight sandstone gas reservoirs are established (Figure 5 and Table 1). The diagnostic plot can help researchers accurately find problems in the data analysis, improve the data quality, and accurately predict the future of gas wells, the reservoir information, and the characteristic parameters of gas wells.
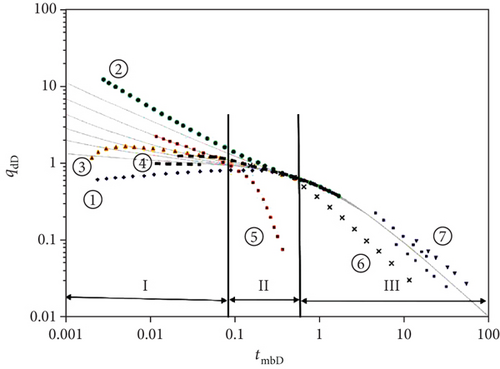
| Problem | Cause | |
|---|---|---|
| I Unsteady state | ① Flat early data | Contaminated well |
| ② High early data | Initial reservoir pressure is low | |
| ③ Normalized rate increases with time | Well washing | |
| ④ Step-shaped early data | Initial reservoir pressure is high? Large tubing size | |
| II Transitional stage | ⑤ Early arrival of boundary flow | Bottom hole overstock liquid |
| III Pseudo-steady state | ⑥ Data below the 45-degree slope line | Bottom hole overstock liquid |
| Pressure loss caused by wellbore instability | ||
| Multiwell interference (Energy leakage) | ||
| ⑦ Not unified | Unstable production (Workover, etc.) | |
In the actual field application, the visual data curve and the typical curves are fitted and analyzed from three different flow stages. If the curve trend of the data appears similar to the curve in the diagnostic plot in this study, that is, this part of the data is different from the trend of the typical curve chart, then the engineer can be reminded that the data of this portion has quality problems. Compared with the problems in different flow stages, as shown in Table 1, the causes of the problems are discovered, and the corresponding solutions are selected to improve the data quality and improve the accuracy of the gas well analysis.
The use of the data diagnosis plot of the tight sandstone gas reservoir to detect the quality of dynamic data from a gas well is not only intuitive, but also convenient. Prior to the evaluation of a single well, the data diagnostic plot can be compared, the problems can be discovered in time, and the reasons can be discovered to ensure the accuracy of the gas well evaluation. Prior to the analysis and evaluation of the block, gas wells with good production data or the gas wells with improved data quality can be selected for priority analysis to help engineers grasp the scale of effective sand bodies and develop the overall block more efficiently.
4. Applications in the Field
4.1. Single-Well Application
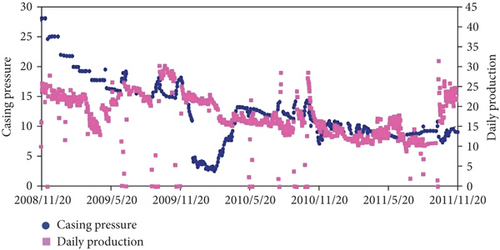
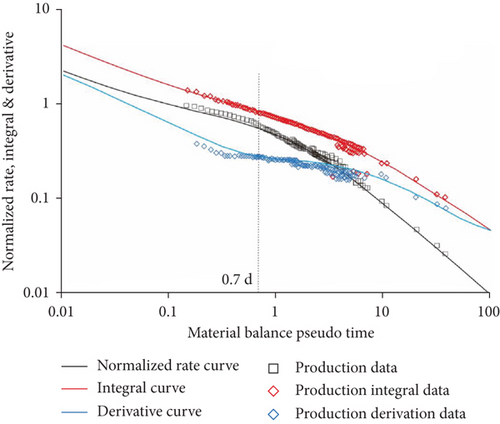
Well V0 in the Sulige gas field is a tight sandstone gas well that was produced after fracturing (artificial fracture 92 m at depth 637 m) in November 2008. The target layer is the reservoir of the Shan 1 member that is primarily composed of grey white-grey medium and coarse sandstone and grey-black fine sandstone. The debris content in the debris particles is high, and the rock types are primarily lithic quartz sandstone and quartz sandstone. The porosity of the reservoir is primarily 4.0–10.0%, with an average of 6.1%, and the permeability is primarily 0.100–1.000 mD, with an average of 0.265 mD. This is typical for a tight sandstone reservoir. In order to avoid a long time shut-in pressure recovery test, the modern production data analysis of well V0 was studied. The gas reservoir description data, production dynamic curve, and fitting curve are shown in Table 2 and Figures 6 and 7, respectively.
| Parameter | Value | Parameter | Value |
|---|---|---|---|
| Net pay (m) | 15 | Geological reserve (104 m3) | 3727.73 |
| Shaft radius (m) | 0.067 | Total porosity (%) | 9.5 |
| Reservoir temperature (K) | 383.15 | Initial viscosity of gas (mPa·s) | 0.0036 |
| Initial water saturation (%) | 68 | Initial volume factor | 0.0021 |
The biggest difference between the production data analysis method of the vertical fractured wells in tight gas reservoirs and ordinary vertical wells is that the fracture half-length analysis is increased, and the interpretation results of this study also found this increased skin factor.
- (i)
The material balance (pseudo) times at each production time point were obtained
- (ii)
Moving the processed production data points on the Blasingame-type dimensionless yields integral and integral derivative chart. The yield integral curve was first fitted because the curve was smoother than the yield decline curve. Then, the production decline curve and the integral derivative curve were used for the fitting. Finally, the time step and dimensionless discharge radius were adjusted to select the best fitting effect to obtain the fitting parameter values
- (iii)
The real parameter information of well V0 was obtained from the fitting parameters and well control parameters (Table 3)
| Parameter | Value | Parameter | Value |
|---|---|---|---|
| OGIP (m3) | 2853.33 | Drainage radius (m) | 143.53 |
| Effective permeability (mD) | 0.24 | Fracture half-length (m) | 28.71 |
| Drainage area (km2) | 0.64 | Skin factor | 2.6 |
According to the analysis of modern production data, the following understanding of well V0 was obtained. Compared with the diagnostic chart of tight sandstone, the production data qualities of gas wells were better. It can be seen from Figure 7 that when the material balance time was longer than 0.7 days, the fitting rate between the actual data and the typical data was greater than 90%. When the material balance fitting time was shorter than 0.7 days, the fitting rate between the actual data and the typical curve was below 60%. The data noise was primarily caused by factors such as well pollution and inaccurate logging of the early production data. Although there was a certain gap between the actual well-controlled reserves and the previous gas reservoir description, the quality of the data was relatively high. Hence, the interpretation results can be judged accurately. The effective permeability was consistent with the overall permeability of the Shan 1 reservoir, and the fitting effect was good. The fracturing effect was far from the design goal, and the near wellbore skin pollution was serious.
It is recommended to modify the geological modeling carrier and numerical simulation data based on the parameters with the good fitting effects (fracture half-length, formation permeability, and well-controlled reserves). The core of the target layer wellbore was taken, and a conventional gas reservoir test and analysis were conducted to study the seepage law of fluid in the porous media. Combined with the microseismic monitoring of well v0, secondary or multiple repeated fracturing was conducted. It is suggested that the length of the artificial fracture be extended to the outer boundary of the reservoir so as to form an effective area for the expanding volume fracturing and further increase the dominant channel for fluid seepage. In view of the serious skin pollution, it is recommended to implement an acid plugging removal operation, which plays an auxiliary role in improving the fluid seepage capacity.
4.2. Block Applications
Clarifying the scale of the effective sand body and reasonably designing the well spacing are important means to improve the production degree and recovery efficiency of tight gas reservoirs. This production data analysis method can determine the scale of effective sand bodies from a dynamic perspective and use the dynamic data of gas wells to analyze the controlled reserves and production range of gas wells, thus providing a basis for optimizing well spacing.
Gas wells in tight gas reservoirs are typically put into production after fracturing. The typical dimensionless production analysis chart deduced in this study was compared with the actual production data of gas wells to fit the dimensionless production, the dimensionless production integral, and the dimensionless production derivative under dimensionless time under different ratios of the gas discharge radius to the fracture half-length. Combined with the production data diagnosis chart, the gas wells with better production data quality were selected to predict the fracture half-length and discharge radius. The Sulige gas field X block gas well evaluation was selected in this study. After the plate fitting analysis, the discharge radius was 130–390 m, with an average of 242 m, and the sand body width in this block was preliminarily estimated to be approximately 484 (Table 4). Combined with the well logging data of the block, it was concluded that the size of the core beach and the distribution characteristics of the channel in the block were in good agreement with the conclusion obtained by the production data analysis method. Therefore, this conclusion provides strong evidence for the demonstration of the sand body size and guides the improvement and optimization of the well pattern in the block.
| Well | V1 | V2 | V3 | V4 | V5 | V6 | V7 | V8 | V9 | V10 | V11 | V12 | V13 | Average |
|---|---|---|---|---|---|---|---|---|---|---|---|---|---|---|
| Drainage radius/m | 340 | 384 | 362 | 318 | 256 | 183 | 161 | 145 | 134 | 163 | 279 | 207 | 210 | 242 |
Based on the dynamic understanding of the above sand body scale, the reasonable well pattern density suitable for this area is determined, which effectively guides the well pattern adjustment in this area. The production performance shows that after optimizing the well pattern, the interference between wells is low and the gas well production effect is better.
5. Conclusion
- (1)
It was seen from the typical curves that the production decline curve could be divided into three flow stages: the first stage was an unstable decline section, and the curve did not coincide. Stage 2 was the transition section, where the curve gradually overlapped. Stage 3 was a pseudo-steady decreasing section with a slope of -1, which was close to the Arps harmonic decreasing trend
- (2)
Based on a large amount of field research work, a set of diagnostic curves for the production data of the tight sandstone gas reservoirs was established. The diagnostic curves can help engineers quickly discover the causes of the poor quality production data and select the corresponding solutions to improve the data quality and improve the accuracy of the gas well analysis
- (3)
The specific analysis steps of production data fitting were provided in detail. Using an analysis of the production data, such as unstable pressure and production, the parameters, such as the well control reserves, the effective permeability, and the skin factor were obtained. The calculation results can be used as a basis for the quantitative evaluation of gas well development effects
- (4)
This study expounded on the use of gas well dynamic data to analyze the controlled reserves and the production range of gas wells in the block. In addition, gas wells with good data quality or gas wells that can improve data quality for analysis were selected so as to obtain an accurate and effective sand body size of the tight sandstone. This will not only provide technical support for the reasonable optimization of the well pattern but also provide suggestions for adjustments of the gas reservoir development plan
Nomenclature
-
- bpss:
-
- Time-independent constant
-
- Bgi:
-
- m3/m3; volume coefficient under the original formation pressure, m3/m
-
- cgavg:
-
- 1/MPa; gas average compression factor, 1/MPa
-
- cti:
-
- 1/MPa; gas compression factor in the initial state, 1/MPa
-
- CA:
-
- Dietz shape coefficient
-
- G:
-
- Geological reserves, m3
-
- h:
-
- Effective thickness of the reservoir, m
-
- I0, I1:
-
- Zero-order and first-order Bessel functions of the first kind of deformation
-
- K0, K1:
-
- Zero-order and first-order Bessel functions of the second kind of deformation
-
- kg:
-
- Gas permeability, mD
-
- L−1:
-
- Laplace inverse transformation
-
- m(p):
-
- Pressure function
-
- p:
-
- Pressure, Pa
-
- :
-
- Dimensionless pressure in the Laplace space
-
- pavg:
-
- Average formation pressure, Pa
-
- pdD:
-
- Redefined dimensionless pressure
-
- pD:
-
- Dimensionless pressure
-
- pi:
-
- Original formation pressure, Pa
-
- pwD:
-
- Dimensionless bottom-hole pressure
-
- :
-
- Dimensionless bottom-hole pressure in Laplace space
-
- pwf:
-
- Bottom-hole flow pressure, Pa
-
- qg:
-
- Gas well flow, m3/s
-
- :
-
- Dimensionless yield in the Laplace space
-
- rD:
-
- Dimensionless radial coordinates
-
- reD:
-
- Dimensionless drainage radius
-
- re:
-
- Drainage radius, m
-
- rw:
-
- Wellbore radius, m
-
- s:
-
- Laplace variable
-
- t:
-
- Time, s
-
- ta:
-
- Material balance (pseudo) time, s
-
- tdD:
-
- Redefined dimensionless time
-
- tD:
-
- Dimensionless time
-
- tmbaD:
-
- Dimensionless material balance (pseudo) time
-
- T:
-
- Formation average temperature, K
-
- xf:
-
- Half-length of the crack, m
-
- x, y:
-
- x axis and y axis of the rectangular coordinate system
-
- xD, yD:
-
- x axis and y axis of the dimensionless Cartesian coordinate system
-
- Zavg:
-
- Gas deviation factor under the average formation pressure
-
- Zi:
-
- Gas deviation factor under the original formation pressure
-
- μgavg:
-
- Gas average viscosity, mPa·s
-
- μgi:
-
- Viscosity of initial gas, mPa·s
-
- αD:
-
- Integral variable
-
- ϕ:
-
- Reservoir porosity, %
-
- γ:
-
- Euler constant.
Conflicts of Interest
The authors declare that they have no conflicts of interest.
Acknowledgments
This thesis was funded by the national science and technology (No. 2016ZX05047) and the science and technology project of PetroChina Company Limited (No. 2019B-1509).
Open Research
Data Availability
Data are available on request to the authors.


