Study on Fracture Distribution and Local Brittleness Characteristics Based on Stepwise Regression Method
Abstract
The brittleness of rock is an important parameter that influences and controls the evolution mechanism of the fracture and formation of a fracture net. The existing methods of brittle characterization are describing the brittleness of rock mass as a whole. They lack reliability descriptions to guide the fracture strike and improve the volume of the reservoir. It is considered that the macroscopic brittle fracture of a rock is the process of continuous initiation and propagation of local fractures in the rock mass under the action of external loads. The macroscopic fracture is the appearance caused by a local rupture to a certain extent, and the local rupture is the root cause of macroscopic fracture. The study of the local brittleness of a rock can reveal the intrinsic nature of its fracture behavior and can reflect the evolution mechanism of fracture more directly and accurately. In this paper, coring sampling in field outcrop is first carried out, and the break evolution law of core is described by a CT scanner. The mineral compositions in the core are determined by a mineral analysis diffractometer. The regulation of the rock local brittleness with different mineral contents is analyzed. And a new method for local brittle region division and characterization of rock has been developed. This method gives the connotation relation of the rock brittle fracture as a whole induced by a local brittle fracture. And it provides a new approach to study the law of a rock fracture.
1. Introduction
With the shortening of the proven oil and gas reserves, unconventional oil and gas exploitation is the inevitable development trend in the future to ensure the sustained and stable oil and gas production. As a new type of clean energy, unconventional oil and gas has the advantages of wide resource distribution, abundant reserves, and long exploitation life. It has become a hot spot in global oil and gas exploration and development.
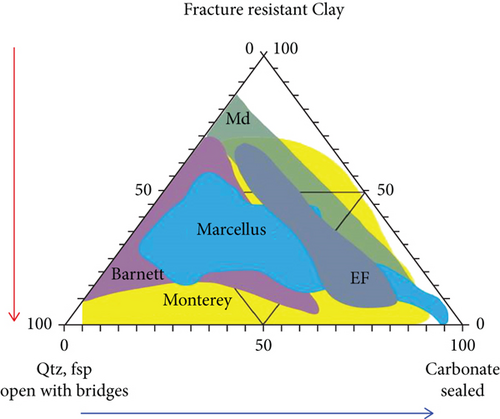
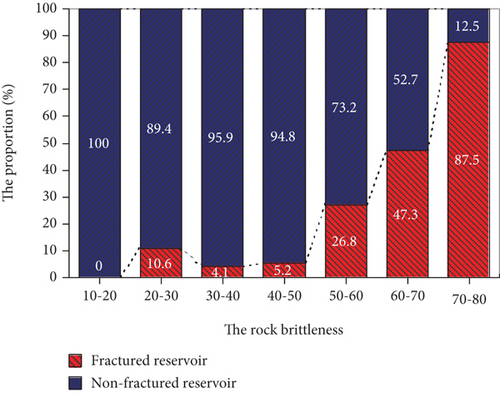
For unconventional oil and gas reservoir development, the large-scale volume fracturing method is often used to reform. This method is efficient and economical, and the effect of improving reservoir permeability is outstanding. The study shows that the brittleness of a rock can significantly affect the reservoir fracturing effect and wellbore stability [1]. Therefore, the evaluation of brittleness characteristics has become the primary factor to be considered in fracturing well selection and scheme design [2]. Statistical analysis shows that there are more than 30 methods to characterize brittleness [3–23]. Most of these methods are put forward to specific problems, applicable to different disciplines, each with its own advantages and limitations. During this period, Zhaoping and Suping [24] applied the methods of X-ray diffraction, fluorescence spectrum analysis, and mechanical test to study the mineral composition and chemical composition characteristics of coal-bearing mudstone. They established a qualitative and quantitative relationship between the mechanical properties (including uniaxial compressive strength and elastic modulus) of mudstone and its chemical composition (including SiO2 and FeO) and found that the uniaxial compressive strength and modulus of elasticity of mudstone increased with the increase of SiO2 content. Burnaman and other scholars [25, 26] consider that mineral composition is the internal reason for controlling rock brittleness and causing a difference in the fracture net fracturing effect and makes a three-terminal element diagram of a rock brittle to evaluate the brittleness qualitatively according to the relative content of minerals in shale. Wen-Long’s [27] analysis shows that the rock with high contents of quartz, feldspar, and carbonate is brittle. This kind of rock is easy to form natural fractures and induced fractures under the action of external forces, and its development degree is generally positively correlated with the content of brittle minerals. Liu et al. [28] found that the mineral content, composition distribution, and fracture development characteristics are important internal controlling factors affecting the brittleness of rock mass. In the same year, Gale et al. [29] found a negative correlation between the clay mineral content and natural fracture development characteristics, as shown in Figure 1. Lin et al. [30] established a nonlinear viscoplastic element on the basis of time-dependent shear strength by connecting the plastic element representing shear strength with the viscous element in parallel and studied effectively the mechanical properties of rock from the point of difference of shear strength. Zhang et al. [31] are using the discrete element numerical method to establish five different numerical models of regular sawtooth joints, study the shear mechanical characteristics of joints under creep condition, and analyze the influence of creep on the mechanical characteristics of joints. Xiangyuan et al. [32] obtained that reservoir brittleness controlled the development characteristics and degree of natural fractures based on the analysis of Chang 7 tight reservoir in Longdong Area. The larger the reservoir brittleness is, the more likely the fracture will occur under the action of tectonic stress, which will lead to the increase of fracture development. That is, the higher the content of brittle minerals (quartz, calcite, dolomite, and feldspar) in shale, the more developed the natural fractures in the area and the larger the brittleness. And the higher the content of clay minerals, the less developed the natural fractures in the area and the larger the toughness, as shown in Figure 2.
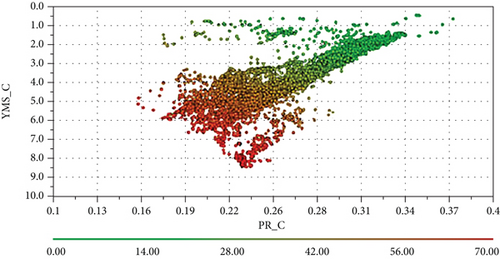
Both of these methods can accurately characterize the brittleness of reservoir rocks to a certain extent. However, the brittleness description is based on the analysis of the overall brittleness of the research object, and the influence of natural fracture development on rock brittleness in reservoir cannot be described. In 2015, Bing et al. [36] analyzed the acoustic emission signal of the fracturing test and found that the peak of AE accumulation events occurred before the pump pressure reached the peak rupture pressure. This phenomenon shows that before the macrofracture of the rock mass, many microfractures have appeared in it, and the accumulation of microfracture finally leads to the fracture of the core as a whole. Wang et al. [37] proposed a new index for the brittleness evaluation of rock mass based on catastrophe theory and found that the softening modulus and brittleness index changed in polynomial with the increase of confining pressure.
Therefore, it is considered in this paper that the macrobrittle fracture of the rock is a process of local fracture initiation, propagation, microfracture, and gradual deterioration of rock matrix under external loads. The study of the local brittleness characteristics of the rock mass can reveal the intrinsic essence of the rock microfracture behavior and can more directly and accurately reflect the fracturing capacity and fracture evolution mechanism. Firstly, the law of local fracture propagation and fracture in shale during compression test is analyzed by CT scanning. And a method for characterizing local brittleness of shale is established by means of diffraction analysis of the core mineral composition and stepwise regression method. Finally, the local brittle fracture law of an artificial fracture is analyzed by a hydraulic fracturing test.
2. Analysis of Shale Core Compressive Fracture Law by CT Scanning
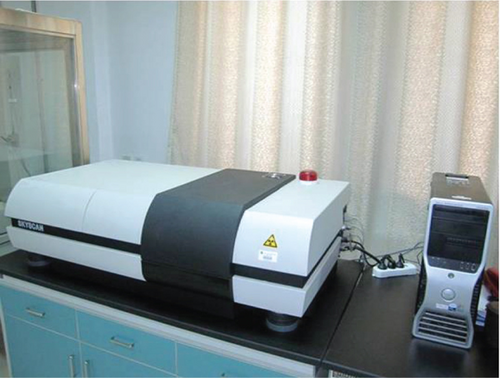
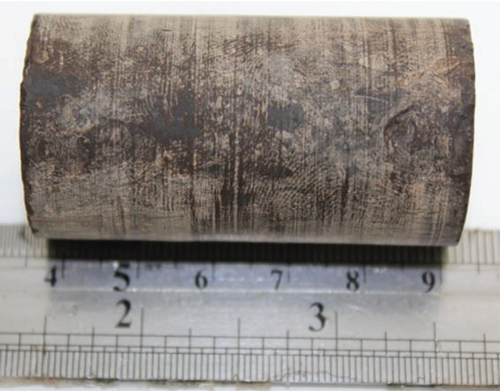
In this paper, the SkyScan 1172 high-resolution CT machine is used for the CT scanning test, as shown in Figure 4. This machine is a product of SkyScan company in Belgium. It uses the principle of microfocus X-ray imaging to perform ultrahigh-resolution three-dimensional imaging, which can obtain high-precision three-dimensional images without damaging the core. It is small in size, high in resolution, and can observe very fine structure without sample preparation, dyeing, and slicing. The test cores are taken from layer B in block A in Liaohe Oilfield, as shown in Figure 5. The core is scanned by CT, and the fracture distribution of the sample after CT scanning is obtained in 30 s, 90 s, 120 s, and 180 s, as shown in Figure 6 [38].
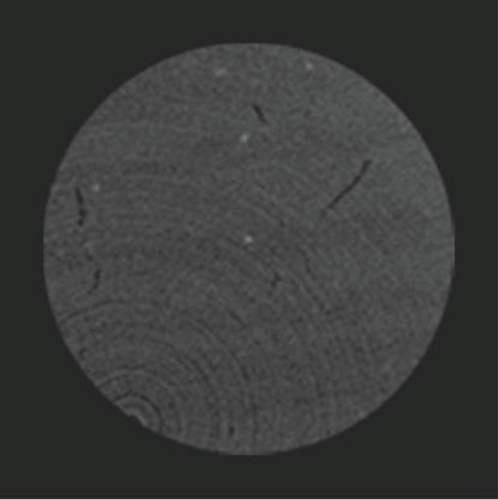
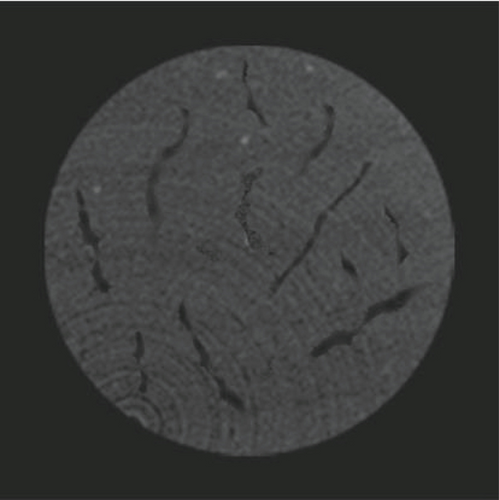


The CT scan results show that the process of shale rupture begins with the formation of local short microfractures in the core between 0 and 30 s. With time between 30 s and 90 s, local microfractures grow longer and new ones form elsewhere. When the time reaches 120 s, the microfractures intersect and connect with others to form larger microfractures, which cause core instability and fracture at 180 s. Therefore, the macrofracture of shale is the phenomenon caused by local fracture to a certain extent, and the local fracture is the fundamental cause of macrofracture.
3. Establishment of Rock Local Brittleness Characterization Method
Because the macrofracture of a rock is caused by the local brittle fracture and expansion, how to characterize the rock local brittleness has become an important research content in this paper. It is impossible to analyze the rock brittle distribution from the microscopic field by means of rock mechanical parameters or stress-strain tests. The mineral component analysis method is used to describe the rock brittle distribution in this paper. The mineral analysis method proposed by Rickman only considers the rock mineral composition itself, without considering the influence of rock heterogeneity, reservoir environmental factors, and the development of natural fractures. Therefore, this method is improved and perfected.
Repeatedly quoting and eliminating parameters until the regression equation cannot quote and eliminate any variables. In this case, all the selected parameters are independent variables for the regression equation.
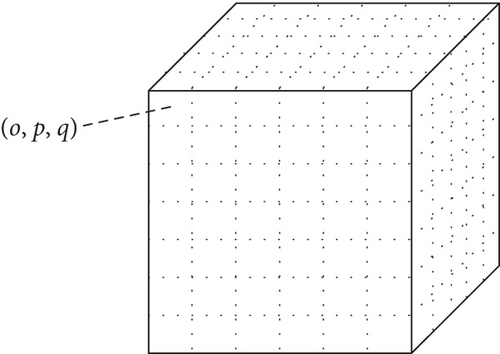
The regression equations of the rock elastic modulus and Poisson’s ratio calculated by the stepwise regression analysis method are and , respectively. So for a new core sample, it can be discretized into infinitesimal units, as shown in Figure 7.
Formula (12) is the expression of rock local brittleness. This formula combines the study of reservoir environment to analyze and quantify the influence of mineral composition on the rock brittleness. The results are scientific and representative. And the local brittleness change low can be accurately characterized according to the heterogeneity of reservoir.
4. Case Verification
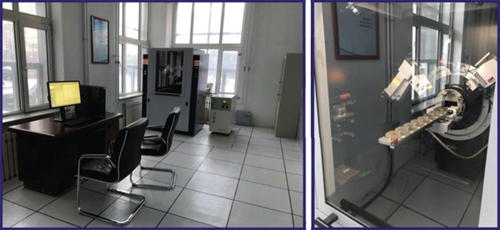
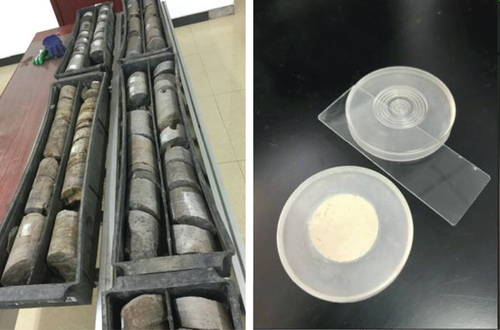
In this paper, the microarea mineral composition diffraction test is carried out by D8-ADVANCE X-ray diffractometer, as shown in Figure 8. This machine is produced by BRUKED-AXS Co. Ltd. of Germany, which is one of the most advanced X-ray diffractometer systems in the world. Its high-precision goniometer can satisfy the error of measuring peak position of any diffraction peaks in the whole spectrum range with the standard peak position not exceeding 0.01 degrees. The test cores are taken from layer B in block A in Liaohe Oilfield, with a total of 22 cores, as shown in Figure 9.
Firstly, mechanical parameters such as the elastic modulus and Poisson’s ratio of test cores are measured by simulating the actual stress of the formation through the triaxial compressive test, and the mineral compositions of test cores are analyzed by an X-ray diffractometer. The specific data obtained are shown in Table 1.
| Serial number | The type and content of minerals | Clay minerals | Elastic modulus (GPa) | Poisson’s ratio | |||||||
|---|---|---|---|---|---|---|---|---|---|---|---|
| Quartz | Potassium feldspar | Plagioclase | Calcite | Dolomite | Analcite | Siderite | Pyrite | ||||
| 1 | 0.203 | 0.031 | 0.168 | 0.033 | 0.202 | 0.132 | 0.021 | 0.025 | 0.185 | 29.23 | 0.285 |
| 2 | 0.197 | 0.036 | 0.073 | 0.089 | 0.095 | 0.291 | 0.018 | 0.019 | 0.182 | 31.79 | 0.278 |
| 3 | 0.148 | 0.038 | 0.166 | 0.044 | 0.217 | 0.121 | 0.014 | 0.028 | 0.224 | 24.65 | 0.307 |
| 4 | 0.289 | 0.032 | 0.138 | 0 | 0.248 | 0.089 | 0 | 0 | 0.204 | 26.98 | 0.271 |
| 5 | 0.211 | 0.04 | 0.159 | 0.052 | 0.151 | 0.136 | 0.015 | 0.02 | 0.216 | 26.74 | 0.283 |
| 6 | 0.195 | 0.037 | 0.165 | 0.011 | 0.214 | 0.14 | 0 | 0 | 0.238 | 24.88 | 0.288 |
| 7 | 0.177 | 0.054 | 0.273 | 0 | 0.153 | 0.033 | 0 | 0.015 | 0.295 | 21.56 | 0.281 |
| 8 | 0.096 | 0.043 | 0.125 | 0 | 0.116 | 0.341 | 0.075 | 0.032 | 0.172 | 22.56 | 0.274 |
| 9 | 0.106 | 0.07 | 0.117 | 0.02 | 0.267 | 0.16 | 0.03 | 0.018 | 0.212 | 26.27 | 0.274 |
| 10 | 0.12 | 0.073 | 0.242 | 0.11 | 0.18 | 0.05 | 0.013 | 0.024 | 0.188 | 21.93 | 0.297 |
| 11 | 0.203 | 0.071 | 0.169 | 0.024 | 0.073 | 0.182 | 0.056 | 0 | 0.222 | 22.1 | 0.28 |
| 12 | 0.218 | 0.027 | 0.114 | 0.011 | 0.313 | 0.109 | 0.101 | 0 | 0.107 | 29.53 | 0.271 |
| 13 | 0.251 | 0.103 | 0.164 | 0 | 0.189 | 0.04 | 0.087 | 0.03 | 0.136 | 31.63 | 0.268 |
| 14 | 0.196 | 0.065 | 0.096 | 0.02 | 0.139 | 0.309 | 0 | 0 | 0.175 | 30 | 0.271 |
| 15 | 0.124 | 0.058 | 0.063 | 0.017 | 0.054 | 0.429 | 0.019 | 0 | 0.236 | 28.84 | 0.279 |
| 16 | 0.131 | 0.148 | 0.21 | 0.039 | 0.256 | 0.028 | 0.017 | 0.042 | 0.129 | 29.53 | 0.281 |
| 17 | 0.068 | 0.144 | 0.316 | 0.037 | 0.245 | 0 | 0.022 | 0.015 | 0.153 | 26.28 | 0.289 |
| 18 | 0.122 | 0.067 | 0.375 | 0.019 | 0.177 | 0.048 | 0.031 | 0 | 0.161 | 28.6 | 0.273 |
| 19 | 0.095 | 0.101 | 0.113 | 0.036 | 0.359 | 0.045 | 0.016 | 0.027 | 0.208 | 23.49 | 0.312 |
| 20 | 0.125 | 0.12 | 0.192 | 0.144 | 0.141 | 0.095 | 0.013 | 0.046 | 0.124 | 25.21 | 0.272 |
| 21 | 0.198 | 0.059 | 0.103 | 0.15 | 0.108 | 0.168 | 0.048 | 0 | 0.166 | 21.42 | 0.274 |
| 22 | 0.061 | 0.084 | 0.458 | 0.034 | 0.137 | 0.017 | 0.049 | 0 | 0.16 | 22.53 | 0.284 |
According to the data analysis, the core samples taken in block A of Liaohe Oilfield are mainly composed of quartz, potassium feldspar, plagioclase, dolomite, and clay minerals. Some cores contain calcite, analcite, siderite and pyrite, and others are too low to be considered in this paper. The core elastic modulus is in the range of [21.42, 31.79] and the Poisson’s ratio is in the range of [0.268, 0.312].
Through stepwise regression analysis, the initial correlation coefficient matrix R among elastic modulus, Poisson’s ratio, and mineral contents are calculated as shown in Table 2.
| R = | 1 | -0.50037 | -0.45817 | -0.13212 | -0.05214 | 0.09481 | 0.05809 | -0.24719 | 0.08393 | 0.35372 | -0.39678 |
| -0.50037 | 1 | 0.36313 | 0.19435 | 0.19137 | -0.45001 | -0.03055 | 0.44192 | -0.41878 | 0.00199 | 0.090176 | |
| -0.45817 | 0.36313 | 1 | -0.05867 | 0.01911 | -0.65828 | -0.02337 | -0.07040 | -0.12159 | -0.27625 | 0.110721 | |
| -0.13212 | 0.19435 | -0.05867 | 1 | -0.24949 | -0.04570 | -0.15995 | 0.27187 | -0.27396 | -0.23883 | 0.098718 | |
| -0.05214 | 0.19137 | 0.01911 | -0.24949 | 1 | -0.57396 | -0.00198 | 0.19780 | -0.19621 | 0.11737 | 0.3602 | |
| 0.09481 | -0.45001 | -0.65828 | -0.04570 | -0.57396 | 1 | 0.02244 | -0.20717 | 0.20291 | 0.19098 | -0.27216 | |
| 0.05809 | -0.03055 | -0.02337 | -0.15995 | -0.00198 | 0.02244 | 1 | -0.05565 | -0.52406 | 0.06922 | -0.36284 | |
| -0.24719 | 0.44192 | -0.07040 | 0.27187 | 0.19780 | -0.20717 | -0.05565 | 1 | -0.24243 | 0.05379 | 0.230505 | |
| 0.08393 | -0.41878 | -0.12159 | -0.27396 | -0.19621 | 0.20291 | -0.52406 | -0.24243 | 1 | -0.39416 | 0.357259 | |
| 0.35372 | 0.00199 | -0.27625 | -0.23883 | 0.11737 | 0.19098 | 0.06922 | 0.05379 | -0.39416 | 1 | / | |
| -0.39678 | 0.090176 | 0.110721 | 0.098718 | 0.3602 | -0.27216 | -0.36284 | 0.230505 | 0.357259 | / | 1 |
The critical threshold of the model is mainly related to reliability and free degree, so the screening limit should not be too large; otherwise, the introduction of fewer variables will make the model impractical. In this paper, four parameters are introduced to establish the regression model, and the critical threshold is . From the F distribution table, we can see that .
According to the stepwise regression analysis, the process of quoted and eliminating parameters of core elasticity modulus and Poisson’s ratio by inversion compact transformation method and bidirectional test method is shown in Table 3.
| Introduced variables | Elastic modulus E | Poisson’s ratio ν | ||||||||
|---|---|---|---|---|---|---|---|---|---|---|
| umax | Fin | umin | Fout | Results | umax | Fin | umin | Fout | Results | |
| First variable | 0.155 | 3.679 | Clay minerals in | 0.157 | 3.737 | Quartz in | ||||
| Second variable | 0.151 | 4.126 | Quartz in | 0.154 | 4.237 | Clay minerals in | ||||
| Third variable | 0.101 | 3.081 | 0.181 | 4.954 | Calcite in | 0.179 | 6..334 | 0.183 | 5.059 | Dolomite in |
| Fourth variable | 0.121 | 4.377 | 0.122 | 3.708 | Siderite in | 0.098 | 4.043 | 0.170 | 6.011 | Calcite in |
| Fifth variable | 0.099 | 4.253 | 0.143 | 5.144 | Analcite in | 0..008 | 0.314 | 0.135 | 5.572 | End of regression |
| Sixth variable | 0.013 | 0.530 | 0.126 | 4.467 | End of regression | |||||
After the influence parameters of the core elastic modulus and Poisson’s ratio are quoted and eliminated for many times, the regression coefficients of the elastic modulus and Poisson’s ratio are calculated by formulas (10) and (11), as shown in Table 4.
| Regression coefficient | Elastic modulus E | Poisson’s ratio ν |
|---|---|---|
| Initial coefficient | 37.6374 | 0.2472 |
| Quartz | 20.1992 | -0.0714 |
| Potassium feldspar | 0 | 0 |
| Plagioclase | 0 | 0 |
| Calcite | -38.5568 | 0.0911 |
| Dolomite | 0 | 0.0813 |
| Analcite | 9.5781 | 0 |
| Siderite | -60.0874 | 0 |
| Pyrite | 0 | 0 |
| Clay minerals | -68.1563 | 0.154 |
According to the stepwise regression analysis, the main factors affecting the rock elastic modulus under simulated confining pressure include the contents of quartz, calcite, analcite, siderite, and clay minerals. And the main factors affecting rock Poisson’s ratio include the contents of quartz, calcite, dolomite, and clay minerals. Among them, the content of quartz and analcite is positively correlated with the rock elastic modulus and the content of calcite, siderite, and clay minerals is negatively correlated with the rock elastic modulus. The content of calcite, dolomite, and clay minerals is positively correlated with rock Poisson’s ratio, and the content of quartz is negatively correlated with rock Poisson’s ratio.
The regression equations are tested and analyzed by significance test and R2. The calculation by formula (12) shows that and . And the R2 of the elastic modulus and Poisson’s ratio are 0.913 and 0.936. This shows that the regression equations of the rock elastic modulus and Poisson’s ratio are significant, and the linear relationships between rock mechanical parameters and mineral compositions are highly accurate, which can be used as an effective result.
Formula (15) is the rock local brittleness evaluation model in Block A of Liaohe Oilfield. This model quantitatively establishes the relationship between the mineral composition in rock and the local brittleness, taking into account the actual reservoir environment and the influence of different mineral components on the development of natural fractures.
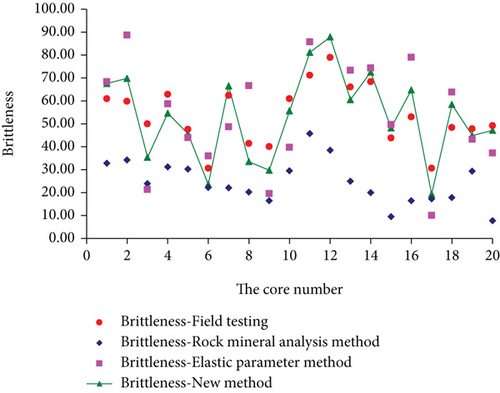
As shown in Figure 10, it can be found that the brittleness trend of different calculation methods is basically the same, which compared the rock brittleness calculated by mineral composition analysis method, elastic parameter method, and the new method. However, the rock mineral analysis method lacks quantitative characterization of mineral composition, and its calculated brittleness index is seriously low, which is quite different from the actual situation in the field. The difference of brittleness variation calculated by the elastic parameter method is large, which leads to great calculation errors. In this paper, the trend of the brittleness index of the new calculation method is the same as that of the elastic parameter method. However, considering the effect of different mineral compositions on reservoir brittleness, the calculation results are more precise and the calculation error of elastic parameter method is reduced. The calculation results are more in line with the actual situation of the study block.
5. Conclusion
- (1)
In this paper, the fracture states of the shale core at different times are observed by CT scanning tests. The results show that with the increase of time, local microfractures are first formed in the core. While the microfractures grow longer, new microfractures are formed elsewhere. Until a large number of microfractures intersect and communicate with each other, eventually leading to core instability and fracture. Therefore, it can be seen that the rock macrofractures are the appearance of local fractures after reaching a certain degree, and the local fractures are the fundamental cause of macrofractures
- (2)
The stepwise regression analysis method is used to quantitatively analyze the relationships between the rock elastic modulus, Poisson’s ratio, and rock mineral compositions combined with the environment of the Liaohe Oilfield actual reservoir, which is the basis of establishing the characterization method of local shale brittleness. A new method for characterizing shale brittleness by rock mineral compositions is established in combination with the elastic parameter method, thus realizing the characterization of local brittleness of the discrete core. This method is scientific and representative and can describe the change rule of rock local brittleness accurately
- (3)
The results show that quartz, calcite, siderite, analcite, and clay minerals are the main influencing factors of the rock elastic modulus. Dolomite, calcite, quartz, and clay minerals are the main influencing factors of Poisson’s ratio. Among them, quartz and analcite have a positive correlation with the elastic modulus, and calcite, dolomite, and clay minerals have a positive correlation with Poisson’s ratio. Other minerals have negative correlations
- (4)
It can be seen from the comparative analysis that the new method of the local brittleness index characterizes the change rule of rock brittleness from the microcosmic point of view, and the results are the same as those of the elastic parameter method. It can precisely quantify the influence of different mineral components on the reservoir brittleness, reduce the calculation errors of elastic parameter method, and avoid the low calculation results of the rock mineral analysis method. The results are more in line with the actual situation of the study block
Conflicts of Interest
The authors declare that they have no conflicts of interest.
Acknowledgments
This research was supported by the Talented Reserves of Heilongjiang Province Science Foundation for Distinguished Young Scholars of Northeast Petroleum University (SJQHB201802), National Natural Science Foundation of China (Grant Nos. 51404073 and 51574088), Natural Science Foundation of Heilongjiang Province of China (Young Scientists) (Grant No. QC2017043), 9th special China Postdoctoral Science Foundation projects (Grant No. 2016T90268), Heilongjiang Postdoctoral Foundation (LBH-TZ-0503), China Postdoctoral Science Foundation (Grant No. 2018M630335), Heilongjiang General Undergraduate Colleges and Universities Young Innovative Talents Training Plan (Grant No. UNPYSCT-2016084), and Key Young Project of Northeast Petroleum University “National Foundation” Cultivating foundation (Science) 2017.
Open Research
Data Availability
The data used to support the findings of this study are available from the corresponding author upon request.


