Antiviral Effect of Hyunggaeyungyo-Tang on A549 Cells Infected with Human Coronavirus
Abstract
Background. Herbal medicine is widely recommended to treat viral infectious diseases. Over 123,000,000 individuals have been infected with the coronavirus since a worldwide pandemic was declared in March 2020. We conducted this research to confirm the potential of herbal medicine as a treatment for coronavirus. Methods. We infected the A549 cell line with betacoronavirus OC43 and then treated it with 100 μg/mL Hyunggaeyungyo-tang (HGYGT) or distilled water with a control of HGYGT. We measured the mRNA expression levels of proinflammatory cytokines and interferon stimulated genes (ISGs) to confirm the effectiveness of HGYGT upon coronavirus infection. Results. We found that the effects of HYGYT decrease the expression level of pPKR, peIF2α, IFI6, IFI44, IFI44L, IFI27, IRF7, OASL, and ISG15 when administered to cells with coronavirus infection. The expressions of IL-1, TNF-α, COX-2, NF-κB, iNOS, and IKK mRNA were also significantly decreased in the HGYGT group than in the control group. Conclusion. Through the reduction of the amount of coronavirus RNA, our research indicates that HGYGT has antiviral effects. The reduction of IKK and iNOS mRNA levels indicate that HGYGT reduces coronavirus RNA expression and may inhibit the replication of coronavirus by acting on NF-kB/Rel pathways to protect oxidative injury. In addition, decreases in mRNA expression levels of proinflammatory cytokines indicate that the HGYGT may relieve the symptoms of coronavirus infections.
1. Introduction
The number of infectious diseases caused by coronaviruses has recently increased. The severe acute respiratory syndrome coronavirus 1 (SARS-CoV-1) led to a pandemic in 2002, the Middle East respiratory syndrome (MERS)-CoV in 2012, and the SARS-CoV-2 in 2019. Coronaviruses are divided into four types: alpha, beta, gamma, and delta. Human CoV (HCoV) belongs to the genera Alphacoronavirus and Betacoronavirus. Types 229E and NL63 are Alphacoronaviruses. OC43, HKU1, SAR-CoV-1, MER-CoV, and SAR-CoV-2 are Betacoronaviruses. A novel CoV (2019-nCoV; SAR-CoV-2), identified in January 2020, resulted in respiratory symptoms and had spread worldwide. The recent coronavirus infection, named coronavirus disease 2019 (COVID-19) by the World Health Organization, has led to a global pandemic.
The COVID-19 Korean Medicine Treatment Recommendation, written based on the National Health Commission of the People’s Republic of China’s treatment plan, recommends herbal medicine treatment at the appropriate time. Some guidelines recommend that uninsured herbal extracts are administered for symptomatic relief. However, in Korea, uninsured herbal extracts are generally perceived to be ineffective compared with packed herbal medicines. Therefore, we determined the effectiveness of an uninsured herbal extract for the treatment of COVID-19.
Hyunggaeyungyo-tang (HGYGT) is an herbal medicine composed of 13 herbs (Table 1). HGYGT is widely prescribed in patients with anhidrosis, excessive thirst, excessive sputum, fever, or sore throat. It has been reported that 88% of patients with COVID-19 had fever, 65% had dyspnea, and 60% had a cough [1]. HGYGT is prescribed for these symptoms. We confirmed the antiviral effect of HGYGT using a cell line infected with OC43, a relatively safe Betacoronavirus.
| Scientific name | Amount (g) |
|---|---|
| Schizonepeta tenuifolia Briquet (KP) | 0.5 |
| Scutellaria baicalensis Georgi (KP) | 0.5 |
| Saposhnikovia divaricata Schischkin (KP) | 0.5 |
| Angelica gigas Nakai (KP) | 0.5 |
| Poncirus trifoliata Rafinesque (KP) | 0.5 |
| Paeonia lactiflora Pallas (KP) | 0.5 |
| Glycyrrhiza uralensis Fischer (KP) | 0.5 |
| Cnidium officinale Makino (KP) | 0.5 |
| Angelica dahurica Bentham et Hooker f (KP) | 0.83 |
| Gardenia jasminoides Ellis (KP) | 0.5 |
| Platycodon grandiflorum A. De Candolle (KP) | 0.83 |
| Forsythia suspensa Vahl (KP) | 0.5 |
| Bupleurum falcatum Linné (KP) | 0.83 |
- HGYGT: Hyunggaeyungyo-tang; KP: Korean Pharmacopeia.
Protein kinase RNA-activated (PKR) is one of four mammalian serine-threonine kinases that primarily react to double-stranded RNA (dsRNA) during a viral infection and phosphorylate the eukaryotic initiation factor 2α (eIF2α) translation initiator. The phosphorylation of eIF2α inhibits the translation of viral mRNAs, ceasing viral replication [2]. In addition, dsRNA is a potent inducer of type I IFN, which produces interferon stimulated genes (ISGs) and forms a protective antiviral state [3]. Virus infection produces reactive oxygen specifications (ROS), which causes virus replication and oxidative injury. [4] We identified the presence of immune-related proteins such as PKR, phosphorylated PKR(pPKR), eIF2, and phosphorylated eIF2α (peIF2α) using immunocytochemistry and measured the expression of proinflammatory cytokines and ISGs to confirm and understand the antiviral effects of HGYGT in A549 cells infected with human coronaviruses.
2. Materials and Methods
2.1. Reagents and Instruments
The HGYGT used in this experiment was purchased from Hanpoong Pharm. (Jeonju, Korea). The amount of HGYGT’s validity was calculated to control the concentration of the active ingredient. HGYGT was diluted with physiological saline to 100 μg/mL.
The reagents used are TRIsure (Bioline, England), SYBR (Bioline, England), reverse transcriptase (Thermo Fisher Scientific, USA), dNTP (Takara, Japan), DNase (Takara, Japan), RNase inhibitor (Takara, Japan), protease inhibitor (Takara, Japan), primary antibody (Cell Signaling Technology, USA), secondary antibody (Thermo Fisher Scientific, USA), sodium acetate (Invitrogen, USA), and ethanol (Sigma, Germany).
The devices used are RT-PCR (Thermo Fisher Scientific, USA), microreader (Thermo Fisher Scientific, USA), PCR machine (Thermo Fisher Scientific, USA), and ChemiDoc (Thermo Fisher Scientific, USA).
2.2. Cell Culture
A549 cells (Korean Cell Line Bank, Korea) were cultured in RPMI medium (Welgene, Korea) and 10% fetal bovine growth serum (RMbio, USA). The cells were cultured at 37°C in a humidified atmosphere containing 5% CO2.
2.3. Virus Infection
OC43 (1.0 MOI) was added to 5 × 10⁵ A549 cells, and the cells were incubated for three days. Cells were then treated with HGYGT (100 μg/mL) or deionized, distilled water (DW). The cells were cultured for 72 h prior to RNA extraction.
2.4. SRB Viability Assay
Two days after drug treatment, the cells were fixed during 1 hr with 10% TCA solution, washed twice with DPBS, and dried at room temperature. The cells were stained with a 0.05% SRB solution. The stained cells were washed four times with 1% acetic acid and dried at room temperature. After washing four times with DPBS, the cells were then reconstituted 1 hr at room temperature using 10 mM Tris (pH = 10.5). The supernatant of Tris washed samples are analyzed with a microplate reader at an absorbance of 510 nm.
2.5. RNA Extraction
The total RNA was extracted using TRIsure (Bioline, England). Prepared cells were distributed into an 8 pi medium consisting of 1 × 10⁶ cells on 100 pi plates. A549-OC43 cells (OC43 group) and A549-OC43 cells treated with HGYGT (HGYGT group) were cultured for 72 h. All prepared groups were incubated for 5 min at room temperature before treatment with 1 mL of TRIsure per 5 × 10⁵ cells. The lysate was passed several times with a pipette tip. After incubation for 5 min at room temperature, chloroform was added, and the mixture was vortexed for 15 min and then centrifuged for 1 h at 15,000 rpm. After the supernatant was discarded, the pellet was blended with cold isopropyl alcohol to precipitate the RNA. The sample was incubated at room temperature for 10 min and centrifuged at 12,000 rpm at 4°C for 10 min. The pellet was washed using 75% ethanol, air-dried, and dissolved in PCR water. To remove the genetic DNA, purified nucleic acids were treated with DNA enzyme I (Takara, Japan). RNA was reverse-transcribed using RevertAid reverse transcriptase (Thermo Fisher Scientific, USA). The sample was centrifuged for 10 min at 12,000 rpm and room temperature, and the supernatant was discarded. After it was washed twice with 75% ethanol and dried, the pellet was dissolved in DW.
2.6. cDNA Synthesis and RT-PCR
For reverse transcription (RT) reactions, PCR was performed with 800 ng of total RNA prepared with 1 μL of random primer. The sample was denatured at 65°C for 5 min, and then, the temperature dropped to 4°C before 4 μL of a 10 mM dNTP mixture and 1 μL of reverse transcriptase were added with 1 μL RNase inhibitor (20 U/μL) and 4 μL 5 × RT buffer (250 mM Tris-HCl, pH = 8.3, 375 mM KCl, and 15 mM MgCl2). PCR was performed at 25°C for 10 min, at 42.5°C for 60 min, and at 70°C for 10 min. RT-PCR (Bio-Rad, USA) was performed using synthesized cDNA, forward/reverse primers, and SensiFAST SYBR Lo-Rox Kit (Bioline, England). The sequences of primers used in the experiment are presented in Table 2. The forward/reverse primer mixture (2 μL at 3 μM) was combined with 7.5 μL SYBR, 4.5 μL DW, and 1 μL cDNA. In addition, predenaturation was performed for 40 cycles at 5 min each at 95°C, 40 cycles at 95°C, and 1 min at 60°C. The Cq values were calculated.
| Target gene | Primer | Nucleic acid sequence |
|---|---|---|
| OC43 | Forward | 5′-AGC AAC CAG GCT GAT GTC AAT ACC-3 |
| Reverse | 5′-AGC AGA CCT TCC TGA GCC TTC AAT-3 | |
| IL-1 | Forward | 5′-CCA CAG ACC TTC CAG GAG AAT G-3′ |
| Reverse | 5′-GTG CAG TTC AGT GAT CGT ACA GG-3′ | |
| TNF-α | Forward | 5′-CTC TTC TGC CTG CTG CAC TTT G-3′ |
| Reverse | 5′-ATG GGC TAC AGG CTT GTC ACT C-3′ | |
| COX-2 | Forward | 5′-TCC AAA TGA GAT TGT GGG AAA ATT GCT-3′ |
| Reverse | 5′-AGA TCA TCT CTG CCT GAG TAT CTT-3′ | |
| NF-κB | Forward | 5′-GCA GCA CTA CTT CTT GAC CAC C-3′ |
| Reverse | 5′-TCT GCT CCT GAG CAT TGA CGT C-3′ | |
| IFI6 | Forward | 5′-TGC TAC CTG CTG CTC TTC AC-3′ |
| Reverse | 5′-CGA GCT CTC CGA GCA CTT TT-3′ | |
| IFI44 | Forward | 5′-CTG ATT ACA AAA GAA GAC ATG ACA GAC-3′ |
| Reverse | 5′-AGG CAA AAC CAA AGA CTC CA-3′ | |
| IFI44L | Forward | 5′-GTG GAT GAT TGC AGT GAG GTT-3′ |
| Reverse | 5′-AAT ATC CTT CAT GGG GTC CAG-3′ | |
| IFI27 | Forward | 5′-ATC AGC AGT GAC CAG TGT GG-3′ |
| Reverse | 5′-TGG CCA CAA CTC CTC CAA TC-3′ | |
| IRF7 | Forward | 5′-CTG TGG ACA CCT GTG ACA CC-3′ |
| Reverse | 5′-TGC CCT CTC AGG AGC CAA-3′ | |
| OASL | Forward | 5′-GCG GAG CCC ATC ACG GTC AC-3′ |
| Reverse | 5′-AGG ACC ACC GCA GGC CTT GA-3′ | |
| ISG15 | Forward | 5′-CTC TGA GCA TCC TGG TGA GGA A-3′ |
| Reverse | 5′-AAG GTC AGC CAG AAC AGG TCG T-3′ | |
| IKK | Forward | 5′-CCA CCC AGT TCC ACA AGT CT-3′ |
| Reverse | 5′-CCT CCA CTG CGA ATA GCT TC-3′ | |
| iNOS | Forward | 5′-AGA CTG GAT TTG GCT GGT CCC TCC-3′ |
| Reverse | 5′-AGA ACT GAG GGT ACA TGC TGG AGC C-3′ | |
2.7. Immunocytochemistry
The cells were washed twice with PBS and fixed in 4% paraformaldehyde for 15 min at room temperature. Then, the cells were permeabilized with 0.1% Triton X-100 in BSA buffer and blocked for 1 h at room temperature. Cells were incubated with primary antibodies diluted with 1% BSA for 2 h and then washed four times with 0.1% (v/v) Tween-20 in PBS and incubated with Alexa Fluor-conjugated secondary antibodies. The cells were imaged using a Zeiss LSM 760 confocal microscope with a C-Apochromat 20x objective lens (NA = 1.40). PKR and pPKR primary antibodies were purchased from Santa Cruz Biotechnology; eIF2α and peIF2α antibodies were obtained from Cell Signaling Technology.
2.8. Statistical Analysis
Variables are expressed as mean ± SEM. Unpaired one-tailed Student’s t-tests were used to compare the data. Statistical significance was set at p < 0.05.
3. Results
3.1. OC43 mRNA Expression
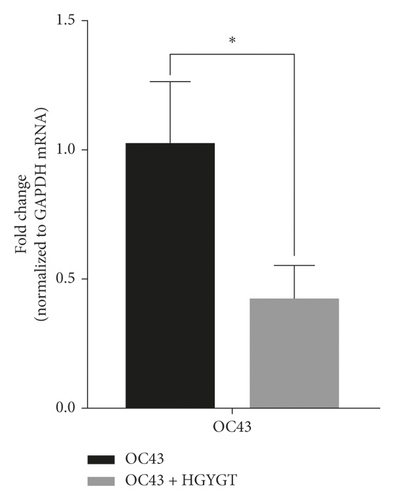
The OC43 mRNA expression was significantly higher in the OC43 group (1.019 ± 0.1413) than in the HGYGT group (0.4205 ± 0.07611) (p < 0.05) (Table 3; Figure 1).
| mRNA | Expression in control group | Expression in OC43 group (p value vs. control) | Expression in HGYGT group (p value vs. OC43) |
|---|---|---|---|
| OC43 | 1.019 ± 0.1413 |
|
|
| IL-1 | 1.002 ± 0.04936 |
|
|
| TNF-α | 1.054 ± 0.2352 |
|
|
| COX-2 | 1.021 ± 0.1516 |
|
|
| NF-κB | 1.009 ± 0.09722 |
|
|
| IFI6 | 1.026 ± 0.1712 |
|
|
| IFI44 | 1.071 ± 0.2847 |
|
|
| IFI44L | 1.009 ± 0.09376 |
|
|
| IFI27 | 1.002 ± 0.03935 |
|
|
| IRF7 | 1.009 ± 0.09585 |
|
|
| OASL | 1.003 ± 0.05799 |
|
|
| ISG15 | 1.004 ± 0.06054 |
|
|
| IKK | 1.004 ± 0.06449 |
|
|
| INOS | 1.002 ± 0.04371 |
|
|
- Values are presented as mean ± SEM (n = 3) ( ∗p < 0.05; ∗∗p < 0.01; ∗∗∗p < 0.001; ∗∗∗∗p < 0.0001).
3.2. Cell Visualizing
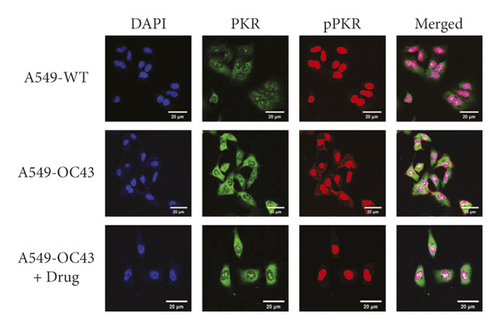
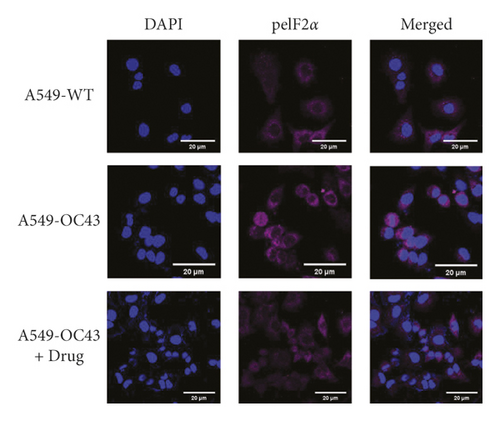
Although the difference was not significant, the expression of PKR was higher in the cells treated with OC43 than cells treated with both OC43 and HGYGT. The expression of pPKR was significantly increased in the cells treated only with OC43 compared with the expression in cells treated with both OC43 and HGYGT. The expression of pPKR in the HGYGT group and uninfected A549 cells was not significantly different (Figure 2). The expression of peIF2α was significantly higher in the control group than in the cells that were infected with OC43 and treated with HGYGT (Figures 3 and 4).

3.3. Cell Viability
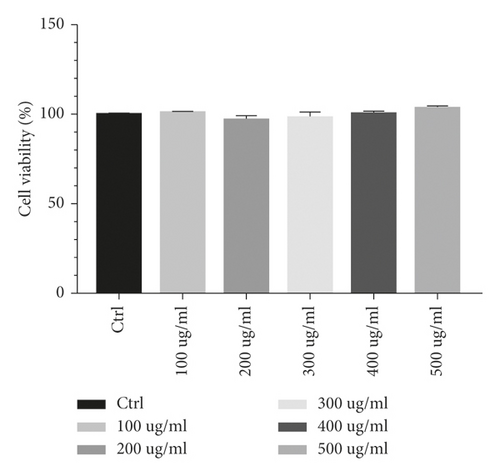
The viabilities of cells treated with 100 μg/mL, 200 μg/mL, 300 μg/mL, 400 μg/mL, and 500 μg/mL HGYGT were 100.891%, 97.4155%, 98.3408%, 100.627%, and 103.914%, respectively. There are no side effects in drug treatment (Figure 5).
3.4. mRNA Expression
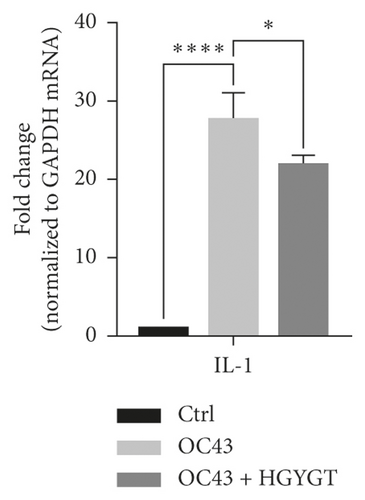
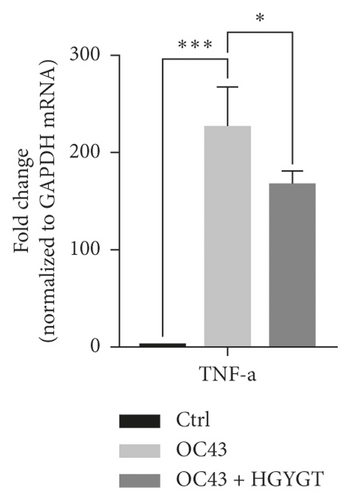
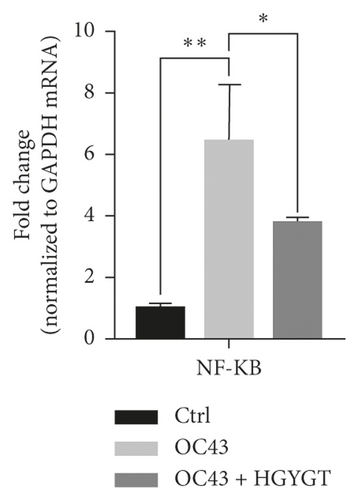
The expressions of interleukin-1 (IL-1), tumor necrosis factor-α (TNF-α), cyclooxygenase-2 (COX-2), and nuclear factor kappa-light-chain-enhancer of activated B cells (NF-κB) mRNA were significantly higher in the OC43 group than in the control group (Table 3; Figure 6). The expressions of IL-1 mRNA (OC43: 27.75 ± 1.868; HGYGT: 21.92 ± 0.6333; p < 0.05), TNF-α mRNA (OC43: 225.8 ± 24.08, HGYGT: 166.7 ± 8.045; p < 0.05), COX-2 mRNA (OC43: 10.89 ± 0.8811; HGYGT: 8.609 ± 0.3086; p < 0.05), and NF-κB mRNA (OC43: 6.482 ± 1.039, HGYGT: 3.807 ± 0.07861; p < 0.05) were significantly higher in cell infected with OC43 than in cells that were infected with OC43 and treated HGYGT (Table 3; Figure 6).

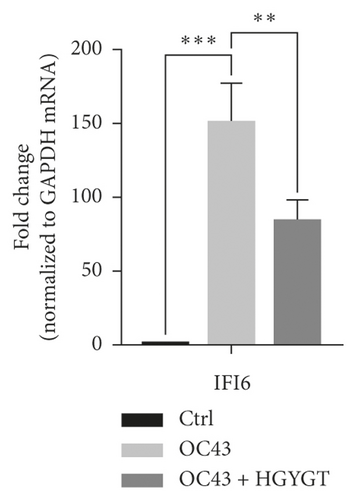
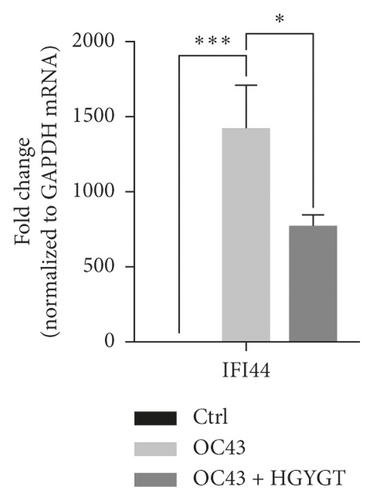
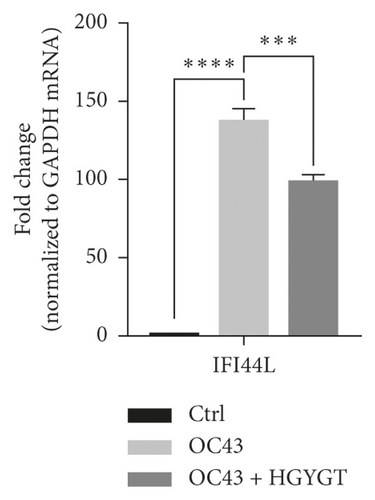
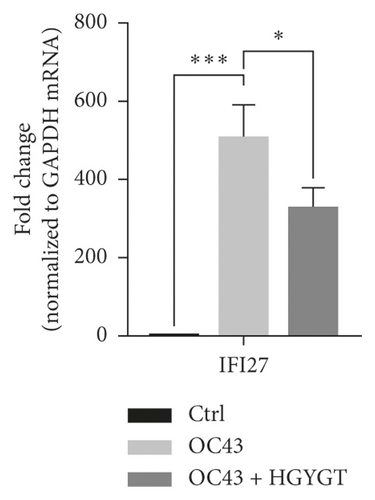
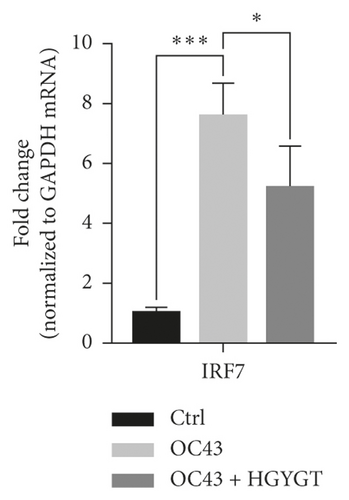
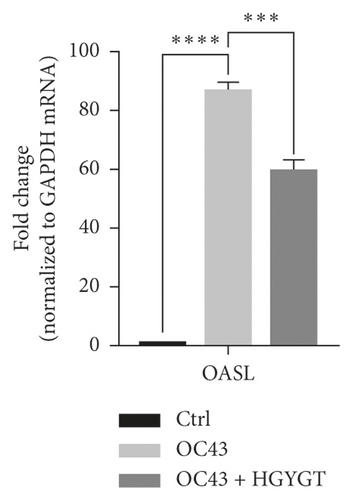
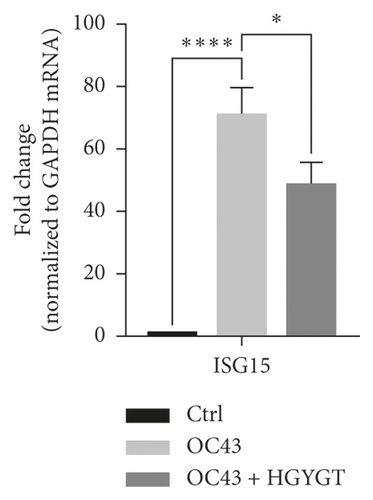
The expressions of Interferon Alpha Inducible Protein 6 (IFI6), IFI44, IFI44L, IFI27, Interferon Regulatory Factor 7 (IRF7), 2′-5′-Oligoadenylate Synthetase Like (OASL), and ISG15 mRNA were significantly higher in the OC43 group than in the control group (Table 3, Figure 7). The expressions of IFI6 mRNA (OC43: 150.5 ± 15.18; HGYGT: 84.61 ± 7.541; p < 0.01), IFI44 mRNA (OC43: 1413 ± 169.2; HGYGT: 761.7 ± 49.3; p < 0.05), IFI44L mRNA (OC43: 137.1 ± 4.453; HGYGT: 98.37 ± 2.426; p < 0.001), IFI27 mRNA (OC43: 506.2 ± 48.8; HGYGT: 328 ± 29.63; p < 0.05), IRF7 mRNA (OC43: 7.599 ± 0.6307; HGYGT: 5.222 ± 0.7767; p < 0.05), OASL mRNA (OC43: 86.96 ± 1.575; HGYGT: 59.74 ± 2.015; p < 0.001), and ISG15 mRNA (OC43: 71.27 ± 4.874; HGYGT: 48.62 ± 4.098; p < 0.05) were significantly higher in cells that were only infected with OC43 than in infected cells treated with HGYGT (Table 3, Figure 7).
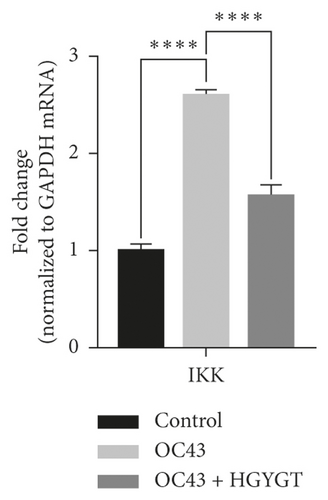
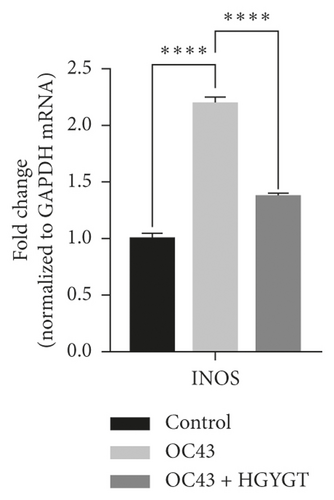
The expressions of IκB kinase (IKK) and inducible nitric oxide synthase (iNOS) mRNA were significantly higher in the OC43 infected cells than in the control group (Table 3, Figure 8). The expressions of IKK mRNA (OC43: 2.6 ± 0.0503 HGYGT: 1.566 ± 0.1109; p < 0.0001) and iNOS mRNA (OC43: 2.195 ± 0.05391; HGYGT: 1.372 ± 0.02985; p < 0.0001) were significantly higher in the OC43-infected cells than in HGYGT-treated infected cells (Table 3, Figure 8).
4. Discussion
In December 2019, a number of pneumonia cases of unknown origin were diagnosed in Wuhan City, Hubei Province, China. From this pneumonia, a coronavirus with new genetic information, which has not yet been identified, was detected [5]. The World Health Organization named the virus SARS-CoV-2 as COVID-19 and declared a global pandemic [6]. From the beginning of the outbreak to March 23, 2021, 123,676,223 patients were infected with the virus worldwide, and 2,722,912 patients died.
SARS-CoV-2 belongs to the Coronaviridae family, Betacoronavirus genus, and Sarbecovirus subgenus. Betacoronaviruses include HCoV-OC43, HCoV-HKU1, SARS-CoV-1, MERS-CoV, and SARS-CoV-2. The SARS-CoV-1 virus infected more than 8,000 people and killed 774 in Guangdong, China from 2002 to 2003. The MERS-CoV virus infected 2,499 people and killed 861 in the Middle East from 2012 to 2019 [7, 8].
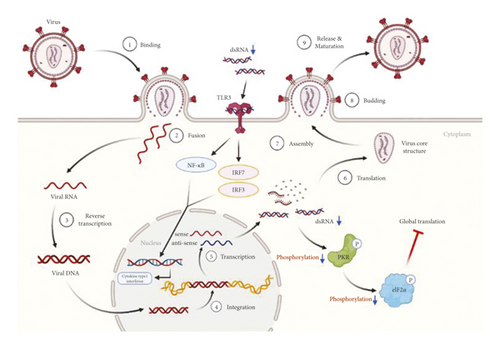
SARS-CoV-2 is a positive-sense single-stranded RNA (ssRNA) virus, enclosed in an 80–220 nm envelope [9]. The virus recognizes a specific protein in the host cell membrane and binds to it, resulting in absorption by the cell. After the virus and the host cell are fused, the uncoated virus RNA invades the host cell. The RNA is replicated using host cell ribosomes and enzymes, and capsids are synthesized. Viruses formed by viral proteases are fused with the host cell membrane and released externally via budding (Figure 9). Antiviral drugs aim to phase out the life cycle of the virus to weaken or extinguish the invading virus by interfering with RNA transcription or inhibiting virus budding [10].
Clinical signs of COVID-19 typically begin within one week after infection and include persistent fever, cough, nasal congestion, fatigue, and other symptoms of upper respiratory infections. Symptoms of the gastrointestinal tract have also been reported, and some cases are asymptomatic [11]. Symptoms may progress to difficulty breathing or extreme chest pain related to pneumonia, decreased oxygen saturation, and physiological changes observed through imaging, such as chest X-ray or CT [12].
According to a study by Son et al. [13], 58.19% of Korean medicine doctors use uninsured herbal extracts. Insured herbal extracts are widely prescribed due to the low cost to patients but differ from packaged herbal medications because they contain extracts of a single herb [14]. For this reason, uninsured herbal extracts, which are most similar to packed herbal medicines, are widely prescribed despite the cost burden of patients. In this study, uninsured herbal extracts were used for standardization and quality control of drugs.
HGYGT is listed in the Man-Byeong-Hoi-Chun of the Ming Dynasty, composed of 13 substances (Table 1). The HGYGT used in this study contains 0.5 g of Schizonepeta tenuifolia Briquet, Scutellaria baicalensis Georgi, Saposhnikovia divaricata Schischkin, Angelica gigas Nakai, Poncirus trifoliata, Rafinesque, Paeonia lactiflora Pallas, Glycyrrhiza uralensis Fischer, Cnidium officinale Makino, Gardenia jasminoides Ellis, Forsythia suspensa Vahl and 0.83 g of Angelica dahurica Bentham et Hooker f, Platycodon grandiflorum A. De Candolle, and Bupleurum falcatum Linné. HGYGT is widely used to treat otolaryngeal diseases, including otitis media [15]. Previous studies regarding HGYGT have reported a genotoxicity evaluation [16], antiallergic effects [17], anti-inflammatory effects through NF-κB activation control [18], antioxidant and anti-inflammatory effects through the reduction of iNOS and cytokine production [19], inhibition of inflammatory cell activation, and improvement of immune control [20].
PKR, also known as eukaryotic translation initiation factor 2-alpha kinase 2 (EIF2AK2), is autophosphorylated by dsRNA in infected cells, leading to an immune response [21]. pPKR is activated to inhibit global translation by preventing the transition of eIF2 to eIF2B [22]. Existing studies have reported that PKR is a signaling sensor for cellular metabolism [2]. The change in pPKR is proportional to the change in dsRNA. In this study, the expression of pPKR decreased as the amount of dsRNA decreased (Figure 2). Decrease of dsRNA expression inhibits the phosphorylation of PKR, thus inhibiting the activation of eIF2α. This reduces global translation and reduces protein synthesis (Figure 9). Recently, it has been reported that SARS-CoV-2 activates pPKR [23]. In this study, we found that HGYGT could block phosphorylation of PKR with a decrease of virus RNA expression. This result signifies that HGYGT could be used as a drug to help treat COVID-19.
We confirmed that IFI6, IFI44, IFI44L, IFI27, IRF7, OASL, and ISG15 mRNA expressions were decreased in cells treated with HGYGT compared with those that were not treated with HGYGT (Figure 7). The reduced expressions of these proteins may affect the inactivation of type I interferon (IFN) pathway (Figure 9). Type 1 IFN pathway is a defense mechanism that induces an innate immune response, and excessive production of IFN-α/β can lead to the development of autoimmune diseases [24]. The reduction of ISGs that involved in type 1 IFN with HGYGT means that it could be used for the treatment of various immune and inflammatory diseases. Previous studies on hepatitis C virus and RNA viruses have reported that IFI44, IFI44L, and IRF7 are involved in translation [25]. In particular, IFI44L has been reported to be directly involved in the IFN response and acts as a regulator of antiviral responses [26]. It has been reported that IFI27 is involved in replication [27] and OASL is involved in translation [25] and replication [28].
SARS-CoV-2 promotes excessive ROS. As ROS increases, H2O2 accumulates in tissues. The increase in ROS level promotes viral replication and causes oxidative inflammation and cell apoptosis due to DNA damage. Recent studies have reported that catalase regulates cytokine in COVID-19, protects oxidative injuries, and inhibits replication of SARS-CoV-2 [29]. Viral infection increases free radicals, including nitrite oxide (NO), and depletes antioxidants [30]. RNA viruses cause oxidative stress, presumably due to the production of ROS in mitochondrial dysfunction, which occurs during virus infection with cells [31]. The production of iNOS involved in the oxidative injury involves activation of NF-kB/Rel [32]. Other studies have reported that inhibiting NF-kB pathways reduces iNOS mRNA and NO synthesis [33]. Both LPS and dsRNA are involved in type 1 IFN production. LPS and dsRNA activates antigen-presenting cells (APCs) via the Toll-like receptor 3 (TLR3) and TLR4 signaling pathway [34]. Previous studies have reported the effect of HGYGT suppressing production of iNOS by reducing NF-kB/Rel in an LPS-induced oxidative injury [35]. Inactivated NF-kB/Rel fails to induce transcription at the NF-kB/Rel bond site in the TATA box of iNOS gene [36]. The expression of iNOS, IKK, and NF-κB was decreased in cells treated with HGYGT compared with those that were not treated with HGYGT (Figure 8). Inflammation with OC43 increases IKK and iNOS mRNA levels in OC43 group. HGYGT reduces IKK activity, and it appears that NF-kB/Rel is inactivated due to reduced IκB phosphorylation, resulting in iNOS expression reduction. The reduction of IKK and iNOS mRNA levels after HGYGT treatment is believed to be likely to reduce levels of dsRNA and replication of coronavirus by acting on NF-kB/Rel pathways to protect oxidative injury.
The results of this study suggest that HGYGT may have antiviral effects. We evaluated the expression of several proteins and mRNAs to determine the mechanism of HGYGT. HGYGT reduces the expression of mRNAs for cytokines, such as IL-1, TNF-α, COX-2, NF-κB, iNOS, and IKK, and the expressions of mRNAs for ISGs involved in the type I IFN pathway, resulting in a decreased immune response and fewer clinical symptoms. We suggest that HGYGT of uninsured herbal extracts manufactured by pharmaceutical companies effectively reduces the virus via regulation in NF-kB/Rel pathways and reduces the symptoms of the coronavirus infection. However, our study is limited due to its in vitro design and an insufficient sample size. More studies, including in vivo and clinical studies, are needed to determine the effects of HGYGT on coronavirus infections. The preprint of this manuscript [37] can be found in https://www.biorxiv.org/content/10.1101/2021.06.02.446680v1.
5. Conclusions
HGYGT reduced the mRNA expression levels of coronavirus and inhibited the phosphorylation of PKR. It reduced mRNA expression level of iNOS and IKK. It means HGYGT may regulate NF-kB/Rel pathways and has an antioxidative effect. HGYGT blocks a series of processes of ISG expression and reduces the inflammatory response in Betacoronavirus-infected A549 cells. Thus, HGYGT acts as a potential therapeutic agent for various clinical symptoms caused by coronavirus.
Abbreviations
-
- APC:
-
- Antigen-presenting cells
-
- COVID-19:
-
- Coronavirus disease 2019
-
- COX-2:
-
- Cyclooxygenase-2
-
- dsRNA:
-
- Double-stranded RNA
-
- eIF2:
-
- Eukaryotic initiation factor 2
-
- EIF2AK2:
-
- Eukaryotic translation initiation factor 2-alpha kinase 2
-
- HCoV:
-
- Human CoV
-
- HGYGT:
-
- Hyeonggae Yeongyo-tang
-
- IFI:
-
- Interferon alpha inducible protein
-
- IFN:
-
- Interferon
-
- IKK:
-
- IκB kinase
-
- IL:
-
- Interleukin
-
- iNOS:
-
- Inducible nitric oxide synthase
-
- IRF:
-
- Interferon regulatory factor
-
- ISGs:
-
- Interferon stimulated genes
-
- MERS:
-
- Middle east respiratory syndrome
-
- NF-κB:
-
- Nuclear factor kappa-light-chain-enhancer of activated B cells
-
- NO:
-
- Nitrite oxide
-
- OASL:
-
- 2′-5′-Oligoadenylate synthetase-like
-
- PKR:
-
- Protein kinase RNA-activated
-
- ROS:
-
- Reactive oxygen species
-
- RT:
-
- Reverse transcription
-
- SARS-CoV:
-
- Severe acute respiratory syndrome coronavirus
-
- ssRNA:
-
- Single-stranded RNA
-
- TLR:
-
- Toll-like receptor
-
- TNF-α:
-
- Tumor necrosis factor-α.
Disclosure
This paper has been submitted under the preprint [37] and can be found at https://www.biorxiv.org/content/10.1101/2021.06.02.446680v1.
Conflicts of Interest
The authors declare that there are no conflicts of interest regarding the publication of this article.
Acknowledgments
The authors are grateful to the experts for their valuable advice.
Open Research
Data Availability
The datasets generated or analyzed in this study are available from the corresponding author upon reasonable request.


