Application of Digital Mining Facing Information Fusion Technology in the Field of National Costume Culture Design
Abstract
In order to improve the design effect of minority clothing, according to the needs of minority clothing design, this paper uses data mining and Internet of Things technologies to construct an intelligent ethnic clothing design system and builds an intelligent clothing design system that meets customer needs based on the idea of human-computer interaction. In data processing, this paper uses the constraint spectrum clustering algorithm to take the Laplacian matrix and the constraint matrix as input and finally outputs a clustering indicator vector to improve the data processing effect of minority clothing design. Finally, this paper verifies the performance of the system designed in this paper through experiments. From the experimental research, it can be known that the minority clothing design system based on the Internet of Things and data mining constructed in this paper has a certain effect and can effectively improve the minority clothing design effect.
1. Introduction
The clothing of each ethnic minority has its own specific patterns. These pattern elements are rich in themes and are colorful, and patterns with different styles have their own unique meaning and a long history. These patterns are the inspirational muse of clothing designers. They not only enrich the style of traditional national clothing, but also bring a lot of inspiration to many designers. Digital clothing design is the application of modern digital technology to the field of clothing, thereby promoting the development of ethnic minority clothing and the inheritance of their national culture [1].
Because the geographical environment and customs of each place are different, the cultural background and the aesthetic angle are also different, which makes the styles of ethnic minority clothing diverse. Among them, dresses, robes, Guantou style, etc. are the main forms. Among them, the headwear is particularly important, and the content is relatively rich. A variety of batik fabrics are used, and a long scarf is wrapped around the head. Because these materials and the ways of matching and presentation are different, the diversification of ethnic clothing presented is also more vivid and concrete. The unique craftsmanship of ethnic clothing is the main reason for the colorful clothing of ethnic minorities [2]. The raw materials used by ethnic minorities to make clothes mainly include plants and animals. Plant raw materials include cotton and linen products, while animal skins and silk products are all animal raw materials. The raw materials in the north are mainly animal skins, while the cotton and linen fabrics of ethnic minorities in the south account for the majority. One of the main ways to show the characteristics of ethnic minority clothing is craftsmanship. This method is often directly used in clothing processing or fabrics, such as batik and carving, and some are in the form of accessories to reflect the characteristics of the nation. What impresses people about ethnic minority clothing is their different shapes and bright colors. Patterns occupy an important position in the clothing of ethnic minorities and can play an affectionate effect, thereby showing the cultural information of ethnic minorities, and most of the patterns are derived from life and nature [3].
This paper combines the Internet of Things and data mining technologies to analyze the elements of minority clothing design and constructs a digital clothing design platform according to the actual needs of clothing design. Moreover, this paper constructs a system structure based on the concept of ethnic minority clothing design to improve the effect of ethnic minority clothing design.
2. Related Work
In foreign countries, the MIRALAB laboratory virtual clothing project established by Nadia Thalmann of the University of Geneva in Switzerland has achieved better results in this field, which mainly involves the development and research of virtual human bodies and virtual worlds. The main work of the British “Center for 3D Electronic Commerce” virtual clothing project [4] is to build a virtual online clothing store. Customers use the Internet to combine the clothing pictures they choose with their own photos to create a realistic effect and make the virtual wearing effect more realistic and three-dimensional and the output effect more realistic. This project provides more convenient conditions for users to buy clothes online, which has also become one of the trends in the commercialization of clothing [5]. There are many cases of exploration and development in the field of virtual clothing display systems and virtual pavilions abroad, such as GERBER in the United States, PAD in Canada, Easter in Germany, INVESTRONIE in Spain [6], and the “e-design” project of Lectra in France. These explorations have provided unprecedented innovative ideas for the development of the apparel industry and opened up new ways for user experience. At the same time, the application of related 3D modeling technology and collision detection technology has also greatly promoted the development of virtual clothing display systems [7]. From another perspective, it is also a further interpretation and analysis of the connotation of clothing. At present, some domestic explorations have also been carried out in related fields.
With the rapid development of digital technology, the organic integration of cultural heritage with it has become a hot spot now. This information revolution centered on digital technology has had a significant impact on many fields such as science and technology, economy, and military, and culture, art, and digital technology are also included. Moreover, the emergence of digital technology not only is conducive to the development of traditional culture but also breaks the relatively closed state of various cultures [8]. In the current cultural heritage protection field, the use of virtual reality technology to display traditional culture has obviously become a trend, and initial results have been achieved in virtual roaming and cultural relic protection at home and abroad [9]. Therefore, how to make full use of digital technology to spread, protect, and develop traditional cultural resources, effectively learn and learn from the experience of predecessors, and better maintain the diversity of human culture will definitely be a major development issue that we need to face together [10].
Literature [11] tried to restore virtual cultural heritage with 3D technology. Some small and medium museums rely on the support of related industries, research institutes, and universities to carry out related research. For example, the “Aquarelle Project” in France can provide network sharing and online browsing services for museums and other related institutions in Europe. The Italian virtual museum implements the reproduction of the ancient city of Pompeii, and the French archaeologist Didier Bussen realized digital Paris with the help of Dassault Systèmes. In addition, Germany has also launched ECHN, the European Cultural Heritage Network, which plays an important role in the digital protection of the European cultural heritage. The “American Memory Project” launched by the Library of Congress digitally integrates relevant documents in the library [12]. The University of Virginia in the United States has launched the virtual ancient Rome system after 10 years [13]. Visitors can observe the exquisite reliefs on the building up close through virtual reality technology and enjoy a realistic sensory experience that the ancients had never had before [14]. The Austrian “Humphrey II” [15] completely reproduces the city of Linz through virtual reality and completes the entire system experience with the hoisted simulated flight controller and three-dimensional display device. The resulting effect is very realistic. That is, when the user is suspended, they can observe the picture in front of his eyes through stereo glasses, conduct multisensory fusion interaction, and obtain a high degree of immersion. In addition, the Netherlands, Germany, Sweden, and other more developed countries in Europe have also actively carried out the research and application of virtual reality technology [16].
3. Cluster Mining Algorithm of Minority Clothing Design
Must-link and cannot-link are introduced to reflect the constraint relationship between data points. Must-link requires that two data sample points must belong to the same class, and this relationship is described as M = {(xi, xj)}. However, cannot-link requires that the two data sample points must not belong to the same class, and this relationship can be described as C = {(xi, xj)} [17].
Both must-link and cannot-link are Boolean functions. In some given column of dataset X, where the data objects xi and xj are known, if xi and xj are similar, then they should be divided into the same class, and must − link(xi, xj) = True. If xi and xj are not similar, then they should be divided into different classes, and cannot − link(xi, xj) = True. Figure 1 shows the role of paired constraint information in the clustering process.
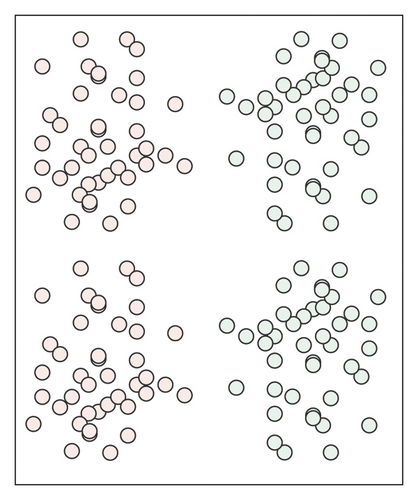
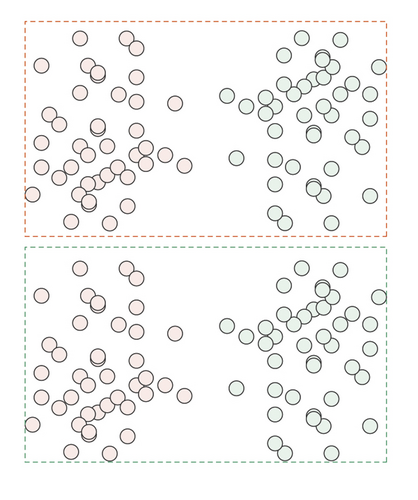
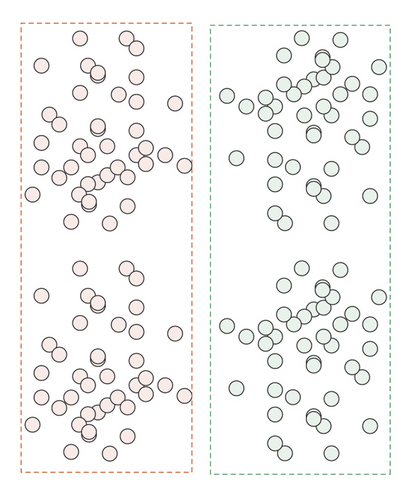
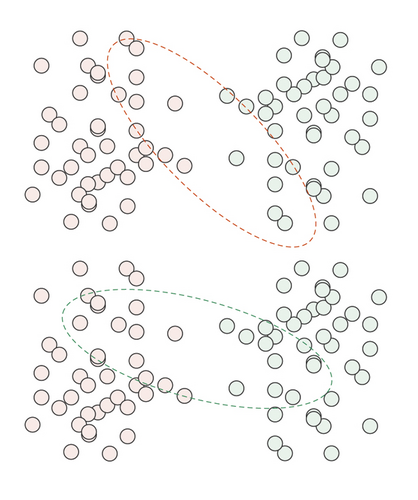
Figure 1(a) shows the data sample set that needs to be clustered, Figure 1(b) shows a clustering situation, but it is the wrong clustering result, and Figure 1(c) shows the correct clustering result. From these three figures, we can draw the following conclusions. Before adding constraint information, the result shown in Figure 1(b) is the wrong clustering result, and adding effective constraints to the dataset can well improve the accuracy of clustering. Figure 1(d) is the added constraint information. Among them, the pair of data points connected by the solid arrow indicates that the two data points must belong to the same category, while the pair of data points connected by the dashed line indicates that the two data points must belong to different categories.
- (1)
Transitivity of must-link and cannot-link: for xi, xj, xk ∈ X,
(1) - (2)
Symmetry of must-link and cannot-link: for xi, xj, xk ∈ X
(2)
The Laplacian matrix of G is L = D − W.
- (1)
Qij > 0 means that sample point i and sample point j should be classified into the same category
- (2)
Oij < 0 means that sample point i and sample point j should be divided into different categories
- (3)
Qij = 0 means that the relationship between sample point i and sample point j is unknown
The constraints are divided into hard constraints and soft constraints. For hard constraints, Qij = 1 means must-link, and Qij = −1 means cannot-link. For soft constraints, the value of Qij indicates the strength of the constraint.
Thus, Q∗ = u∗u∗T, where u∗ ∈ RN is the truth indicator vector. Q is the constraint matrix that has been queried so far. It is conceivable that a nonzero matrix Q is always a subset of the complete matrix Q∗. The goal of this algorithm is to achieve the best results with few constraint queries, that is, to minimize the difference between u = ξ(L, Q) and the truth indicator vector u∗. The algorithm can be summarized into the following three steps.
Step 1. The algorithm initializes the constraint matrix Q0 as an N∗N zero matrix and then uses the constraint spectral clustering algorithm ζ to calculate the current clustering indicator vector u(0). At this time, u(0) should be equivalent to the value calculated by the unconstrained spectral clustering algorithm:
Step 2. After calculating u(0), the algorithm assumes that at time t,
Step 3. The algorithm uses a selection strategy to decide to choose the next item in Q∗. Then, the algorithm can update and iteratively calculate Q(t + 1) from Q(t) by copying the value to and . The constraint matrices here are all symmetric. The update formula is as follows [19]:
Step 3. This step is repeated until the iteration termination condition is reached. The active selection strategy used in Step 3 is random selection. First, the initial constraint matrix Q is an N∗N identity matrix, (I, J) is the set of coordinates at Q(i, j) = 0 in the Q matrix, and tmp is a number randomly selected from the length of I. At this time, i = I(tmp), j = J(tmp), and this paper has calculated a coordinate (i, j), and at this time,
Constrained spectral clustering algorithm adds constraint information on the basis of spectral clustering to form a new type of algorithm. The selected constraint pair is to further enhance the accuracy and efficiency of clustering. Moreover, the constrained spectral clustering algorithm will increase the clustering accuracy as the constrained pairs increase. However, the constrained spectral clustering algorithm is not sensitive to density, that is, when the sample has a large local density, the clustering effect of the traditional constrained spectral clustering algorithm is not very good. In order to overcome this shortcoming, the shared nearest neighbor algorithm is added to the constrained spectral clustering algorithm.
The constrained spectral clustering algorithm takes the Laplacian matrix L and the constrained matrix О as input and finally outputs a clustering indicator vector u. The goal of this algorithm is to use the least constraint query to make u closer to u′, namely [20]:
The previously mentioned algorithm is an optimization problem of Ncut in the relaxed form. The objective function is shown in formula (4); u is the indicator vector, and uTLu is the cost that needs to be minimized. The first constraint uTDu = vol(G) is to normalize the indicator vector u, and the second constraint DU ⊥1 excludes the principal feature vector of L as the simplest solution, because it cannot define a meaningful cut set on the graph G. In this paper, an equivalent objective function is used, and D−1/2v is used instead of u, and then formula (4) becomes
Among them, uTQu > ∂, ∂ ∈ R is a lower limit, and is a measure of the true value rather than satisfying all the constraints given in Q. By replacing u with D−1/2v, the above constraint becomes vTQv > ∂, where is the normalized constraint matrix. The objective function (12) at this time becomes the following objective function [21]:
This paper adds the idea of shared near neighbor, which is a relatively new similarity measurement method, which can adjust the similarity between data points according to its local density. The researchers found that if two points belong to the same cluster, they should be located in the same area and have a relatively high density, and there will be many points that overlap between the two points. In order to express the glued state between these two points, it is represented by Shared Near Neighbor (SNN). SNN (xi, xj) represents the number of neighbors shared by the sample points x and x in the k neighborhood. SNN (xi, xj) reflects the local density of xi and xj points, which helps to divide the sample points correctly. SNN is adapted to local density data. It can be used to improve the similarity between data points. The similarity matrix calculation method in this paper is a combination of SNN algorithm and Gaussian kernel algorithm. The formula is as follows:
Among them, δi and δj are the Euclidean distances from point xi and point xj to their nearest k neighbors, respectively. They can automatically adjust themselves in time according to the sparse or dense distribution between these two points in the specified neighborhood. It can be seen that this algorithm enhances the similarity between the same class, and at the same time weakens the similarity between different classes. Since clusters are datasets in some dense areas, the similarity measurement method based on shared near neighbor can reflect the distribution of sample points in a better way.
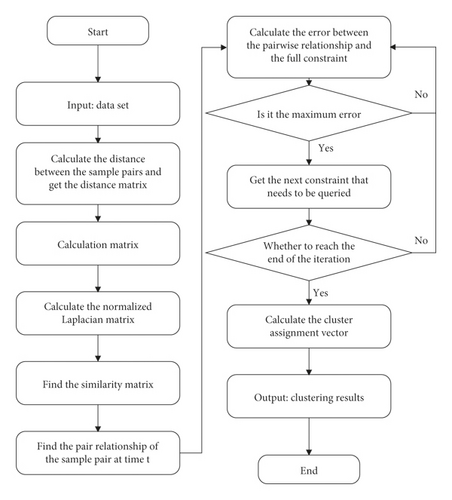
The flowchart of the algorithm is shown in Figure 2.
4. Minority Clothing Design System Based on Internet of Things and Data Mining
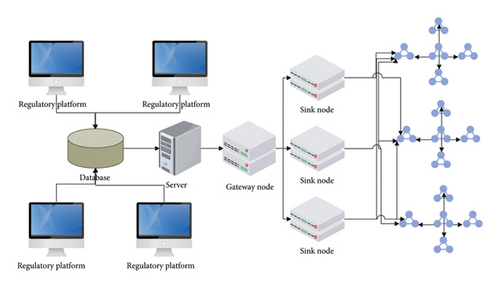
Function division and process design are analyzed from the minority clothing design business. At the entire system level, it not only includes the design of business logic, but also requires the support of the underlying ZigBee transmission network and RFID technology. We complete the overall system framework design of the supervision platform based on the previous investigations. Figure 3 shows the system physical framework diagram.
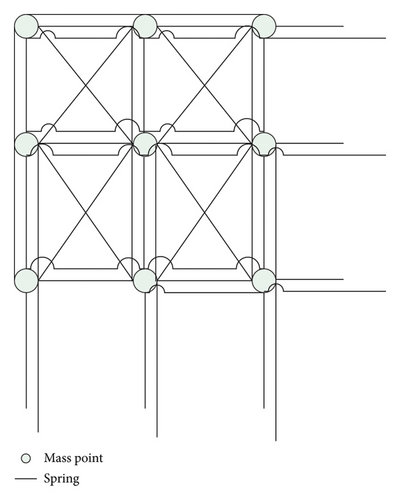
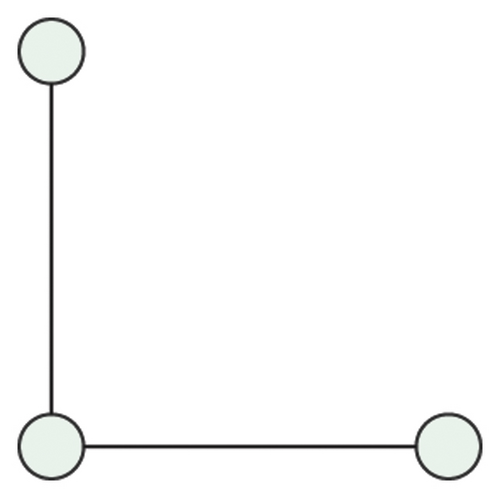
There are many physical simulation methods, and physical simulation is generally performed through finite element analysis. At this time, the garment piece needs to be discretized. This step will directly affect the physical characteristics of the subsequent simulation and the actual display effect. Figures 4 and 5 show the mass point spring model of minority clothing design.
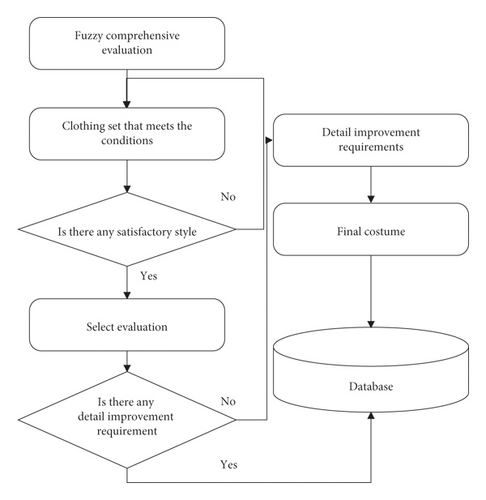
For the selection and evaluation of minority clothing styles, there are mainly two situations. One is that customers can choose from the minority costumes provided by the system to meet their needs. The other is that customers are not satisfied with the ethnic costumes provided by the system and need to search for a collection of ethnic costumes that meet the conditions for recommendation until they are satisfied. At the same time, on the basis of the above, it is necessary to consider whether there is a problem of improving the details of the recommended style (as shown in Figure 6).
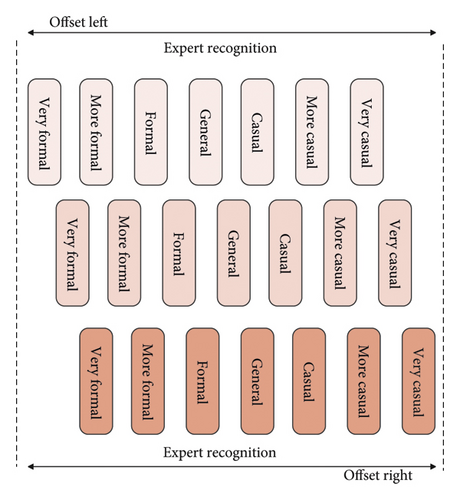
In the second case, the customer cannot find a satisfactory style from the styles recommended by the system. At this time, what we need to know is whether the recommendation of the system is biased and in which direction, as shown in Figure 7.
The system can combine the different needs of users and, according to the expert knowledge stored in the system, recommend a collection of ethnic minority clothing similar to the customer’s needs through the recommendation algorithm to the user. The overall structure of the system is shown in Figure 8.
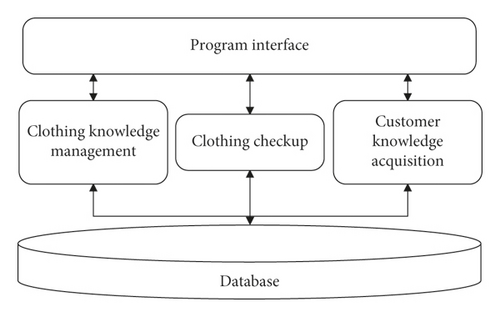
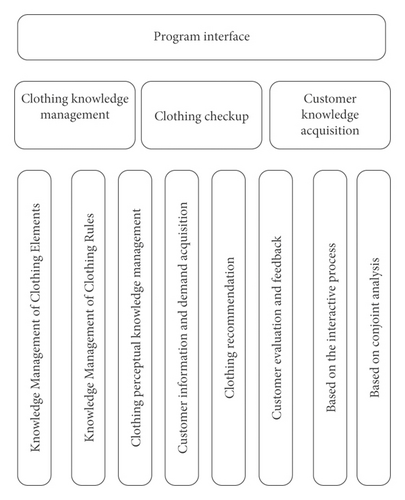
According to the idea of modular design, the above content in the system is expressed in the form of a series of relatively independent modules. As shown in the system software structure diagram in Figure 9, the system is mainly divided into three modules: knowledge management, minority clothing recommendation, and customer knowledge acquisition. Each module is divided into several submodules according to its own characteristics and needs.
After designing the above system, this paper evaluates the effect of minority clothing design on the system in this paper and constructs the system through simulation software. Moreover, this paper uses the expert evaluation method to verify the effect of the system design, count multiple sets of data, and draw the corresponding statistical charts as shown in Table 1 and Figure 10.
| No. | Fashion design |
|---|---|
| 1 | 82.4 |
| 2 | 81.5 |
| 3 | 77.7 |
| 4 | 78.7 |
| 5 | 79.9 |
| 6 | 90.3 |
| 7 | 87.8 |
| 8 | 76.3 |
| 9 | 88.9 |
| 10 | 76.2 |
| 11 | 83.2 |
| 12 | 79.0 |
| 13 | 91.9 |
| 14 | 76.2 |
| 15 | 84.5 |
| 16 | 79.8 |
| 17 | 84.0 |
| 18 | 88.9 |
| 19 | 76.5 |
| 20 | 85.8 |
| 21 | 84.1 |
| 22 | 89.3 |
| 23 | 79.2 |
| 24 | 91.6 |
| 25 | 79.4 |
| 26 | 90.6 |
| 27 | 88.6 |
| 28 | 76.6 |
| 29 | 78.8 |
| 30 | 81.0 |
| 31 | 79.5 |
| 32 | 88.7 |
| 33 | 90.9 |
| 34 | 87.9 |
| 35 | 88.5 |
| 36 | 81.0 |
| 37 | 83.0 |
| 38 | 80.1 |
| 39 | 89.4 |
| 40 | 89.7 |
| 41 | 90.6 |
| 42 | 75.9 |
| 43 | 87.4 |
| 44 | 80.8 |
| 45 | 77.3 |
| 46 | 84.2 |
| 47 | 81.7 |
| 48 | 89.6 |
| 49 | 88.2 |
| 50 | 76.4 |
| 51 | 91.3 |
| 52 | 90.3 |
| 53 | 90.5 |
| 54 | 80.6 |
| 55 | 75.1 |
| 56 | 76.2 |
| 57 | 88.4 |
| 58 | 76.5 |
| 59 | 75.8 |
| 60 | 78.5 |
| 61 | 75.1 |
| 62 | 79.8 |
| 63 | 76.9 |
| 64 | 83.6 |
| 65 | 87.0 |
| 66 | 77.7 |
| 67 | 80.9 |
| 68 | 82.6 |
| 69 | 75.5 |
| 70 | 90.4 |
| 71 | 85.2 |
| 72 | 89.7 |
| 73 | 80.9 |
| 74 | 90.9 |
| 75 | 84.2 |
| 76 | 80.0 |
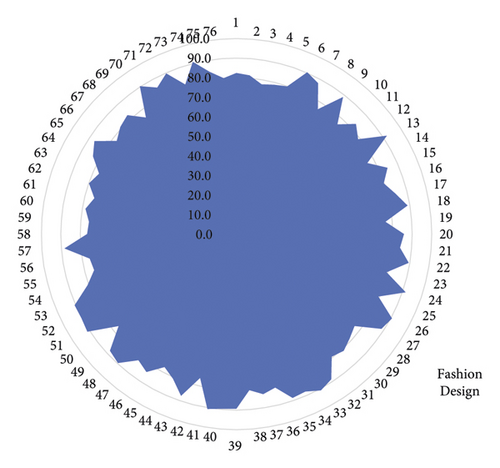
From the above experimental research, we can see that the minority clothing design system based on the Internet of Things and data mining constructed in this paper has a certain effect and can effectively improve the minority clothing design effect.
5. Conclusion
The combination of minority clothing elements and digital clothing design not only meets the requirements and laws of clothing design in the digital age, but also greatly enhances its feasibility and operability. At the same time, the composition of minority clothing elements is relatively complex, including diversified ethnic styles, accessories, ethnic clothing materials, production techniques, and traditional clothing patterns and colors. Therefore, the relevant designers uphold the working principle of seeking truth from facts, increase the emphasis on digital clothing design, and highlight the characteristics of ethnic minority clothing elements and colors. According to the needs of minority clothing design, this paper uses data mining technology and Internet of Things technology to construct an intelligent ethnic clothing design system and builds an intelligent clothing design system that meets customer needs based on the idea of human-computer interaction. Finally, this paper verifies the performance of the system designed in this paper through experiments. From the experimental research, it can be known that the minority clothing design system based on the Internet of Things and data mining constructed in this paper has a certain effect and can effectively improve the minority clothing design effect.
Conflicts of Interest
The authors declare no conflicts of interest.
Acknowledgments
This research was supported by the following: (1) 2018 Guangdong Province “Innovation Strong School Project” Construction Project for Young Innovative Talents: Applied Research on Digital Publicity and Protection of Lingnan Minority Costume Art—A Case Study of She Nationality (2017WQNCX186); (2) 2018 Guangdong Undergraduate Teaching Quality and Teaching Reform Project: Online Open Course Digital Image Processing; and (3) Higher Education Teaching Reform Project (Key Fund): Research and Practice on Teaching Mode of Art Design Major in Colleges and Universities (2020YJJG005).
Open Research
Data Availability
The labeled datasets used to support the findings of this study are available from the corresponding author upon request.


