Analyzing Accident Injury Severity via an Extreme Gradient Boosting (XGBoost) Model
Abstract
Vehicle to vulnerable road user (VRU) crashes occupy a large proportion of traffic crashes in China, and crash injury severity analysis can support traffic managers to understand the implicit rules behind the crashes. Therefore, 554 VRUs-involved crashes are collected from January, 2017, to February, 2021, in a city in northern China, including 322 vehicle-pedestrian crashes and 232 vehicle-bicycle crashes. First, a descriptive statistical analysis is conducted to investigate the characteristics of VRUs-involved crashes. Second, the extreme gradient boosting (XGBoost) model is introduced to identify the importance of risk factors (i.e., time of day, day of week, rushing hour, crash position, weather, and crash involvements) of VRUs-involved crashes. The statistical analysis demonstrates that the risk factors are closely related to VRUs-involved crash injury severity. Moreover, the results of XGBoost reveal that time of day has the greatest impact on VRUs-involved crashes, and crash position shows the minimum importance among these risk factors.
1. Introduction
Crash injury severity analysis plays a crucial role in traffic crash analysis, which can assist traffic management [1–4]. Crash injury severity is defined as the degree of injury and property damage caused by a crash event. The crash injury severity analysis aims to explore the correlation between crash injury severity and various contributing factors, such as road-users-related factors, temporal-related factors, environmental conditions, and crash types. The universal rules support traffic managers to better understand the contributions of factors on crash injury severity and further reduce the crash severity and improve traffic safety by developing countermeasures [5–7].
Currently, the research approaches on crash injury severity can be divided into two categories, which are statistical models and machine learning-based models. The statistical models assume that the contributing factors affecting crash injury severity follow a particular distribution, which needs to be defined carefully for better capturing the relationship between crash injury severity and explanatory variables. The commonly used models contain multivariate Poisson regression model [8, 9], ordered probit model [10, 11], bivariate binary/ordered probit model [12, 13], random parameter probit model [14], etc. Wang et al. focused on mountainous expressways and proposed a partial proportional odds model to determine the determinants of truck-involved crash injury severity [15]. Xu et al. attempted to investigate pedestrian-involved crash injury severity by using geographically and temporally weighted regression model taking into account spatial-temporal correlation [16]. The statistical models could demonstrate and explain clearly the correlation between crash severity and related variables with the help of explainable and logical theoretical deductions. However, due to the nonlinear relationship between crash injury severity and contributing factors, these statistical models difficultly capture the inner and intrinsic correlations [17–19].
Machine-learning-based models have a powerful internal inferential capability, which makes them more flexible by learning without or little prior assumptions of related factors to describe the complex characteristics of crash events. Previous researches employed logistic models (e.g., random parameter logit model, and mixed/ordered logit model) [20, 21], support vector machine (SVM) [22, 23], random forest (RF) [24, 25], Bayesian-related models [26, 27], etc., to explore the complex relationship between crash injury severity and contributing factors and further identify the risk factors on crash injury severity. For comprehensive accounting of the observed heterogeneity, Behnood et al. introduced a random parameter multinomial logit model for comparing the contribution of risk factors to crash injury severity under bicycle-vehicle crashes [28]. Liu et al. introduced an ordinal logistic regression model to examine the risk factors on pedestrian-motor vehicle collisions, taking into account the spatial-temporal correlation [29]. Li et al. introduced SVM model to investigate the potential correlation between external factors and crash injury severity, but the performance was suppressed due to multiclass classification problems [30]. Li et al. analyzed the key factors affecting electric bicycle-related crash injury severity with the help of random forest model [31].
Beyond that, Bayesian approaches, as a classical machine learning model, have been widely used in crash injury severity modelling, which were regarded as Bayesian-related models. For instance, Bayesian binomial logistic model [32, 33], Bayesian multivariate regression model [34, 35], Bayesian spatial model [36, 37], and Bayesian mixed logit model [38] have successfully demonstrated their applicability in crash injury severity-involved correlation issues. Yuan et al. divided crash severity into two categories (property damage only and injury/fatality) and integrated bivariate probit model and Bayesian approach to identify the contributing factors associated with crash injury severity [39]. Haq et al. developed binary logistic model with Bayesian inference approach to investigate the effects on truck-involved crashes, especially on occupant injury severity considering comprehensive factors [40]. Guo et al. proposed a novel random parameter, that is, multivariate Tobit model, to identify risk factors on crash severity under different crash types [41]. Zhang et al. utilized a Bayesian multinomial logit model with conditional autoregression prior to examining the hazardous factors that contributed to freeway crash injury severity [42].
- (1)
Conduct a descriptive statistical analysis to investigate the characteristics of VRUs-involved crashes from the perspective of six risk factors (i.e., time of day, day of week, rush hour, crash position, weather, and crash involvements), and further transform into universal rules to support traffic management
- (2)
XGBoost is adopted to identify the risk factors contributing to VRUs-involved crash injury severity with the help of VRUs-involved crashes dataset from policy records, which further determine the real causes to enhance traffic safety
The rest of this paper is organized as follows. Section 2 introduces the data details and candidate variables analyzed in this paper. Section 3 describes the details of XGBoost model. Section 4 provides the experimental results, which consist of crash severity characteristics and identified risk factors. Section 5 briefly concludes the study.
2. Data Description
2.1. Data Source
For exploring the characteristic of VRUs-involved crashes, 554 crash samples were collected from police records on crashes, which have occurred in a city in northern China within about four years. The dataset contains various information, such as crash time, position, involvements, and injury severity, and six factors are extracted to explain the characteristics of VRUs-involved crashes. Vehicles and bicycles or pedestrians were involved in one crash, and bicyclists and pedestrians were defined as VRUs. The crashes dataset contains 323 vehicle-bicycle crashes and 322 vehicle-pedestrian crashes. The property-damage-only crashes are excluded because the vehicle-bicycle or vehicle-pedestrian crashes are prone to injury or death, which belong to injury or fatal accidents. Additionally, the crashes dataset consists of 385 injury crashes and 169 fatal crashes, which caused 517 injuries and 173 deaths.
2.2. Candidate Variables
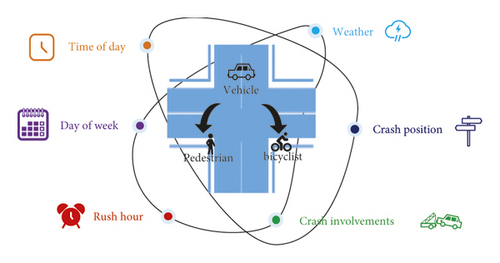
Generally, if fatal or injured occupants are involved in a crash, it can be regarded as a severe accident. Considering that the dataset only contains fatal accidents and injury accidents, but without property-damage-only accidents, the crash injury severity is divided into two categories: injury accident (only injured occupant involved in the crash), which is coded as 0, and fatal accident (at least one fatality occupant involved in the crash), which is coded as 1. Figure 1 describes the extracted factors related to crashes from the dataset, which are time of day, day of week, rush hour, weather, crash position, and crash involvements. These six factors are extracted to investigate the characteristics of VRUs-involved crashes, divided into two typical injury categories (see Table 1).
| Variable | Categories | Value | Fatal (n = 169) | Injury (n = 385) |
|---|---|---|---|---|
| Time of day | Day (7:00–19:00) | 1 | 92 (54.4%) | 263 (68.3%) |
| Night (19:00–7:00) | 0 | 77 (45.6%) | 122 (31.7%) | |
| Day of week | Weekday | 1 | 118 (69.8%) | 294 (76.4%) |
| Weekend/holiday | 0 | 51 (30.2%) | 91 (23.6%) | |
| Rush hour | Rush hour (7:00–9:00, 17:00–20:00) | 1 | 49 (29.0%) | 126 (32.7%) |
| Off-peak hour | 0 | 120 (71.0%) | 259 (67.3%) | |
| Weather | Good (sunny, cloudy) | 1 | 138 (81.7%) | 320 (83.1%) |
| Adverse (rainy, snowy, etc.) | 0 | 31 (18.3%) | 65 (16.9%) | |
| Crash position | Road section | 1 | 110 (65.1%) | 266 (69.1%) |
| Intersection | 0 | 59 (34.9%) | 119 (30.9%) | |
| Crash involvements | Vehicle-bicycle | 1 | 53 (31.4%) | 179 (46.5%) |
| Vehicle-pedestrian | 0 | 116 (68.6%) | 206 (53.5%) |
To some extent, time of day reflects the lighting conditions laterally, which is a crucial factor for traveling. Considering that, the crash position is complex, which mainly contains road section and intersection, but less sidewalk, roundabout. For better modelling, the crashes happened on sidewalk were regarded as road section. The weather information is collected from the related website (see http://www.tianqihoubao.com/lishi) based on the date and time of crashes [26]. Noting that this website provides the weather information only in two periods, that is daytime and night, it is not detailed enough to the specific hours. Additionally, due to the various types of weather, some of them have similar impact on traveling environment, for instance, sunny and cloudy, rainy and snowy. Therefore, the weather was divided into two categories: good and adverse.
3. Methodology
Extreme gradient boosting (XGBoost), as a typical decision tree ensemble-based model, was proposed by Chen in 2016 [44]. XGBoost is optimized from GBDT, which introduced second-order derivatives into optimization process. It outperforms with advantages of parallel learning, high flexibility, built-in cross-validation, etc. Previous studies have proved the successful use in traffic crash severity analysis and risk prediction [45, 46].
3.1. Objective Function
3.2. Additive Training
3.3. Model Complexity
4. Results
Based on the 544 crashes data, the time-related information, crash position, weather, and crash involvements are investigated. In the section, six risk factors are extracted to explore the characteristics of VRUs-involved crashes and further determine the risk factors contributing to crash injury severity.
4.1. Descriptive Statistical Analysis
4.1.1. Temporal Characteristics
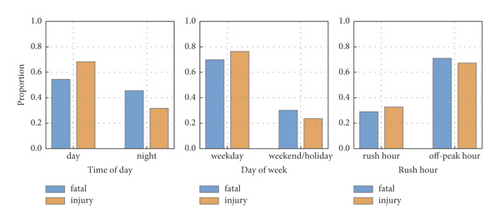
Figure 2 illustrates the proportion of different accident types under three time-related factors. From the perspective of the time of day, the VRUs-involved crashes are probable to occur in the daytime, while the proportion of fatal crashes at night is relatively higher than those in the daytime, with values of 38.7% and 25.9% (see Table 2). Maybe most people intend to travel during the daytime, which is prone to cause crashes. But at night, due to the terrible travel environment (i.e., poor light visible condition), the crashes are easy to cause deaths. Additionally, the proportion of crashes on weekdays is larger than that on weekends/holidays, but the fatality rate is the opposite and the values of weekday and weekend/holiday are 28.6% and 35.9%, respectively. The reason may be that people keep a relatively low safety alert when traveling on weekends/holidays than on weekdays. Moreover, the VRUs-involved crashes are prone to happen in off-peak hours than in rush hours due to the longer period of off-peak hours. Similarly, the fatality rate of off-peak hours is higher than those of rush hours (the values are 31.7% and 28.0%, respectively).
| Time of day | Day of week | Rush hour | ||||
|---|---|---|---|---|---|---|
| Day | Night | Weekday | Weekend/Holiday | Rush hour | Off-peak hour | |
| Fatal | 92 (25.9%) | 77 (38.7%) | 118 (28.6%) | 51 (35.9%) | 49 (28.0%) | 120 (31.7%) |
| Injury | 263 (74.1%) | 122 (61.3%) | 294 (71.4%) | 91 (64.1%) | 126 (72.0%) | 259 (68.3%) |
| Total | 355 | 199 | 412 | 142 | 175 | 379 |
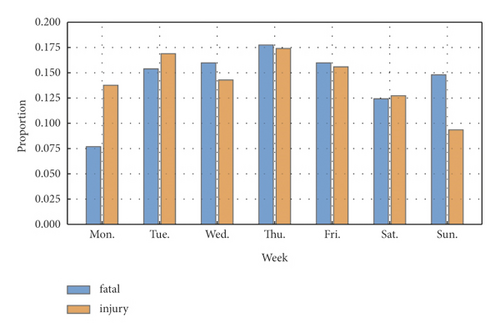
The variation tendency of VRUs-involved crashes counted by different days of the week is shown in Figure 3, and Table 3 provides the crash injury severity information under each day of the week. It illustrates that the largest number of crashes appears on Thursday, while Sunday occupies the least number. The main reason possible is that Thursday is the day near the weekend, the busiest day for most people as well as for the traffic, and yet Sunday is the final of a weekend when people are more likely to take a rest at home. However, the fatality rate is higher on Sunday (the value is 41.0%) because of the low safety awareness of people during leisure travel. Additionally, Monday takes up the minimum fatality rate with a value of 19.7%. The reason may be that Monday is the first day of weekday, and people will maintain a relatively high-security alert while commuting to work.
| Monday | Tuesday | Wednesday | Thursday | Friday | Saturday | Sunday | |
|---|---|---|---|---|---|---|---|
| Fatal | 13 (19.7%) | 26 (28.6%) | 27 (32.9%) | 30 (30.9%) | 27 (31.0%) | 21 (30.0%) | 25 (41.0%) |
| Injury | 53 (80.3%) | 65 (71.4%) | 55 (67.1%) | 67 (69.1%) | 60 (69.0%) | 49 (70.0%) | 36 (59.0%) |
| Total | 66 | 91 | 82 | 97 | 87 | 70 | 61 |
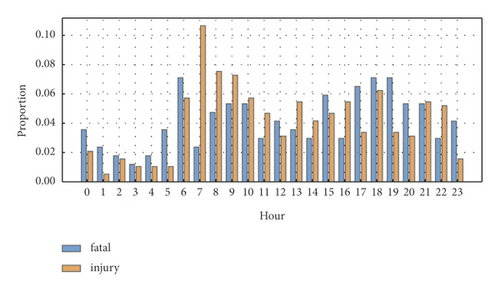
The statistical information of VRUs-involved crashes for injury severity is shown in Table 4, and Figure 4 illustrates the variation tendency of crashes counted by hours of the day. It indicates that crashes are prone to appear in rush hour (i.e., 7:00–9:00, 17:00–20:00), especially in the rush hours of the morning, with the highest peak existing in 7:00–8:00 (the total number of crashes is 45). It is because that this period is the time to go to work when the traffic is busy, likely to cause crashes. Moreover, most of the crashes happened at 6:00–23:00, which is the time for human activities, while few crashes occur within 23:00–6:00, which is the sleeping time. Overall, we found that the mortality at night is relatively higher than that in the daytime.
| Hour | Fatal | Injury | Total |
|---|---|---|---|
| 0 | 6 (42.9%) | 8 (57.1%) | 14 |
| 1 | 4 (66.7%) | 2 (33.3%) | 6 |
| 2 | 3 (33.3%) | 6 (66.7%) | 9 |
| 3 | 2 (33.3%) | 4 (66.7%) | 6 |
| 4 | 3 (42.9%) | 4 (57.1%) | 7 |
| 5 | 6 (60.0%) | 4 (40.0%) | 10 |
| 6 | 12 (35.3%) | 22 (64.7%) | 34 |
| 7 | 4 (8.9%) | 41 (91.1%) | 45 |
| 8 | 8 (21.6%) | 29 (78.4%) | 37 |
| 9 | 9 (24.3%) | 28 (75.7%) | 37 |
| 10 | 9 (29.0%) | 22 (71.0%) | 31 |
| 11 | 5 (21.7%) | 18 (78.3%) | 23 |
| 12 | 7 (36.8%) | 12 (63.2%) | 19 |
| 13 | 6 (22.2%) | 21 (77.8%) | 27 |
| 14 | 5 (23.8%) | 16 (76.2%) | 21 |
| 15 | 10 (35.7%) | 18 (64.3%) | 28 |
| 16 | 5 (19.2%) | 21 (80.8%) | 26 |
| 17 | 11 (45.8%) | 13 (54.2%) | 24 |
| 18 | 12 (33.3%) | 24 (66.7%) | 36 |
| 19 | 12 (48.0%) | 13 (52.0%) | 25 |
| 20 | 9 (42.9%) | 12 (57.1%) | 21 |
| 21 | 9 (30.0%) | 21 (70.0%) | 30 |
| 22 | 5 (20.0%) | 20 (80.0%) | 25 |
| 23 | 7 (53.8%) | 6 (46.2%) | 13 |
4.1.2. Spatial Characteristics
In the raw crash dataset, the crash position is complex, which makes the spatial characteristics hard to be described. Hence, we reorganized the complicated crashes environment into two types: road section and intersection. Table 5 provides the statistical information of crashes under two types of positions. There are 169 fatalities involved in crashes, including 110 on road sections and 59 at intersections. Moreover, the crashes that occurred on road sections take a higher proportion than intersections, and the mortality of crashes on road sections and at intersections are 0.293 and 0.331, respectively. Additionally, the proportion of fatal crashes that happened at intersections is higher than that of injury crashes, with values of 34.9% and 30.9%. Therefore, we can obtain that the crashes are more likely to happen on road sections, but the crashes happening at intersections have higher fatalities.
| Position | Fatal accident | Injury accident | Total | Mortality |
|---|---|---|---|---|
| Road section | 110 (65.1%) | 266 (69.1%) | 376 (67.9%) | 0.293 |
| Intersection | 59 (34.9%) | 119 (30.9%) | 178 (32.1%) | 0.331 |
| Total | 169 | 385 | 554 | 0.305 |
4.1.3. Weather Characteristics
There are various types of weather, so that it is hard to describe the weather characteristics associated with crash injury severity. Hence, the weather is divided into good (including sunny and cloudy) and adverse weather (including rainy, snowy, etc.). Table 6 shows the statistical information of injury severity in all weathers. Most VRUs-involved crashes happened in good weather, taking up 82.7%. That is because people prefer to travel in good weather compared to adverse weather. However, the mortality of crashes in adverse weather is higher than that in good weather, with values of 0.323 and 0.301, respectively. Similarly, the crashes that happened in adverse of fatal accidents account for a high proportion than injury accidents; the values are 18.3% and 16.9%, respectively. The results illustrate that VRUs-involved crash rarely happens in adverse weather. But once it happens, it may cause fatality.
| Weather | Fatal accident | Injury accident | Total | Mortality |
|---|---|---|---|---|
| Good | 138 (81.7%) | 320 (83.1%) | 458 (82.7%) | 0.301 |
| Adverse | 31 (18.3%) | 65 (16.9%) | 96 (17.3%) | 0.323 |
| Total | 169 | 385 | 554 | 0.305 |
4.1.4. Crash Involvements’ Characteristics
In the crash dataset, the simultaneous participants in the crashes are vehicle and bicycle or vehicle and pedestrian; thus, the crash involvements are divided into vehicle-bicycle and vehicle-pedestrian. It can be seen that vehicle-pedestrian crashes take up a relatively high proportion not only in fatal accidents but also in injury accidents (see Table 7), and the proportion of fatal crashes is higher than that of injury crashes, with values of 68.6% and 53.5%, respectively. Additionally, the mortality of vehicle-pedestrian crashes is higher than vehicle-bicycle crashes, with values of 0.360 and 0.228. In sum, we can infer that vehicle-pedestrian crashes more easily result in death compared to vehicle-bicycle crashes, and most of these crashes may happen in intersections and crosswalks. It is probably because that the targets of bicycles are larger than pedestrians, more likely to attract the attention of vehicle drivers. And the reaction distance of cyclists is longer than pedestrians, which can reduce the injury severity in crashes.
| Crash involvements | Fatal accident | Injury accident | Total | Mortality |
|---|---|---|---|---|
| Vehicle-bicycle | 53 (31.4%) | 179 (46.5%) | 232 (41.9%) | 0.228 |
| Vehicle-pedestrian | 116 (68.6%) | 206 (53.5%) | 322 (58.1%) | 0.360 |
| Total | 169 | 385 | 554 | 0.305 |
4.2. Importance Identification for Risk Factors
4.2.1. Parameters Optimization
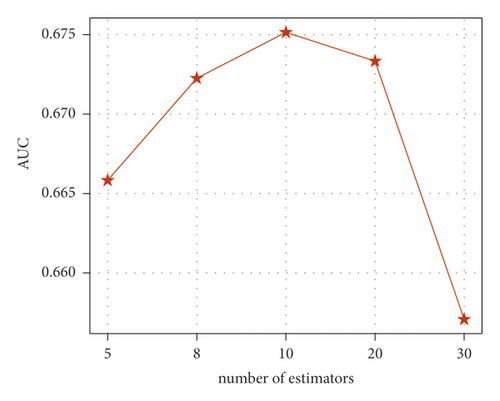
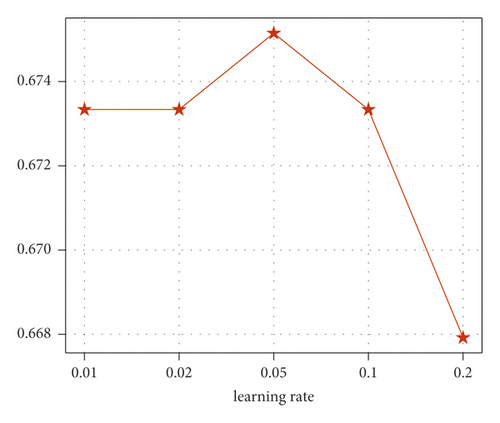
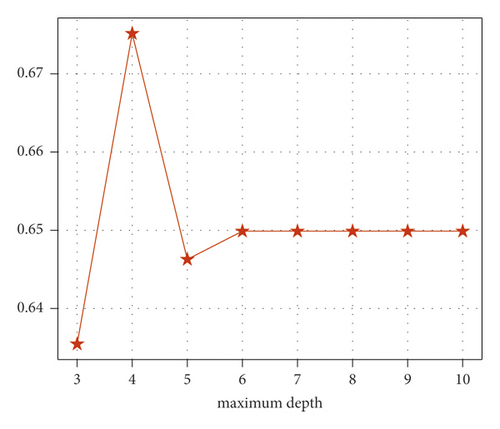
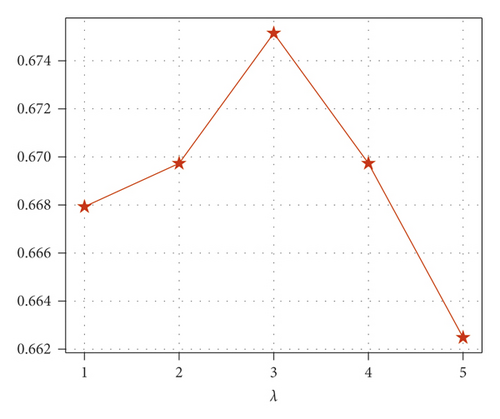
In this section, XGBoost is utilized to identify the contributing factors influencing crash injury severity. It is noted that the parameters of XGBoost are crucial for the model performance, and the grid search algorithm is introduced to obtain the optimal parameters. For binary classification problem in this study, the logistic loss and area under receiver operating characteristic curve are defined as objective loss function and evaluation metric, respectively. Moreover, four parameters, including number of estimators (n_estimators), learning rate, maximum depth, and coefficient of regularization (λ), are selected to optimize by grid search algorithm, and the candidate values are given in Table 8. The number of estimators refers to the number of iterations (i.e., the number of decision tree), learning rate controls the step size in weight updating, and maximum depth denotes the maximum depth of a tree. All these parameters contribute to preventing overfitting.
| Parameter | Number of estimators | Learning rate | Maximum depth | λ |
|---|---|---|---|---|
| Value | 5, 8, 10, 20, 30 | 0.01, 0.02, 0.05, 0.1, 0.2 | 3, 4, 5, 6, 7, 8, 9, 10 | 1, 2, 3, 4, 5 |
Based on the grid search results, we found that the optimal parameters model can be obtained, when the number of estimators is set as 10, learning rate as 0.05, maximum depth as 4, and λ as 3, and the scores of AUC and accuracy are 0.675 and 0.706, respectively. Figure 5 provides the AUC variation trends under different parameter settings. From Figure 5(a), the AUC scores show a up and down trend, and the maximum scores is 0.675 when number of estimators is set as 10, which indicates the optimal value of number of estimators is 10. The optimal values of learning rate, max depth, and λ are 0.05, 4, and 3, respectively. It is noted that the other three parameters are set as optimal values (i.e., learning rate is set as 0.05, max depth as 4, and λ as 3) in Figure 5(a), and other cases follow this rule.
4.2.2. Risk Factors’ Analysis
The XGBoost model with optimal parameters can be obtained after the parameters optimization procedure by using grid search algorithm. Then, the contributing factors were identified such that which factors show greater impact on VRUs-involved crashes injury severity. Figure 6 shows the importance of various risk factors from XGBoost model based on information gain, which is defined as the average gain for objective function optimization across all splits the feature (i.e., factor) is used in. The time of day occupies the most important role in VURs-involved crash injury severity, with the information gain score as 4.56. It reveals that time of day (day/night), which can use lighting conditions (good/adverse) instead, has a greater impact on VRUs-involved crashes, maybe because that the crashes are prone to happen in the daytime (or good lighting condition), while the crashes that occurred at night (or adverse conditions) are more likely to cause deaths.
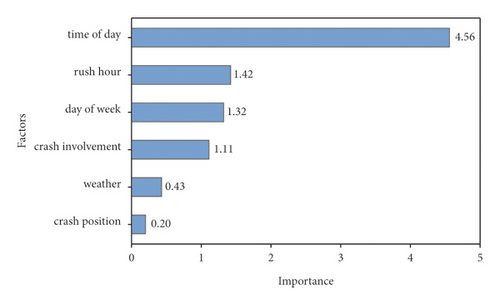
Moreover, rush hour, day of week, and crash involvements show relatively similar importance, with the information gain scores as 1.42, 1.32, and 1.11, respectively. The reason may be that the categories of rush hour (i.e., rush hour and off-peak hour) show a minor difference of influence on VRUs-involved crashes, and day of week (i.e., weekday and weekend/holiday) and crash involvements (i.e., vehicle-bicycle and vehicle-pedestrian) are similar. The weather and crash position represent the least importance to VRUs-involved crash injury severity, and the information gain values are 0.43 and 0.20. Therefore, we infer that the people who travel in good or adverse weather show a similar impact on crash injury severity, which is consistent with the result of Section 4.1.3 (the mortalities are close in Table 6). This may be because people do not like to travel in adverse weather and they keep a relatively high safety awareness when traveling. Additionally, the VRUs-involved crashes that happened in different position (i.e., road section and intersection) show semblable result.
5. Conclusions
VRUs-involved crash injury severity analysis transforms the relationship behind the crashes into universal rules and further supports traffic management. This paper demonstrates a descriptive statistical analysis of the characteristics of VRUs-involved crashes based on 554 crashes data collected in a city of northern China and further utilizes XGBoost to identify the risk factors affecting crash injury severity. The important conclusions are summarized as follows. (1) The risk factors (i.e., time of day, day of week, rush hour, crash position, weather, and crash involvements) are closely related to VRUs-involved crash injury severity. More specifically, vehicle-bicycle and vehicle-pedestrian crashes are prone to involve fatalities at intersections on the weekend night in adverse weather. (2) The time of day plays a more important role in VRUs-involved crash injury severity compared with other factors, which reveals that VRUs-involved crashes that happened at night are prone to cause deaths. Additionally, the weather has little effect on VRUs-involved crash injury severity. (3) Compared to vehicle-bicycle crashes, vehicle-pedestrian crashes are prone to happen at intersections (especially at the crosswalk near the intersection), and these crashes readily cause deaths.
Although few factors were analyzed, the AUC and accuracy of XGBoost are 0.675 and 0.706, respectively, and the results still can be accepted and meet the current study. To obtain more accurate and detailed characteristics of VRU-vehicle crash injury severity, several research directions are proposed. (1) More risk factors (e.g., lighting condition, drivers’ age, gender, crash pattern, and crash location related factors) can be considered to better explain the characteristics of VRU-vehicle crash injury severity and further identify the crucial risk factors. The characteristics of VRU-vehicle crash injury severity are not perfectly and accurately exploited due to the limitation of the risk factors. However, abundant risk factors may cause unfaithful characteristics to be described. To this topic, how to extract an appropriate number and precise risk factors is a crucial challenge. (2) Risk factors identified mechanism can be developed with high accuracy and robustness on crash injury severity analysis, such as random forest (RF) and nonparametric Bayesian approach, to better explain the characteristics and determine the real causes of crashes. The XGBoost model facilitates the investigation of crash injury severity issues, but the accuracy is limited due to the small sample size. Therefore, how to develop risk factors identified approach with a small sample size is a hot point. In addition, how to consider the spatial-temporal correlations in modelling process is a crucial challenge.
Conflicts of Interest
The authors declare that there are no conflicts of interest regarding the publication of this paper.
Acknowledgments
This paper was supported by the National Natural Science Foundation of China (nos. 52102397 and 52072214) and the National Key R&D Program of China (no. 2019YFB1600605).
Open Research
Data Availability
The data used to support the findings of this study are available from the corresponding author upon request.


