Automated Shape Analysis and DEM Study on Graded Crushed Stone
Abstract
Graded crushed stone (GCS), as a cheap and essential component, is of great importance in road construction. The irregularity and variability of particle shape is known to affect the packing characteristics of GCS, such as compactness and void ratio. In this study, the realistic particle outline is first automatically extracted based on digital image processing and deep learning algorithms. Then, the elongation (EI), roundness (Rd), and roughness (Rg) of GCS are quantified by shape evaluation algorithms. Moreover, based on the establishment of the GCS shape library, the gravity deposition with various elongations is simulated using the discrete element method to study the packing features of GCS. The elongation effects on the macroscopic and microscopic quantities are explored. Finally, the shear behavior of GCS is studied. The results illustrate that elongation has a significant effect on the packing of GCS.
1. Introduction
With the development of the highway industry and the deepening of engineering practice, the asphalt pavement structure used in China has been diversified from the single semirigid asphalt base, and the graded crushed stone flexible base asphalt pavement has become one of the main pavement structure forms in China. As a mixture composed of aggregates of different sizes, the graded crushed stone (GCS) is widely applied between the asphalt surface and semirigid base and can effectively weaken the cracks in the top of the semirigid base and the stress concentration effect. Additionally, GCS can also reduce the temperature shrinkage and dry shrinkage stress caused by the change of temperature and humidity of the semirigid base [1, 2].
Due to the great significance of GCS to highway construction, it is particularly essential to study its mechanical properties, deformation, and failure mechanism. However, it is difficult to analyze its mechanical properties quantitatively and qualitatively by conventional methods because of its granular structural characteristics and nonlinear mechanical properties [3]. On the one hand, the conventional laboratory test for GCS is complex and costly, which makes it difficult to reveal the macro-meso mechanical characteristics of GCS under load. On the other hand, the granular material such as GCS has great variability and the data results of different specimens in the same group are relatively low in correlation, which makes experimental data unreliable [4]. Hence, it is very necessary to use the numerical test method to study the mechanical properties of GCS from the microscopic point of view, to make up for the lack of laboratory tests and provide a powerful means for the in-depth understanding of GCS [5, 6].
As a basic road material, the shape of crushed stone particles has a significant effect on its mechanical properties. Scholars have done much research on the mechanical properties of GCS influenced by GCS shape. An [7] carried out a quantitative analysis on the particle shape of GCS to explore the relationship between the real particle shape and particle accumulation porosity. Le Pen et al. [8] set out methods for evaluating form and roundness (aspects of shape) and proposed a new measure for evaluating roundness, termed ellipses for crushed stone. Zhang et al. [9] simulated the geometric anisotropy of the GCS using randomly generated models. The results showed that the changes of both friction and anisotropy had a similar trend with the particle size enlarging in the dense assembly, which maintains stability when the size is less than 3.0 mm.
Numerical simulation methods are often used in exploring the properties of GCS. Jiang et al. [10] used PFC2D to establish a numerical test method for California bearing ratio (CBR) and found that CBR values increase with the friction coefficient at the contact and shear modulus of the rocks, while the influence of Poisson’s ratio on the CBR values is insignificant. Ren et al. [11] proposed a random calculation model for GCS and studied the Direct Shear Tests (DST) of GCS by PFC2D. Xu et al. [12] proposed Plastic Deformation Index (PDI) as the evaluation indicator and founded that the PDI should be less than or equal to 1900 mm number for expressway and first-grade highway. Jiang et al. [13] established a numerical model of dynamic triaxial test of GCS based on PFC2D and founded that the size of the specimen has a slight influence on the simulated value of axial strain when specimen height is greater than 40 cm and diameter is greater than 20 cm.
In this study, the particle outlines are firstly extracted based on deep learning algorithms. The U-NET model is trained for contour extraction. Then, the shape evaluation indexes including elongation, roundness, and roughness are quantified. In addition, the gravity deposition with a distinct EI value is simulated by the discrete element method to explore the elongation effects on the macroscopic and microscopic quantities. Finally, the shear behavior of GCS is studied. Overall, this study lays a foundation for future research about GCS.
2. Materials and Equipment
-
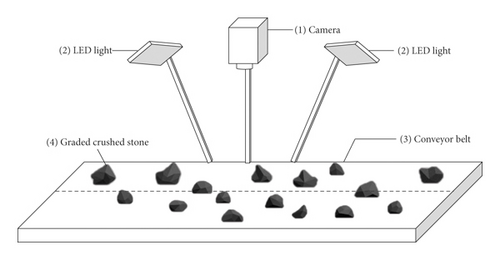
Component (1): A Fujinon X-T20 camera as shown in Figure 1(b) with a resolution of 24 million pixels (6000 × 4000 pixels) and two lenses: Fujinon XF60 mm F2.4 R Macro and Fujinon XF35 mm F2 R WR. At least 90 pixels are used to represent the smallest diameter of the particle.
-
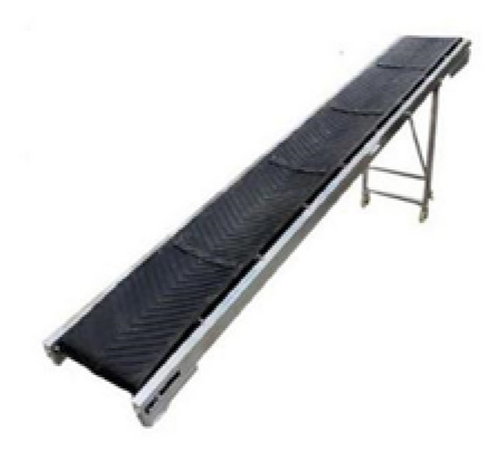
Component (2): A conveyor belt as shown in Figure 1(c) used to carry GCS to simulate the real transport of GCS.
-
Component (3): Two lamps composed of 256 LEDs as shown in Figure 1(d) provide controllable lighting conditions. The light is scattered uniformly so the lamps have good color rendering. The LED lamp arm is installed on the copy stand and is perpendicular to the plane of each LED lamp. In addition, the lamp is placed 45 cm above the transparent plastic plate. Besides, the side of the lamp is parallel to the side of the base of the copy stand. The color temperature is 5600 K at the maximum brightness value.


3. Automated Extraction of GCS Contours
3.1. Implementation of Algorithms
For image processing, convolutional neural network (CNN) and full convolutional network (FCN) are the main frames for image segmentation. However, CNN has two obvious drawbacks: (1) slow training process because of too much redundancy and (2) asynchronism between obtaining sensing field and positioning accuracy. Mostly, CNN is used for image classification at the image level. By contrast, FCN can classify images at pixel level with good training results. In order to avoid these defects as much as possible, in this study, according to Liang et al. [14] a lightweight U-NET [15] method of a fully convolutional neural network is adopted for image segmentation.
3.1.1. Lightweight U-NET and Operation
In this study, a U-NET deep neural network is introduced. Firstly, the lightweight U-NET particle image is converted into a 3D matrix W × C × h as the input data, where W and h are the width and height of the input image, respectively; C is the number of color channels of input images, where C = 3 represents RGB image and C = 1 represents gray/binary image. The gray images are input data, and binary images are output data. Then, the network generates a mask by a matrix with a size of W × h × 1 to record the pixels on the projection of GCS. For clarity, three parts of the operation of lightweight U-NET are briefly explained: convolution, Maxpool, and deconvolution.
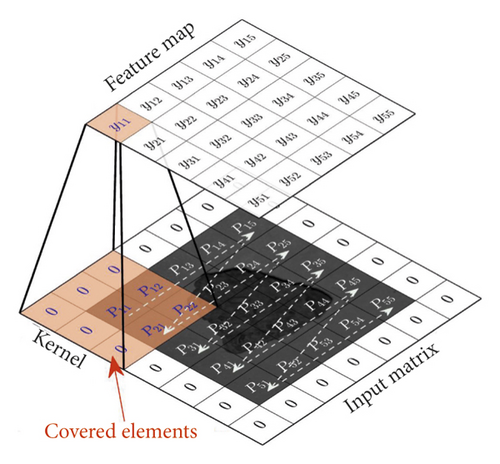
The Maxpool and Upconv operations use different kernels and computations to downsample and upsample the input matrix, respectively. But they are both executed by sliding Windows, just like convolution operations. The Maxpool operation can be regarded as a special convolution operation, with kn = 2 and S = 2, and the function of formula yij which outputs the maximum element covered by the kernel. Deconvolution, as opposed to convolution, has different interpretations like upsampling or transposed convolution. In this study, we used a UpSampling2D built-in Keras to implement the upsampling operation.
3.1.2. Model Optimization
Considering the limited size and computing power of the model, the size of the network was reduced by half; thus, the number of channels (c) of all operations was reduced to half of the original number except for the number of channels at the end and the beginning. At the same time, in order to prevent overfitting, part of neural network units are temporarily dropped from the network according to a certain probability, which is equivalent to finding a thinner network from the original network. Dropout [17] should be performed after the fourth Maxpool operation with the parameter keep_prob_(the probability of which part of the network would not be dropped) set to 0.6. It is a parameter of the dropout method. The overall structure of U-NET is shown in Figure 3.
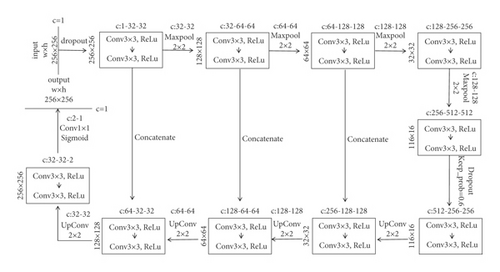
The commonly used optimization method Adam of deep learning is used to dynamically adjust the learning rate of each parameter by using the first-order moment estimation and second-order moment estimation of the gradient. For the loss function, cross-entropy was used in this study.
3.2. Training of the Model
3.2.1. Data Set Preparation
For the collected pictures, the “labelme” image marking tool was used to manually mark the GCS. A total of 400 pictures is collected as the training set. Meanwhile, 50 pictures are collected as the validation set.
3.2.2. Data Enhancement
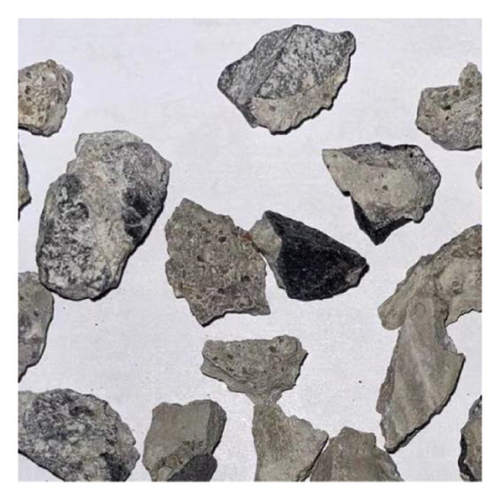
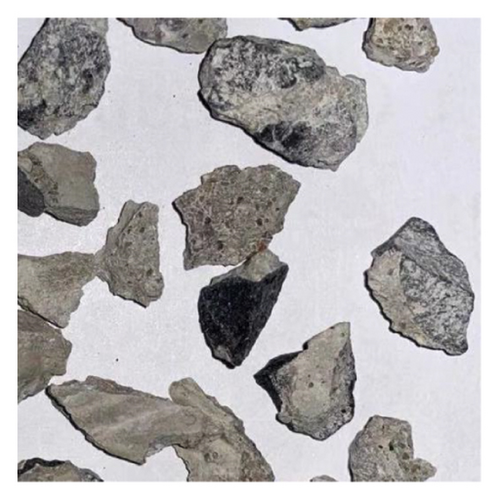
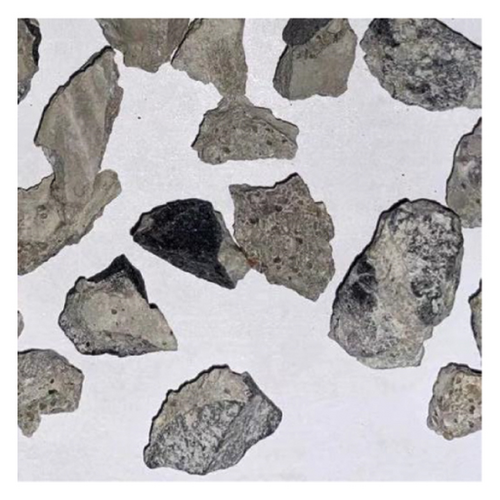
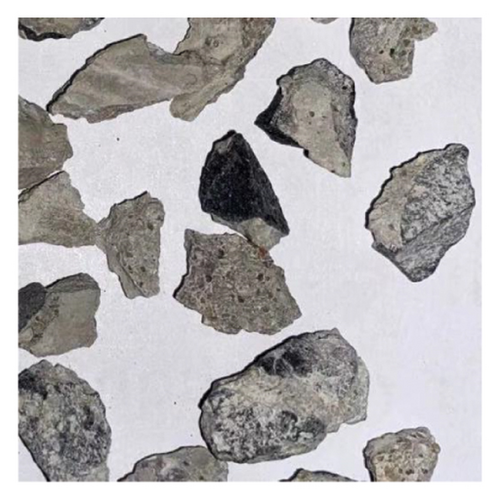
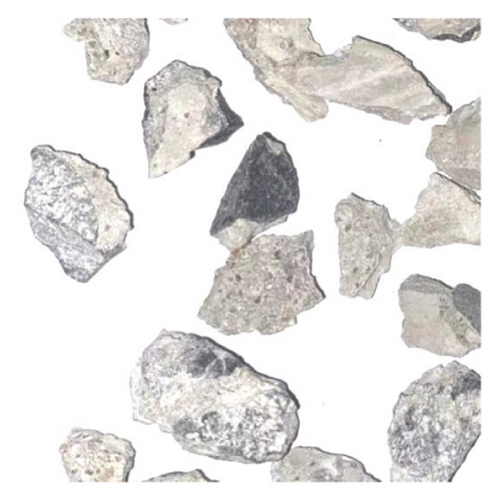
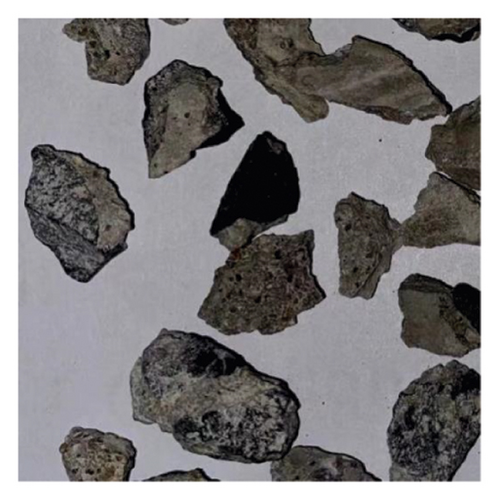
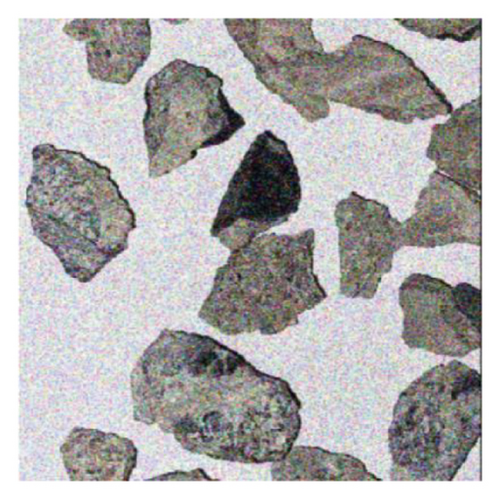
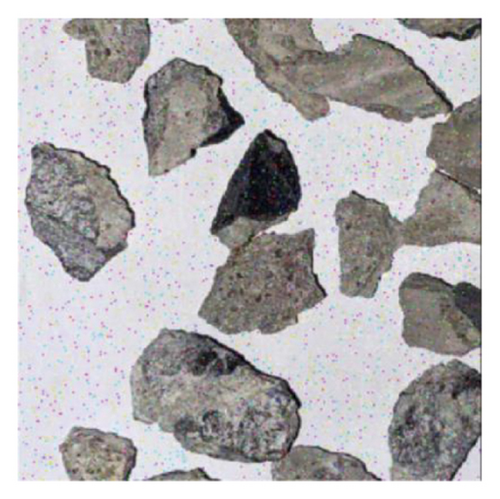
Image enhancement is a widely used training sample expansion method. In order to improve the diversity of training samples and enhance the antinoise performance of the model, image enhancement technology was used to expand the obtained samples. A total of 4 categories and 8 image enhancement technologies were used, including (1) image rotation; (2) image flipping; (3) random brightness transformation; and (4) random pepper and salt noise, as shown in Figures 4.

3.2.3. Recognition Effect
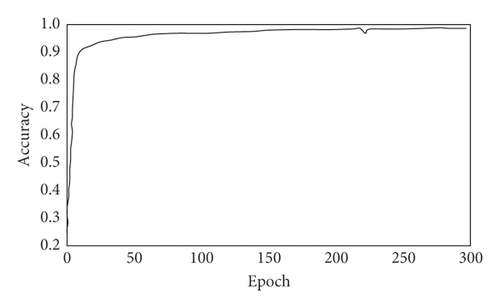
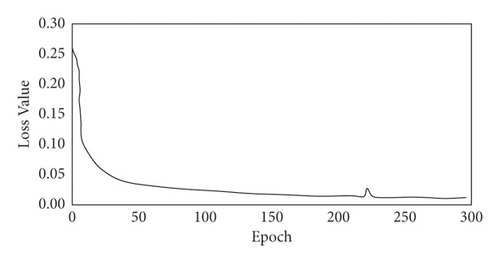
Parameters are adjusted manually. Through multiple experiments of different parameter setting, the best parameter is chosen. By adjusting the parameters, the learning rate was set to 1 × 10⁻⁴, the scale of the U-NET network was reduced, and the effect of the data set was enhanced. The performance of U-NET model is validated by the validation data set. After each iteration of 30 times and 300 rounds of epochs training, the accuracy of the validation set reached a value of 96%, which shows a strong generalization ability of this U-NET model. The loss function reached a value of about 0.01. The curves of accuracy and loss value of the trained model are shown in Figures 5 and 6, respectively.
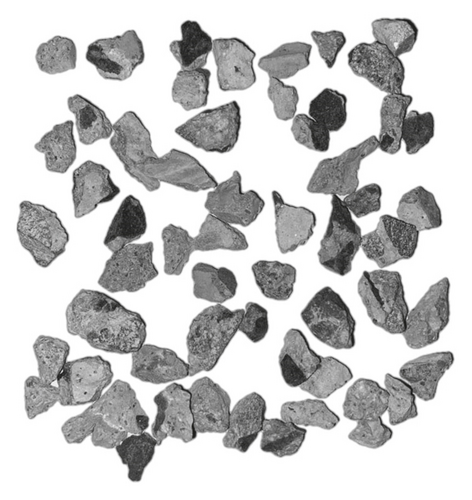
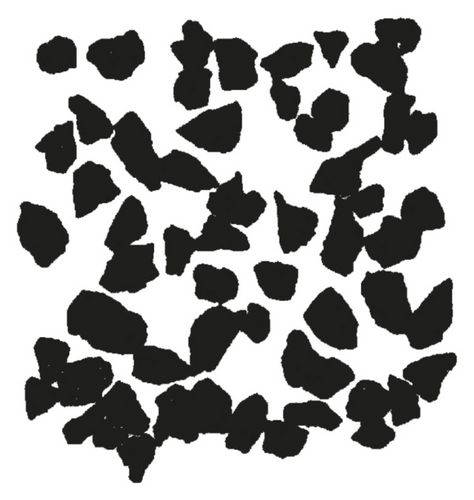
The particle identification effect is shown in Figure 7.
3.3. Segmentation of GCS
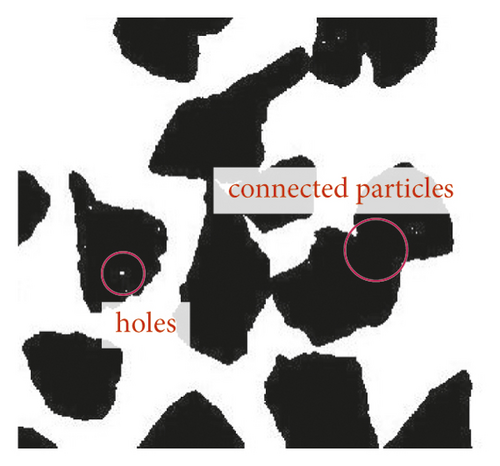
Generally, images obtained through the trained network still have some defects. The red marked area in Figure 8 shows the adhesion between particles, which affects further morphological analysis and calculation.
- (1)
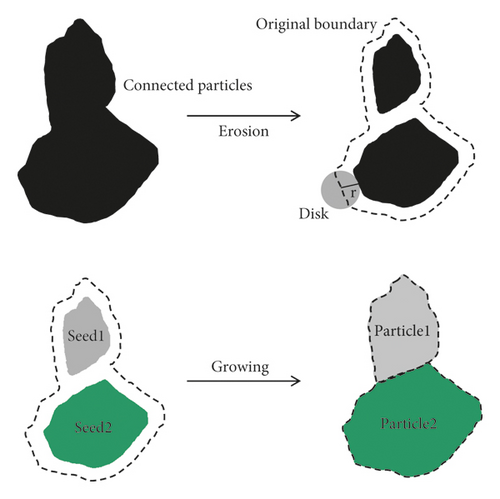
The corrosion algorithm is used to separate the connected particles into several independent parts, and each part is labeled as the expanded seed of the flooding method.
- (2)
The seed is taken as the base point and expanded outward in the way of coloring. When the pixel meets the boundary of other seeds or particles, freeze the pixel and stop the expansion of this part.
- (3)
When the expansion of all seed pixels stops, the segmented particles are obtained.
4. Quantitatively Analysis of GCS Shapes
4.1. Methods for Quantifying the Particle Shape Indexes
4.1.1. Quantification of Elongation

4.1.2. Quantification of Roundness
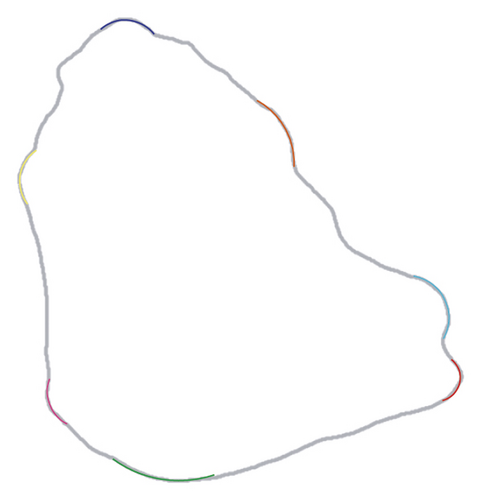
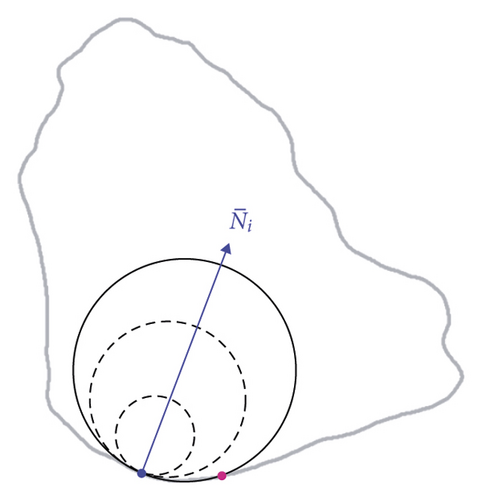
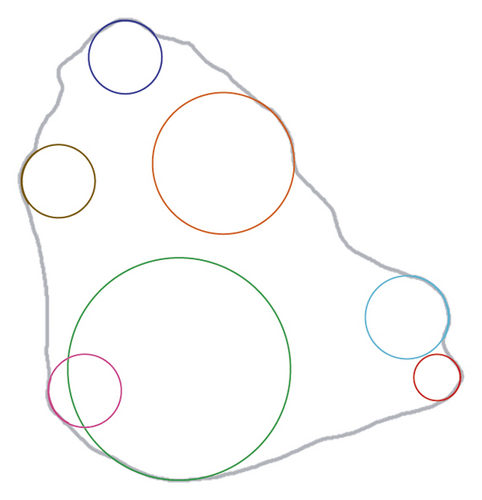
The contour point P(θ, r(θ)) can be seen as a corner point when r(θ) < Rinsc. Thus, the corner region is the contour of all corner points (Figure 11(a)). The ODEC algorithm [22] can be used to calculate the radius of the inscribed circle of corner points, as shown in Figure 11(b). To be specific, the inner normal vector of the ith corner point is first calculated. Then, the inscribed circle along the direction of is determined, by starting from the ith corner point with a radius of ∆r. After that, whether the inscribed circle is tangent to any other contour point is determined. If not, the radius ∆r is increased and the last two steps are repeated; otherwise, terminate the process and take ∆r as the radius of the inscribed circle of the ith corner point.
4.1.3. Quantification of Roughness
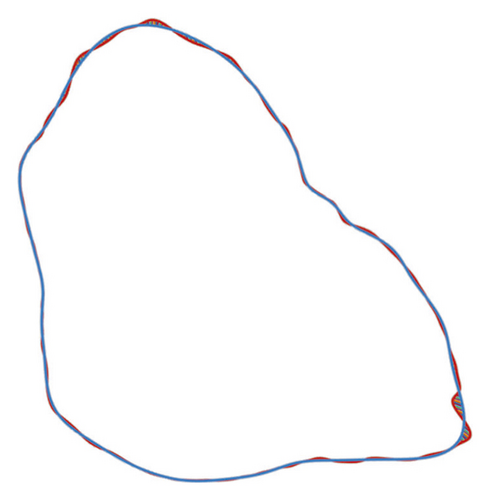
Roughness is a shape index that evaluates the concavity of the particle contour and it can show the shape difference between the real contour and the smoothed contour of particles. Fourier transform can be used to calculate the smoothed contour of a particle. The larger Fourier series (N) corresponds to a higher similarity between the real contour and the smoothed contour [23]. In this study, the Fourier series N is set to 16 to calculate the smoothed contour. The deviation between the smoothed contour and the real contour is shown in Figure 12.
4.2. Statistics of Shape Indexes
Through the quantification algorithms introduced above, the elongation (EI), roundness (Ed), and roughness (Rg) of 1200 GCS were calculated. The fitting results are shown in Table 1.
| Shape index | Fitting function | Mean value | Goodness of fit R2 | Range |
|---|---|---|---|---|
| EI | Normal distribution | 0.68 | 0.98 | From 0.25 to 1 |
| Rd | Normal distribution | 0.33 | 0.98 | From 0.2 to 0.6 |
| Rg | Normal distribution | 0.0039 | 0.97 | From 0.002 to 0.006 |
Normal distribution tests were implemented on the probability density of the three shape indexes. The results showed that all three indexes satisfied normal distribution appropriately. Within the results, the width of the distribution of elongation is the maximum and the width of the distribution of roundness is the minimum, with ranges from 0.4 to 1 and from 0.2 to 0.5, respectively. Furthermore, the mean values of the three shape indexes EI, Rd, and Rg are 0.68, 0.33, and 0.0039, respectively.
4.3. Establish Shape Library
To facilitate retrieval and sample preparation, the shape indicators of the GCS are stored together with the coordinates, with the storage format [number, outline, slender length, elongation, roundness, roughness].
- (1)
The required shape parameter range is input
- (2)
According to the range of these values, the two-dimensional contour that meets the requirements can be searched automatically
- (3)
The visualized two-dimensional contour is selected and is output to the “dxf” file
After establishing the particle library, it will be very convenient to select the two-dimensional contours of GCS that meet specific requirements, so as to facilitate the discrete element modeling of GCS. Moreover, it lays the foundation for further study on the relationship between the geometric information and mechanical properties of GCS.
5. Application to DEM Simulation of GCS Packing
5.1. Simulation of Gravity Deposition
The mechanical parameters of GCS like shear strength and deformation modulus can be affected by the packing characteristics. The shape index EI is set as the DEM [24] simulation variable to explore the influence of particle shape on packing properties, as shown in Figure 13(a). Considering the elongation variable, the GCS were selected and divided into 7 groups where EI is set from 0.4 to 1.0. In this study, the particles in DEM are not generated randomly; on the contrary, real GCS were used as samples to enhance the reliability of the simulations.

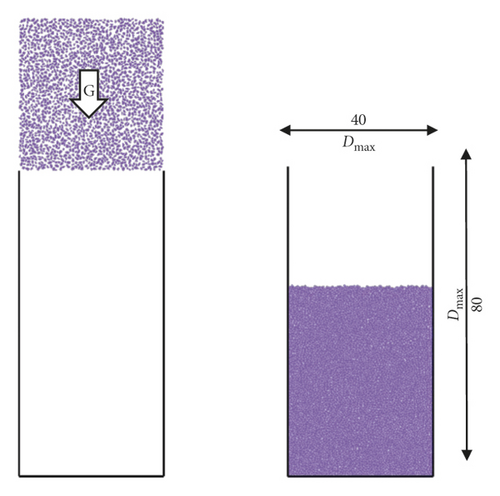
Stratified gravity deposition simulation of the natural packing process of particles is the common way to generate particle models. In the model, DEM particles fall naturally with gravity. After completing the previous layer deposition, a new layer of particles is generated and the deposition process is repeated until the whole simulation is completed, as shown in Figure 13(b) [25]. The gravity deposition process is simulated by PFC2D, and the interparticle contact and the wall-particle contact are both linear contacts. The parameters of the model are shown in Table 2.
| Parameter | Value |
|---|---|
| Particle number | 1000 × 3 |
| Particle density (kg/m3) | 2650 |
| Interparticle frictional coefficient | 0.5 |
| Wall-particle frictional coefficient | 0 |
| Effective modulus (Pa) | 1 × 10⁸ |
| Stiffness ratio | 4/3 |
| Damping factor | 0.7 |
5.2. Analysis of Macro-Meso Parameter
Macro-meso parameters reflect the particle packing properties, such as void ratio, compactness, and coordination number. In this section, the effect on EI is considered.
5.2.1. Macro Parameter
The degree of density of particles can be described by a macro parameter, void ratio (e), which is affected by particle shape.
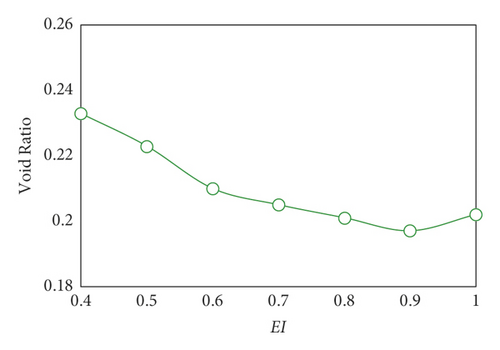
The change curves of the void ratio with respect to EI are shown in Figure 14. Void ratio e decreases with the growth of EI, indicating that the particle packing gets closer with EI increasing. Then, the void ratio reaches a bottom value of 0.187 and starts to soar at the point where EI is 0.9.
5.2.2. Micro Parameter
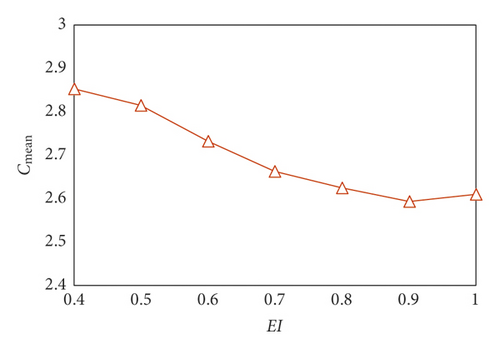
In the change curve of the mean coordination number with respect to EI shown in Figure 15, a reflection point also appears at the point where EI is 0.9. Similar to the curve of void ratio, Cmean exhibits a decreasing trend with EI increasing. After reaching the bottom of the curve, Cmean stays stable and has a slight increase.
5.2.3. Fabric Anisotropy
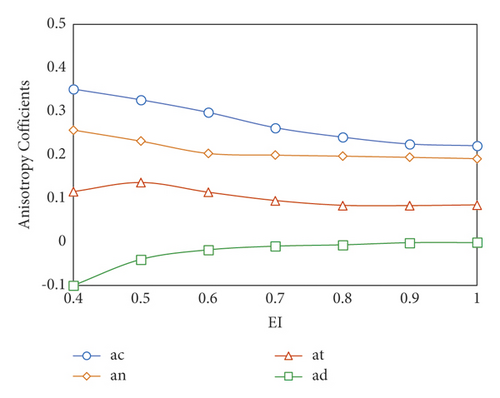
Figure 16 shows the change curves of the fabric anisotropy coefficients with respect to EI. Among all coefficients, ac, an, and at slightly decrease with the increase of EI, that is, the anisotropy degree of the normal contact force and tangential contact force decreases with EI collapsing. On the contrary, ad shows a positive correlation with EI, indicating that the anisotropy degree of branch vector declines with EI increasing. Furthermore, ad slightly stabilizes to 0 with EI increasing from 0.4 to 1.0, showing that the anisotropy of branch vector almost disappears. Thus, the degree of fabric anisotropy decreases with EI decreasing. Note that when EI ≥ 0.8, the fabric anisotropy coefficients stay relatively stable; thus, the degree of fabric anisotropy is not affected by EI.
6. Application to DEM Simulation of GCS Shear Behavior
6.1. Simulation of Biaxial Compression Test
6.2. Analysis of Macro-Meso Parameter
6.2.1. Analysis of Stress Ratio
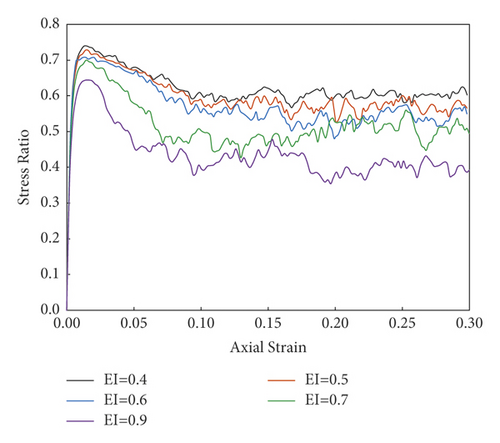
For different EI values of samples, Figure 17 shows the variation of the stress ratio q/p′ with the axial strain ε1. In the initial stage, as the axial strain increases, the stress ratio of all samples rises significantly. After increasing to a peak value, the stress ratio slightly descends and tends to stabilize.
6.2.2. Analysis of Volumetric Deformation
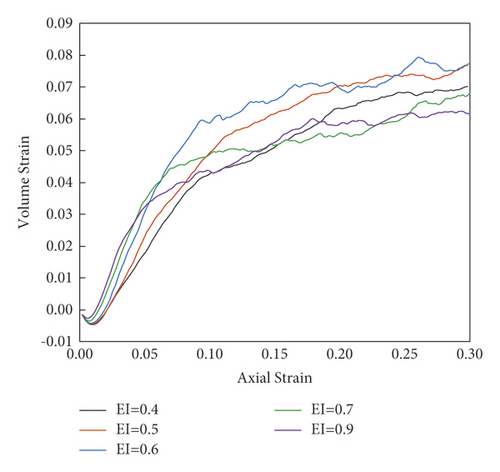
As shown in Figure 18, in the initial stage, the volume strain descends with the ascent of the axial strain. After the axial strain reaches about 1%, the volume strain reverses. As the axial strain increases to a range of 20% to 30% which is a critical state, the volume deformation of the sample remains constant, which indicates that all samples show shear-induced dilatancy deformation with strain softening. Moreover, as the sample gets a steady state, the volume strain shows a negative correlation with the EI value. Therefore, a sample with a smaller EI value has stronger dilatancy.
6.2.3. Analysis of Mean Coordination Number
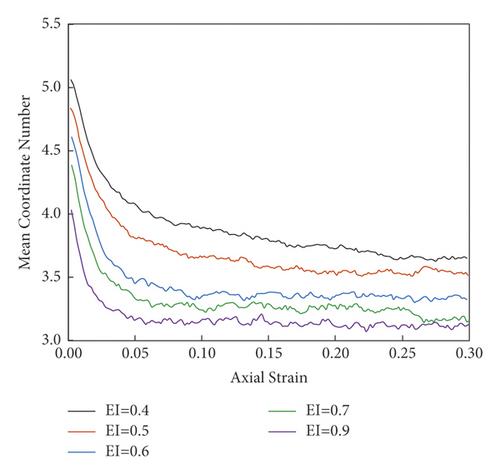
In this section, we focus on the mean coordination number (MCN), which can reflect the microscopic packing structure of the simulated GCS. The evolution of MCN versus axial strain is illustrated in Figure 19 for samples with various values. In the beginning stage of shear, the MCN of samples decreases significantly with axial strain. Then, MCN declines with a lower speed when the axial strain is greater than 2%. When the axial strain is greater than 10%, the MCN is roughly steady. Then, as the EI value rises from 0.4 to 0.9, the MCN collapses from 5.0 to 4.0; thus, a negative correlation with the EI value can be found.
6.2.4. Analysis of Sliding Contact Percentage
7. Conclusion
- (1)
The realistic particle contour is first automatically extracted based on digital image processing and deep learning algorithms. The lightweight U-NET model is trained and the results show the accuracy of the training set reached a value of 97% and the loss value is about 0.01.
- (2)
The elongation (EI), roundness (Rd), and roughness (Rg) of GCS are quantified by shape evaluation algorithms.
- (3)
Based on the establishment of the GCS shape library, the gravity deposition with various elongation is simulated using the discrete element method to study the packing properties of GCS. The elongation effects on the macroscopic and microscopic quantities are explored. The results illustrate that the void ratio decreases with increasing elongation before a reflection point where EI value is 0.9. Similar to the void ratio, the mean coordinate number Cmean exhibits a decreasing trend with EI increasing. After reaching the bottom of the curve, Cmean stays stable and has a slight increase.
- (4)
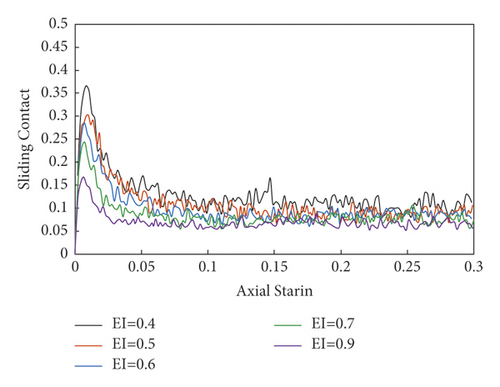
The shear behavior of GCS is studied by simulation of the biaxial compression test. The stress ratio of all samples increases rapidly, and then reaches the peak stage, after which the stress ratio gradually decreases and tends to stabilize. The volume strain decreases with the increase of the axial strain, and when the axial strain reaches about 1%, the volume strain reverses. Then, in the range of 20% to 30%, the volume strain stays constant, indicating a shear-induced dilatancy deformation accompanied by strain softening. The mean coordinate number of all samples increases with axial strain at the beginning; then, after the value of axial strain reaching 2%, the MCN reaches its peak and decreases to be stable when the axial strain is greater than 10%. The variation of the percentage of sliding contact SP with the axial strain of all samples is basically the same. As ε1 increases, SP rapidly increases to a peak value and then gradually decreases to a stable value.
Conflicts of Interest
The authors declare that they have no conflicts of interest.
Acknowledgments
This research was funded by the Ministry of Transport of China (Grant no. 2020-MS5-145) and the State Archives Bureau of China (Grant no. 2021-X-45).
Open Research
Data Availability
The data used in the paper are including in the article.


