Gene Expression, Network Analysis, and Drug Discovery of Neurofibromatosis Type 2-Associated Vestibular Schwannomas Based on Bioinformatics Analysis
Abstract
Neurofibromatosis Type 2- (NF2-) associated vestibular schwannomas (VSs) are histologically benign tumors. This study aimed to determine disease-related genes, pathways, and potential therapeutic drugs associated with NF2-VSs using the bioinformatics method. Microarray data of GSE108524 were downloaded from the Gene Expression Omnibus (GEO) database, and differentially expressed genes (DEGs) were screened using GEO2R. The functional enrichment and pathway enrichment of DEGs were performed using Gene Ontology (GO) and Kyoto Encyclopedia of Genes Genomes (KEGG). Furthermore, the STRING and Cytoscape were used to analyze the protein-protein interaction (PPI) network of all differentially expressed genes and identify hub genes. Finally, the enriched gene sets belonging to the identified pathways were queried against the Drug-Gene Interaction database to find drug candidates for topical use in NF2-associated VSs. A total of 542 DEGs were identified, including 13 upregulated and 329 downregulated genes, which were mainly enriched in terms of focal adhesion, PI3K-Akt signaling pathway, ECM-receptor interaction, Toll-like receptor signaling pathway, Rap1 signaling pathway, and regulation of actin cytoskeleton. 28 hub genes were identified based on the subset of PPI network, and 31 drugs were selected based on the Drug-Gene Interaction database. Drug discovery using bioinformatics methods facilitates the identification of existing or potential therapeutic drugs to improve NF2 treatment.
1. Introduction
VSs, also known as acoustic neuromas, are histologically benign tumors originating from the eighth nerve. NF2 is a rare autosomal dominant inherited disorder tumor caused by deletion or loss-of-function mutations in the NF2 gene encoding merlin [1]. The main characteristic of NF2-associated VSs is the bilateral schwannomas of the vestibular nerve, which leads to sensorineural hearing loss, facial paralysis, vestibular dysfunction, brainstem compression, and even death [2]. Despite their benign nature, NF2-associated VSs have poor prognosis prone to recurrence, and there are no curative treatments. At present, the primary treatments are follow-up observation, microsurgery, and radiosurgery which are not always effective and sometimes cause neurological deficits [3]. Patients with hearing loss sometimes accept the otolaryngology surgery and require improving or saving hearing. With the targeted molecular therapies becoming increasingly common, drug therapy has gradually become possible. Therefore, it is urgently required to determine effective drug targets for NF2-associated VSs therapies. The present study aimed to determine disease-related genes, pathways, and potential targeted therapeutic drugs associated with NF2-associated VSs using the bioinformatics method.
2. Materials and Methods
2.1. Microarray Datasets
The gene expression profile GSE108524 of the NF2-associated VSs and normal nerve groups was obtained from the NCBI GEO database. These microarray data were based on GPL17586 Platform [HTA-2_0] Affymetrix Human Transcriptome Array 2.0 [transcript (gene) version], including 17 NF2-associated VSs tissues and 4 normal nerves.
2.2. Identification of DEGs
GEO2R (http://www.ncbi.nlm.nih.gov/geo/geo2r/), a web tool based on the analysis of variance or t-test, was used to identify DEGs between NF2-associated VSs tissues and normal nerves. The DEGs were identified as the genes with |log FC| ≥ 1.5 and adj. P < 0.05.
2.3. Functional and Pathway Enrichment Analysis of DEGs
The Database for Annotation, Visualization, and Integrated Discovery (DAVID) (Version 6.8, https://david.ncifcrf.gov/) was used to perform GO and KEGG pathway enrichment analysis of DEGs. GO analysis contains biological process (BP), cellular component (CC), and molecular function (MF). GO term with the criterion of P < 0.05 and false discovery rate (FDR) < 0.05 and KEGG pathway analysis with the criterion of P < 0.05 were considered statistically significant.
2.4. Protein-Protein Interaction (PPI) Network Analysis
We submitted DEGs in Search Tool for the Retrieval of Interacting Genes database (STRING, http://www.string-db.org/) to screen the PPI pairs with a combined score of ≥0.4 and visualized the interaction using Cytoscape software (Version 3.7.0.). Finally, CentiScaPe and Molecular Complex Detection (MCODE), a Cytoscape plugin, were utilized to screen PPI network key genes. The default parameters of MCODE were used: degree cutoff ≥2, node score cutoff ≥0.2, k-score ≥ 2, and maximum depth = 100.
2.5. Drug-Gene Interaction Analysis
To better identify potential targeted therapeutic drugs for NF2-associated VSs, the hub genes were mapped onto the Drug-Gene Interaction database (DGIdb; http://www.dgidb.org) to obtain potential drug target genes and potential NF2-associated VSs treatment drugs. Visualization of the drug-gene interaction was generated using Cytoscape software (Version 3.7.0.). In addition, ClinicalTrials.gov (https://clinicaltrials.gov) was used to identify whether drugs have been previously investigated or are being currently tested in clinical trials.
2.6. Human NF2-Associated VSs Specimens
Human NF2-associated VSs tissues with the matched normal adjacent specimens were obtained from the Second Hospital of Guangxi Medical University. This study was approved by the Ethics Committee of the Second Hospital of Guangxi Medical University.
2.7. Quantitative PCR (qPCR)
Reverse transcription was carried out using SYBR premix EX Taq (Takara, Japan), and SYBR Premix Ex Taq II (Takara) was used for qPCR. We used several sequences: EGFR forward primer 5′-CTACAACCCCACCACGTACC-3′ and reverse primer 5′-CGCACTTCTTACACTTGCGG-3′; GAPDH forward primer 5′-CTTCGCTCTCTGCTCCTCCTGTTCG-3′ and reverse primer 5′-ACCAGGCGCCCAATACGACCAAAT-3. The results were calculated using the 2−ΔΔCt method.
2.8. Statistical Analysis
Statistical analysis was conducted by SPSS 20.0 software. The statistical significance between groups was determined using a two-tailed Student’s t-test. Values of P < 0.05 were considered to indicate statistically significant differences.
3. Results
3.1. Identification of DEGs
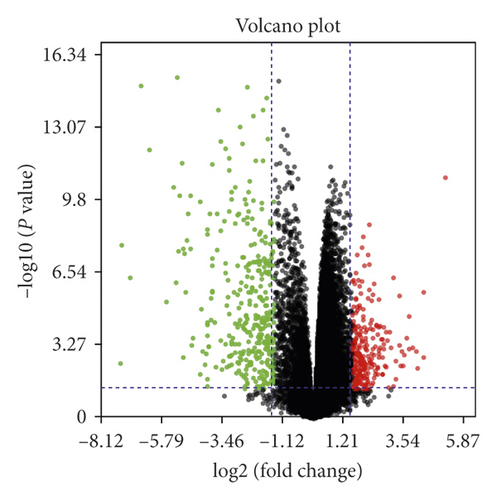
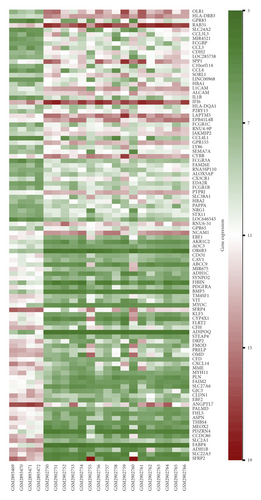
A total of 542 DEGs, including 13 upregulated and 329 downregulated genes, were identified by comparing 17 NF2-associated VSs tissues and 4 normal nerves from GSE108524. The heat map and volcano plot showed these DEGs (Figure 1).
3.2. Functional Annotation and Pathway Enrichment Analysis of DEGs
GO functional annotation revealed that the DEGs were significantly enriched in BP terms including cell adhesion, inflammatory response, immune response, signal transduction, positive regulation of protein kinase B signaling, positive regulation of ERK1 and ERK2 cascade, and positive regulation of GTPase activity. In addition, the CC terms mainly showed plasma membrane, extracellular exosome, extracellular region, extracellular matrix, and membrane raft. MF enrichment indicated heparin binding and integrin binding (Table 1). Furthermore, KEGG pathway enrichment analysis revealed focal adhesion, PI3K-Akt signaling pathway, ECM-receptor interaction, Toll-like receptor signaling pathway, Rap1 signaling pathway, and regulation of actin cytoskeleton (Table 2).
| Category | Term | Count | P value | FDR |
|---|---|---|---|---|
| BP | GO:0007155 ∼ cell adhesion | 38 | <0.001 | <0.001 |
| BP | GO:0006954 ∼ inflammatory response | 34 | <0.001 | <0.001 |
| BP | GO:0006955 ∼ immune response | 32 | <0.001 | <0.001 |
| BP | GO:0007165 ∼ signal transduction | 58 | <0.001 | 0.0054 |
| BP | GO:0051897 ∼ positive regulation of protein kinase B signaling | 12 | <0.001 | 0.0203 |
| BP | GO:0070374 ∼ positive regulation of ERK1 and ERK2 cascade | 17 | <0.001 | 0.0261 |
| BP | GO:0043547 ∼ positive regulation of GTPase activity | 34 | <0.001 | 0.0265 |
| BP | GO:0030198 ∼ extracellular matrix organization | 18 | <0.001 | 0.0285 |
| BP | GO:0030335 ∼ positive regulation of cell migration | 17 | <0.001 | 0.0488 |
| CC | GO:0005615 ∼ extracellular space | 87 | <0.001 | <0.001 |
| CC | GO:0005887 ∼ integral component of plasma membrane | 88 | <0.001 | <0.001 |
| CC | GO:0005886 ∼ plasma membrane | 177 | <0.001 | <0.001 |
| CC | GO:0005578 ∼ proteinaceous extracellular matrix | 31 | <0.001 | <0.001 |
| CC | GO:0009986 ∼ cell surface | 42 | <0.001 | <0.001 |
| CC | GO:0070062 ∼ extracellular exosome | 121 | <0.001 | <0.001 |
| CC | GO:0005576 ∼ extracellular region | 81 | <0.001 | <0.001 |
| CC | GO:0031012 ∼ extracellular matrix | 28 | <0.001 | <0.001 |
| CC | GO:0009897 ∼ external side of plasma membrane | 21 | <0.001 | <0.001 |
| CC | GO:0045121 ∼ membrane raft | 20 | <0.001 | 0.0020 |
| CC | GO:0016021 ∼ integral component of membrane | 179 | <0.001 | 0.0020 |
| CC | GO:0005925 ∼ focal adhesion | 27 | <0.001 | 0.0122 |
| CC | GO:0045202 ∼ synapse | 17 | <0.001 | 0.0224 |
| MF | GO:0008201 ∼ heparin binding | 20 | <0.001 | <0.001 |
| MF | GO:0005178 ∼ integrin binding | 14 | <0.001 | 0.0041 |
| Term | Count | P value | Genes |
|---|---|---|---|
| hsa05150: staphylococcus aureus infection | 13 | <0.001 | C3AR1, C3, HLA-DRB3, FPR1, C1R, C1S, HLA-DQA1, FCGR1A, CFH, FCGR3A, CFD, SELPLG, FCGR3B |
| hsa04145: phagosome | 19 | <0.001 | MRC1, NOS1, OLR1, C3, TUBB2A, HLA-DRB3, TLR2, HLA-C, C1R, TLR6, HLA-DQA1, CYBB, CD36, FCGR1A, COMP, CLEC7A, FCGR3A, FCGR3B, THBS4 |
| hsa04514: cell adhesion molecules (CAMs) | 16 | <0.001 | CLDN19, HLA-DRB3, HLA-C, L1CAM, NLGN3, CDH2, HLA-DQA1, CDH5, ALCAM, NCAM1, CD86, CD34, ITGA8, CLDN1, CD4, SELPLG |
| hsa04640: hematopoietic cell lineage | 12 | <0.001 | CR1, CD37, CD36, CD34, HLA-DRB3, FCGR1A, MME, IL1B, CD4, ANPEP, CSF2RA, CSF1R |
| hsa05144: malaria | 9 | <0.001 | CR1, CD36, COMP, TLR2, IL1B, HBA2, HBA1, HBB, THBS4 |
| hsa04610: complement and coagulation cascades | 10 | <0.001 | C3AR1, VWF, CR1, C3, F13A1, CFH, TFPI, C1R, C1S, CFD |
| hsa04510: focal adhesion | 17 | 0.0017 | PIK3CG, EGFR, CAV1, TNXB, TNC, FLNB, MYL9, VWF, CCND1, PAK3, CCND2, COMP, ITGA8, COL6A3, PDGFRA, SPP1, THBS4 |
| hsa04060: cytokine-cytokine receptor interaction | 18 | 0.0022 | EGFR, CCL3, TGFBR1, LIFR, EDA2R, CCL4L1, CCL4, CXCL12, IL17RA, LEP, PPBP, CXCL14, CCL3L3, CX3CR1, PDGFRA, IL1B, CSF2RA, CSF1R |
| hsa05140: leishmaniasis | 9 | 0.0027 | CR1, C3, HLA-DRB3, FCGR1A, TLR2, IL1B, FCGR3A, FCGR3B, HLA-DQA1 |
| hsa04151: PI3K-akt signaling pathway | 23 | 0.0033 | EGFR, PIK3CG, FGF7, TNXB, TNC, TLR2, FGF10, IRS1, DDIT4, VWF, CCND1, LPAR5, CCND2, COMP, ITGA8, COL6A3, PDGFRA, MDM2, ANGPT1, FGF1, SPP1, THBS4, CSF1R |
| hsa00350: tyrosine metabolism | 6 | 0.0063 | MAOA, AOX1, ADH1C, ADH1B, ADH1A, AOC3 |
| hsa03320: PPAR signaling pathway | 8 | 0.0075 | LPL, CD36, OLR1, PLIN1, SLC27A6, FABP4, ACADL, ADIPOQ |
| hsa04512: ECM-receptor interaction | 9 | 0.0094 | VWF, CD36, TNXB, COMP, TNC, ITGA8, COL6A3, SPP1, THBS4 |
| hsa04620: Toll-like receptor signaling pathway | 10 | 0.0100 | PIK3CG, CD86, CCL3, CCL3L3, TLR2, CCL4L1, IL1B, TLR6, CCL4, SPP1 |
| hsa05323: rheumatoid arthritis | 9 | 0.0101 | CD86, CCL3, HLA-DRB3, CCL3L3, TLR2, IL1B, ANGPT1, CXCL12, HLA-DQA1 |
| hsa05218: melanoma | 8 | 0.0103 | PIK3CG, EGFR, CCND1, FGF7, PDGFRA, MDM2, FGF10, FGF1 |
| hsa04015: Rap1 signaling pathway | 15 | 0.0126 | FYB, PIK3CG, EGFR, FGF7, FPR1, FGF10, APBB1IP, DOCK4, PLCB4, LPAR5, RASGRP3, PDGFRA, ANGPT1, FGF1, CSF1R |
| hsa05416: viral myocarditis | 7 | 0.0126 | CAV1, CD86, CCND1, HLA-DRB3, SGCD, HLA-C, HLA-DQA1 |
| hsa04730: long-term depression | 7 | 0.0160 | PLA2G4A, PLCB4, NOS1, GRIA2, LYN, GUCY1A2, GUCY1B3 |
| hsa05206: microRNAs in cancer | 18 | 0.0176 | EGFR, TNXB, CYP1B1, TNC, MIRLET7F1, MIR99A, ZEB1, MIR222, MIR221, IRS1, DDIT4, NOTCH3, CCND1, CCND2, PDGFRA, MDM2, MARCKS, MIR181B2 |
| hsa05152: tuberculosis | 13 | 0.0178 | MRC1, CR1, ITGAX, C3, FCGR1A, HLA-DRB3, TLR2, IL1B, CLEC7A, FCGR3A, TLR6, FCGR3B, HLA-DQA1 |
| hsa05205: proteoglycans in cancer | 14 | 0.0191 | PIK3CG, EGFR, CAV1, LUM, FZD1, TLR2, DCN, FLNB, CCND1, CBLB, GPC3, RRAS2, MDM2, PTCH1 |
| hsa05143: African trypanosomiasis | 5 | 0.0250 | PLCB4, IL1B, HBA2, HBA1, HBB |
| hsa05332: graft-versus-host disease | 5 | 0.0250 | CD86, HLA-DRB3, IL1B, HLA-C, HLA-DQA1 |
| hsa05142: Chagas disease (American trypanosomiasis) | 9 | 0.0254 | PIK3CG, CCL3, PLCB4, C3, TGFBR1, CCL3L3, TLR2, IL1B, TLR6 |
| hsa05200: pathways in cancer | 22 | 0.0267 | EGFR, PIK3CG, FGF7, TGFBR1, FZD1, RUNX1T1, FGF10, CXCL12, CBLB, CCND1, PLCB4, LPAR5, RASGRP3, SLC2A1, PDGFRA, MDM2, PTCH1, PTCH2, HHIP, FGF1, CSF2RA, CSF1R |
| hsa04810: regulation of actin cytoskeleton | 14 | 0.0282 | PIK3CG, EGFR, FGF7, FGF10, NCKAP1L, MYL9, ARPC1B, ITGAX, CHRM3, PAK3, ITGA8, RRAS2, PDGFRA, FGF1 |
| hsa04380: osteoclast differentiation | 10 | 0.0349 | PIK3CG, CYBB, FCGR1A, TGFBR1, IL1B, FCGR3A, TREM2, FCGR3B, CSF1R, BLNK |
3.3. PPI Network Analysis
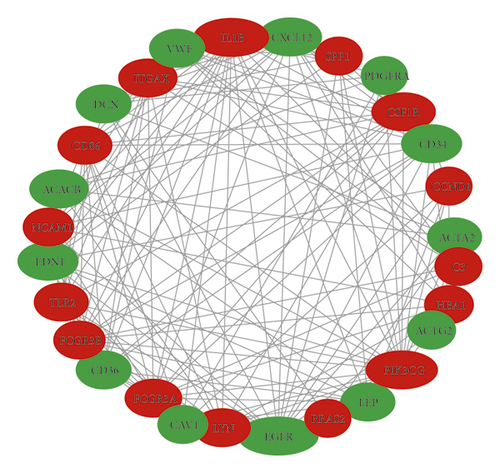
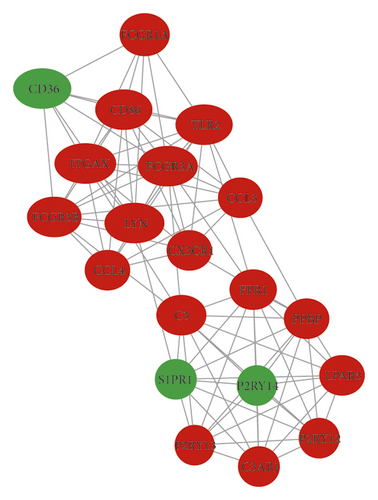
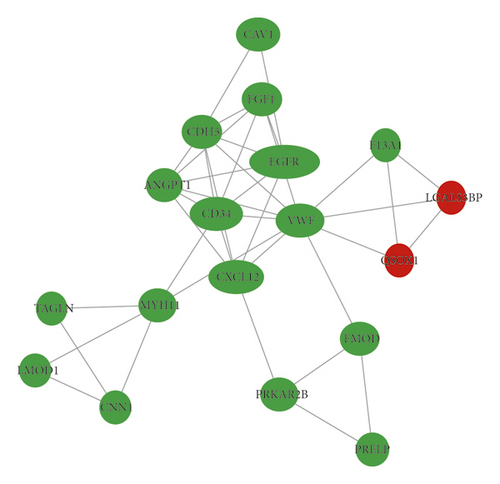
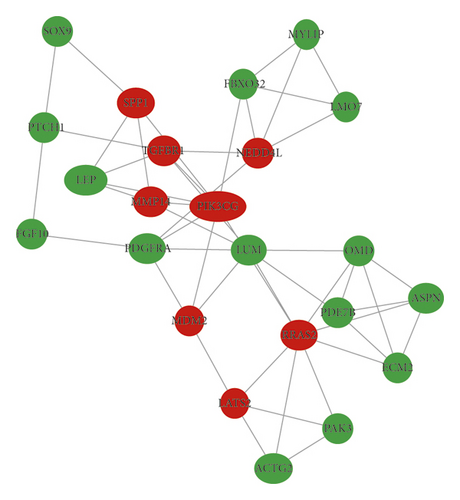
In total, we made the PPI network of 369 nodes and 1,322 edges, based on the STRING database (Figure 2(a)). We identified 28 hub genes with connectivity degree ≥20 (Figure 2(b), Table 3). Then, using MCODE, three modules with scores >4.5 and a number of nodes >18 were selected. Module 1 with a score of 9.368 consisted of 20 nodes and 89 edges (Figure 2(c)), module 2 with a score of 4.588 comprised 18 nodes and 39 edges (Figure 2(d)), and module 3 with a score of 4.455 comprised 23 nodes and 49 edges (Figure 2(e)).

| Number | Gene | Degree of connectivity | Regulation |
|---|---|---|---|
| 1 | EGFR | 59 | Down |
| 2 | IL1B | 53 | Up |
| 3 | PIK3CG | 49 | Up |
| 4 | CSF1R | 40 | Up |
| 5 | CXCL12 | 39 | Down |
| 6 | CD34 | 36 | Down |
| 7 | EDN1 | 36 | Down |
| 8 | ITGAX | 34 | Up |
| 9 | ACACB | 34 | Down |
| 10 | LYN | 32 | Up |
| 11 | FCGR3A | 32 | Up |
| 12 | DCN | 30 | Down |
| 13 | CD36 | 30 | Down |
| 14 | VWF | 30 | Down |
| 15 | CD86 | 29 | Up |
| 16 | TLR2 | 29 | Up |
| 17 | ACTA2 | 29 | Down |
| 18 | LEP | 29 | Down |
| 19 | FCGR3B | 26 | Up |
| 20 | NCAM1 | 25 | Up |
| 21 | CAV1 | 24 | Down |
| 22 | HBA1 | 23 | Up |
| 23 | ACTG2 | 22 | Down |
| 24 | SPP1 | 21 | Up |
| 25 | C3 | 21 | Up |
| 26 | PDGFRA | 20 | Down |
| 27 | CCND1 | 20 | Up |
| 28 | RRAS2 | 20 | Up |
3.4. Drug-Gene Interaction Analysis
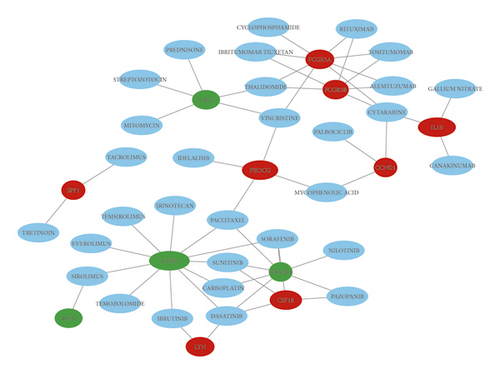
Based on the DGIdb, we use the 28 hub genes to screen for drug-gene interactions, which revealed that 31 drugs associated with 12 key genes may be potential NF2 treatment drugs (Figure 3). Based on ClinicalTrials.gov, we found that nilotinib was previously investigated for Phase 2 of growing VSs treatment and everolimus is being used in Phase 2 of the NF2 treatment study.
3.5. mRNA Expression Levels of EGFR
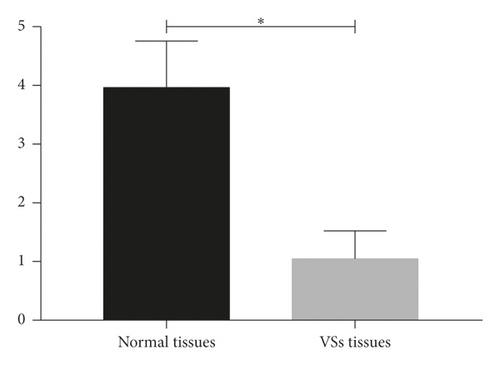
qPCR analysis verified EGFR mRNA underexpression levels in the NF2-associated VSs tissues (Figure 4).
4. Discussion
In this study, we found that the 28 hub genes had been insufficiently studied or not studied at all in VSs, 12 of which may be target genes for potential NF2 treatment drugs. Among these genes, IL1B, PIK3CG, CSF1R, LYN, FCGR3A, FCGR3B, SPP1, and CCND1 were upregulated in NF2-associated VSs, while EGFR, DCN, VWF, and PDGFRA were downregulated. Then, LYN, FCGR3A, and FCGR3B are involved in “module 1” of the subnetwork, in which GO functional annotation is enriched in inflammatory response and immune response, and KEGG pathway enrichment analysis is enriched in staphylococcus aureus infection, phagosome, and osteoclast differentiation. EGFR and VWF are involved in “module 2,” which is enriched in focal adhesion and PI3K-Akt signaling pathway. PIK3CG and SPP1 are involved in “module 3,” which is also enriched in focal adhesion and PI3K-Akt signaling pathway.
We found that upregulated genes PIK3CG, CSF1R, SPP1, and CCND1 and downregulated genes EGFR and VWF were significantly enriched in PI3K-Akt signaling pathway involved in VSs development, which can increase schwannoma cell proliferation, survival, and cell-matrix adhesion acting [4–6]. That may be the cause of poor prognosis in NF2-associated VSs. The drugs that inhibit the PI3K-Akt signaling pathway may be a potential therapeutic strategy for NF2 by antitumor activity against NF2-related tumor cells.
Merlin, a tumor suppressor, is constantly inactivated in NF2-associated VSs. SPP1, also known as osteopontin (OPN), is a secreted, integrin-binding phosphoprotein. OPN had been insufficiently studied in VSs, while elevated OPN is a utility of some tumors progression and metastasis, suggesting a poor prognosis, such as breast cancer [7]. Morrow et al. study [7] revealed that OPN-initiated signaling induced Akt-mediated phosphorylation and degradation of merlin in breast cancer cells; it was reported for the first time that OPN is involved in merlin protein degradation. We showed that SPP1 is upregulated in NF2-associated VSs, consistent with the result of Torres-Martin et al. [8]. SPP1 may be a biomarker of NF2-associated VSs, whose interaction with merlin has not been reported in NF2-associated VSs. Furthermore, we found that drugs associated with SPP1, including tacrolimus and tretinoin, may be potential therapeutic agents for NF2-associated VSs, which require a one-step study. Tacrolimus, a powerful immunosuppressant, significantly increased OPN mRNA and protein expression from kidney tissue and renal cells, which may contribute to nephrotoxicity inducing [9]. However, tacrolimus used to treat autoimmunity blocks IL2 production and is used for active rheumatoid arthritis [10] and lupus nephritis [11]. Based on functional annotation and pathway enrichment analysis of DEGs, inflammatory response, immune response, melanoma, and rheumatoid arthritis may be connected with NF2-associated VSs development. Therefore, tacrolimus may be used for NF2-associated VSs treatment.
In our study, CCND1 involved in apoptosis and cell cycle control, a key cell cycle regulatory protein, was upregulated in NF2-associated VSs, which is consistent with previous studies [12, 13]. Elevated CCND1 is known to suggest poor prognosis in many cancers, such as colorectal cancer [14], breast cancer [15], and multiple myeloma [16, 17]. We found drugs associated with CCND1, including palbociclib and mycophenolic acid, which had not been studied in VSs. Palbociclib, a cyclin-dependent kinase 4 and 6 (CDK4/6) inhibitor, prolongs progression-free survival among patients with advanced estrogen receptor-positive and HER2-negative breast cancer [18, 19]. Mycophenolic acid, an immunosuppressant, can inhibit proliferation and induce apoptosis in cancer cells, which may be caused by inhibition of upregulation of CCND1 and the PI3K/AKT/mTOR pathway [20]. Very interestingly, CCND1 was also upregulated in NF2-associated VSs and was significantly enriched in the PI3K-Akt signaling pathway in this study. Thus, palbociclib and mycophenolic acid may inhibit the growth of NF2-associated VSs.
In contrast to SPP1 and CCND1, EGFR was downregulated in NF2-associated VSs, in agreement with the results of Torres-Martin et al. [8], but contrary to those of Yi et al. [21]. At present, the efficacy of EGFR inhibitors in acoustic neuroma treatment is not ideal yet, which may be related to EGFR downregulated in some patients.
In conclusion, with the present analysis, we identified 28 drugs not yet tested in NF2-associated VSs. Tacrolimus, palbociclib, and mycophenolic acid may be candidate drugs. SPP1 and CCND1 may be potential targeted genes in NF2-associated VSs. PI3K-Akt signaling pathway may be involved in VSs development.
Conflicts of Interest
All authors declare that they have no conflicts of interest.
Acknowledgments
The authors greatly appreciate the financial support from the General Program of Natural Science Foundation of Guangxi Province of China (no. 2016GXNSFAA380150) and NSFC Cultivation Project of the Second Affiliated Hospital of Guangxi Medical University (GJPY2019001).
Open Research
Data Availability
The data used to support the findings of this study are available from the corresponding author upon request.


