Comparative Proteomic Investigation of Plasma Reveals Novel Potential Biomarker Groups for Acute Aortic Dissection
Abstract
Acute aortic dissection (AAD) is a catastrophic cardiovascular disease with high disability and mortality due to multiple fatal complications. However, the molecular changes of the serum proteome after AAD are not very clear. Here, we performed isobaric tags for relative and absolute quantitation- (iTRAQ-) based comparative proteomic analysis to investigate the proteome profile changes after AAD by collecting plasma samples from 20 AAD patients and 20 controls. Out of the 345 identified proteins, 266 were considered as high-quality quantified proteins (95%confident peptides ≥ 2), of which 25 proteins were accumulated and 12 were reduced in AAD samples. Gene ontology enrichment analysis showed that the 25 AAD-accumulated proteins were enriched in high-density lipoprotein particles for the cellular component category and protein homodimerization acidity for the molecular function category. Protein-protein interaction network analysis showed that serum amyloid A proteins (SAAs), complement component proteins, and carboxypeptidase N catalytic chain proteins (CPNs) possessed the key nodes of the network. The expression levels of six selected AAD-accumulated proteins, B2-GP1, CPN1, F9, LBP, SAA1, and SAA2, were validated by ELISA. Moreover, ROC analysis showed that the AUCs of B2-GP1 and CPN1 were 0.808 and 0.702, respectively. Our data provide insights into molecular change profiles in proteome levels after AAD and indicate that B2-GP1 and CPN1 are potential biomarkers for AAD.
1. Introduction
Acute aortic dissection (AAD) is a catastrophic cardiovascular disease caused by injury of the innermost layer of the aorta, leading to vascular wall stratification by blood flows between the layers of the aortic wall [1, 2]. Although treatment guidelines have been well established, AAD has high fatality caused by irreversible vascular damage before the patient arrives at the hospital [3]. The risk of death increases by 1% to 3% per hour before surgery or medicinal treatment and can be as high as 21% for 24 hours and 74% for one week [4]. The key to reduce mortality is to shorten the time from symptom occurrence to receive appropriate treatment [5]. Combined with standard imaging methods using computed tomography angiography (CTA) and magnetic resonance angiography (MRA), quick diagnosis of AAD before the patients’ arrival to the hospital using biomarkers with high sensitivity and specificity will greatly improve the survival rate and treatment guidelines [6–8]. However, most basic level hospitals do not have the equipment to perform CTA and MRA, which makes it more urgent to develop reliable early-stage biomarkers for AAD. Numerous potential biomarkers for diagnosis and prognosis of AAD were reported previously, such as D-dimer, microRNA-23a, magnitude soluble ST2, C-reactive protein (CRP), and smooth muscle myosin heavy chain (SM-MHC) [9–13]. However, all these potential biomarkers have disadvantages in specificity or sensitivity.
Proteomic technologies are widely used to profile the whole proteome expressed in specific specimens obtained from patients to determine potential biomarkers in various conditions [14–18]. Mass spectra- (MS-) based technologies have been greatly developed and are the most widely used proteomic approaches for their high throughput and sensitivity [19–21]. However, classic two-dimensional gel electrophoresis-based proteomic technologies are still irreplaceable since they provide a visualization map of the proteome and the truncation or modification information of protein isoforms [22–24]. Isobaric tags for relative and absolute quantitation (iTRAQ) technology is a high-efficiency nongel quantitative proteomic assay particularly suitable to identify biomarkers in low-abundance proteins [25–28]. Previous studies on acute aortic dissection reported several potential biomarkers including Lumican, C-reactive protein, and alpha 1 antitrypsin using iTRAQ and differential in-gel electrophoresis technologies [29, 30]. However, the repeatability, specificity, and sensitivity of these potential biomarkers in enlarged populations remain unclear.
Here, we performed an iTRAQ-based comparable proteomic analysis in the plasma samples obtained from AAD patients (n = 20) and controls (n = 20). Bioinformatic analysis of differenctially expressed proteins (DEPs) showed some enriched pathways related to AAD. Further validations of six selected AAD-accumulated proteins, B2-GP1, CPN1, F9, LBP, SAA1, and SAA2, were performed using an ELISA assay in a larger population (60 AAD samples and 50 control samples). Receiver operating characteristic curve (ROC) analysis showed that the area under curves of B2-GP1 and CPN1 were 0.808 and 0.702, respectively. Our study provided new evidence for potential biomarkers for acute aortic dissection.
2. Material and Methods
2.1. Clinical Samples
From January 2015 to February 2016, a total of 20 acute aortic dissection patients (AAD group) and 20 non-AAD patients (control group) who presented to the First Affiliated Hospital of Xinjiang Medical University (Urumqi, China) were enrolled. For the AAD group, whole blood samples were immediately collected in BD Vacutainer EDTA-2K tubes within 36 hours after onset. For the control group, blood samples were collected with limosis in the early morning, and the plasma was centrifuged at 5,000 rpm for 10 min at 4°C within 1 hour after collection. The plasma samples were then frozen and stored in aliquots at −80°C until protein extraction. Afterward, from March 2016 to February 2017, we continued to collect blood samples of 60 patients with acute aortic dissection within 72 hours after onset and 50 controls with normal coronary angiography as an expanded sample for ELISA. Inclusion criteria were as follows: (1) patients with acute aortic dissection should be confirmed by the aortic CTA or angiography; (2) non-AAD patients should be confirmed by coronary artery angiography. Exclusion criteria were as follows: (1) Marfan’s syndrome, (2) recurrent aortic dissection, (3) familial aortic dissection, and (4) bicuspid aortic valve.
This study was carried out under the approval of the Medical Ethics Committee in the First Affiliated Hospital of Xinjiang Medical University (Approval No. 20160218-20). Written informed consents were obtained from all the participants prior to enrollment.
2.2. Protein Extraction and iTRAQ Analysis
The high-abundance proteins including albumin and IgG in plasma were depleted using a ProteoPrep® Immunoaffinity Albumin & IgG Depletion Kit (Sigma-Aldrich, Shanghai, China). Collected solutions were lysed in lysis buffer (7 M urea, 2 M thiourea, 50 mM Tris, 50 mM DTT, and 1 mM PMSF), and protein contents were determined using the Bradford assay (Bio-Rad, Beijing, China). Labeling for iTRAQ was performed according to the manufacturer’s instruction (Applied Biosystems, Shanghai, China) and as previously described [31, 32]. The isotope tags 114, 115, and 116 were used to label the control group while 117, 118, and 119 were used for the AAD group.
2.3. Bioinformatic Analyses
All the identified proteins were mapped to gene ontology (GO) using BLAST2GO. The GO term enrichment analysis was performed by GOEAST [33]. The protein-protein interaction network was analyzed using STRING [34].
2.4. Verification of Representative DEPs
Six representative DEPs, including beta-2-glycoprotein 1 (B2-GP1), carboxypeptidase N catalytic chain (CPN), coagulation factor IX (F9), lipopolysaccharide-binding protein (LBP), serum amyloid A-1 protein (SAA1), and serum amyloid A-2 protein (SAA2), were selected and validated using an enzyme-linked immunosorbent assay (ELISA) kit (Wuhan ColorfulGene Biological Technology, Wuhan, China) in additional AAD (n = 60) and control (n = 50) samples.
2.5. Statistical Analysis
The iTRAQ data were analyzed using ProteinPilot 5.0 (AB Sciex, Shanghai, China) with the threshold of 95%confidential peptides ≥ 2 (unused score > 1.3). All statistical analyses were performed by SPSS 20.0. Different abundant proteins were determined when the P value was <0.05 and fold change was >1.5.
3. Results
3.1. Clinical Characteristics of Patients and Differential Abundant Proteins Identified by iTRAQ
The clinical characteristics of patients with acute artery dissection and the control group are shown in Table 1. No significant difference appears based on age or gender distribution between the AAD and control groups. However, as known risk factors to AAD, hypertension and smoking showed significant differences between the AAD and control groups (P < 0.05, Table 1, iTRAQ section).
| iTRAQ | AAD | Control | P value |
|---|---|---|---|
| n | 20 | 20 | — |
| Age (mean (± SD)) | 47.05 ± 8.01 | 52.15 ± 11.14 | 0.105a |
| Female (n (%)) | 4 (20.0) | 6 (30.0) | 0.465b |
| Male (n (%)) | 16 (80.0) | 14 (70.0) | 0.465b |
| Stanford type A | 0 | — | — |
| Stanford type B | 18 | — | — |
| Intramural hematoma | 2 | — | — |
| Hypertension (n (%)) | 15 (75.0) | 8 (40.0) | 0.025b |
| Diabetes mellitus (n (%)) | 1 | 0 | — |
| Smoking (n (%)) | 14 (70.0) | 7 (35.0) | 0.027b |
| TC (mean (± SD)) | 4.19 ± 1.11 | 3.68 ± 0.93 | 0.130a |
| LDL-C (mean (± SD)) | 2.43 ± 0.76 | 2.26 ± 0.83 | 0.533a |
| HDL-C (mean (± SD)) | 1.15 ± 0.36 | 1.09 ± 0.19 | 0.556a |
| TG (mean (± SD)) | 2.04 ± 1.91 | 1.59 ± 1.04 | 0.375a |
| ELISA | AAD | Control | P value |
| n | 60 | 50 | — |
| Age (mean (± SD)) | 51.43 ± 10.52 | 53.44 ± 10.33 | 0.317a |
| Female (n (%)) | 10 (16.7) | 8 (16.0) | 0.925b |
| Male (n (%)) | 50 (83.3) | 42 (84.0) | 0.925b |
| Stanford type A | 5 | — | — |
| Stanford type B | 45 | — | — |
| Intramural hematoma | 10 | — | — |
| Hypertension (n (%)) | 46 (76.7) | 24 (48.0) | 0.002b |
| Diabetes mellitus (n (%)) | 3 (5.0) | 0 | — |
| Smoking (n (%)) | 32 (53.3) | 26 (52.0) | 0.889b |
| TC (mean (± SD)) | 4.27 ± 0.93 | 3.82 ± 0.84 | 0.010a |
| LDL-C (mean (± SD)) | 2.67 ± 0.70 | 2.42 ± 0.78 | 0.079a |
| HDL-C (mean (± SD)) | 1.15 ± 0.30 | 1.03 ± 0.19 | 0.010a |
| TG (25%–75% percentiles) | 0.82~1.89 | 0.89~1.93 | 0.588c |
- at-test. bChi-square test. cMann-Whitney U test. TC: total cholesterol; LDL-C: low-density lipoprotein-cholesterol; HDL-C: high-density lipoprotein cholesterol; TG: triglyceride.
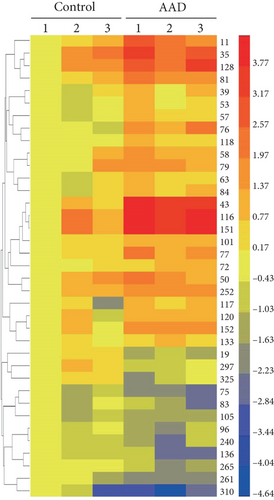
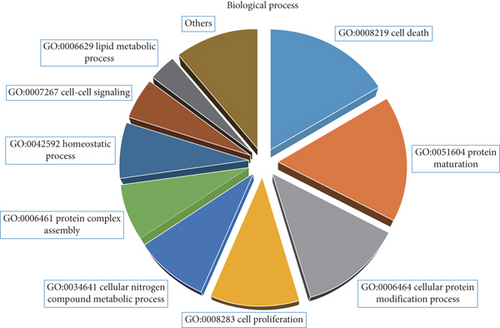
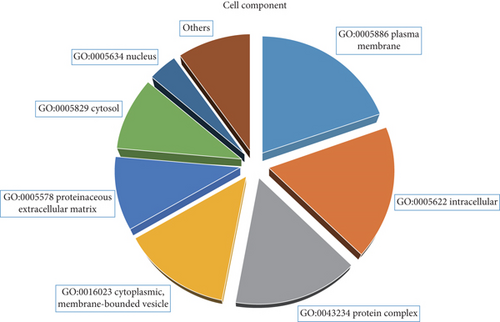
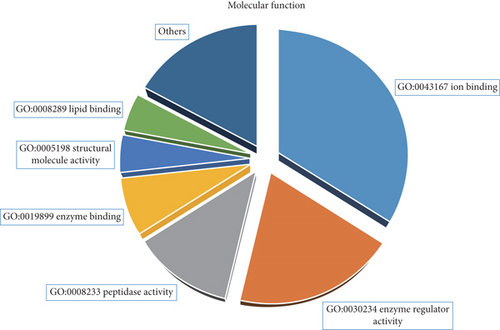
For the high-throughput mass spectra analysis, a total of 621,043 spectra were obtained, in which 208,353 were mapped to peptides in the database searched. In total, 266 high-quality quantified protein groups were identified out of 345 protein groups observed (95%confident peptides ≥ 2, see Table S1). Furthermore, 25 and 12 proteins were determined as accumulated and reduced proteins, respectively (fold change > 1.5, 95%confident peptides ≥ 2), of which detailed information is listed in Table 2. The expression patterns of 37 different abundant proteins are shown in Figure 1(a). The GO term distribution of biological processes, cellular components, and molecular functions was also analyzed. The GO:008219 (cell death), GO:0051604 (protein maturation), and GO:0006464 (cellular protein modification process) are the most abundant GO terms of the biological process category (Figure 1(b)). The GO:0005886 (plasma membrane), GO:0005622 (intracellular), and GO:0043234 (protein complex) are the most abundant GO terms of the cellular component category (Figure 1(c)). The GO:0043167 (ion binding), GO:0030234 (enzyme regulator activity), and GO:0008233 (peptidase activity) are the top three GO terms of the molecular function category (Figure 1(d)).
| N | Name | 95% pep. ∗ | Fold | P value |
|---|---|---|---|---|
| 11 | Haptoglobin | 396 | 3.29 | 0.0113 |
| 35 | Complement component C9 | 41 | 2.51 | 0.0161 |
| 39 | Complement component C7 | 38 | 1.72 | 0.0395 |
| 43 | Serum amyloid A-2 protein | 86 | 8.07 | 0.0003 |
| 50 | Beta-2-glycoprotein 1 | 61 | 1.73 | 0.0429 |
| 53 | Complement C1s subcomponent | 37 | 1.94 | 0.0186 |
| 57 | Pigment epithelium-derived factor | 27 | 1.98 | 0.0091 |
| 58 | Complement factor I | 28 | 2.02 | 0.0274 |
| 63 | Complement component C8 alpha chain | 25 | 1.55 | 0.0337 |
| 72 | Galectin-3-binding protein | 14 | 1.92 | 0.0055 |
| 76 | Leucine-rich alpha-2-glycoprotein | 15 | 4.06 | 0.0035 |
| 77 | Angiotensinogen | 28 | 3.01 | 0.0052 |
| 79 | Carboxypeptidase N subunit 2 | 18 | 1.83 | 0.0371 |
| 81 | Serum amyloid P component | 15 | 2.24 | 0.0065 |
| 84 | Carboxypeptidase N catalytic chain | 10 | 2.13 | 0.0174 |
| 101 | Coagulation factor IX | 13 | 1.82 | 0.0003 |
| 116 | C-reactive protein | 12 | 6.57 | 0.0002 |
| 117 | Complement C1q subcomponent subunit B | 18 | 2.14 | 0.0289 |
| 118 | Protein Z-dependent protease inhibitor | 8 | 1.73 | 0.0048 |
| 120 | Complement C1q subcomponent subunit A | 11 | 1.98 | 0.0070 |
| 128 | Lipopolysaccharide-binding protein | 7 | 2.99 | 0.0055 |
| 133 | Serum amyloid A-4 protein | 14 | 1.77 | 0.0127 |
| 151 | Serum amyloid A-1 protein | 113 | 5.86 | 0.0015 |
| 152 | Complement C1q subcomponent subunit C | 10 | 2.23 | 0.0028 |
| 252 | Fibrinogen beta chain | 3 | 1.87 | 0.0065 |
| N | Name | 95% pep. | Fold | P value |
| 19 | Isoform 10 of fibronectin | 63 | 0.28 | 0.0004 |
| 75 | Histidine-rich glycoprotein | 22 | 0.32 | 0.0111 |
| 83 | Kallistatin | 11 | 0.51 | 0.0381 |
| 96 | Ig kappa chain V-II region RPMI 6410 | 76 | 0.58 | 0.0414 |
| 105 | Peroxiredoxin-2 | 7 | 0.54 | 0.0492 |
| 136 | Coagulation factor XIII A chain | 6 | 0.45 | 0.0309 |
| 240 | eIF 4 gamma 3 | 26 | 0.52 | 0.0239 |
| 261 | Reversed carbonic anhydrase 1 | 2 | 0.27 | 0.0109 |
| 265 | Ig kappa chain V-III region POM | 86 | 0.58 | 0.0231 |
| 297 | Cartilage oligomeric matrix protein | 2 | 0.61 | 0.0308 |
| 310 | Isoform 2 of chondroadherin-like protein | 2 | 0.19 | 0.0420 |
| 325 | A-kinase anchor protein 7 isoform gamma | 2 | 0.55 | 0.0292 |
- ∗Numbers of 95% confidential peptides.
3.2. Gene Ontology Enrichment and Protein-Protein Interaction Networks
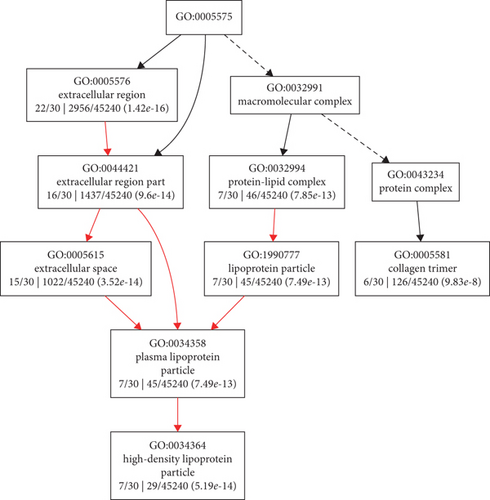
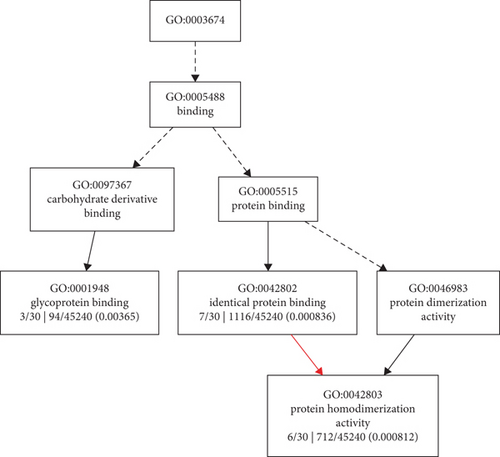
To better understand the biological pathways that the DEPs involved, GO enrichment analysis was performed using Gene Ontology Enrichment Analysis Software Toolkit (GOEAST) [33]. Tree views of the cellular component (Figure 2(a)) and molecular function (Figure 2(b)) categories in which the 25 AAD-induced proteins were enriched are shown. The GO terms of high-density lipoprotein particle (GO:0034364) and collagen trimer (GO:0005581) were the branch-ends for the cellular component category, and glycoprotein binding (GO:0001948) and protein homodimerization activity (GO:0042803) were the branch-ends for the molecular function category. The tree view of the biological process category in which the 25 AAD-induced proteins were enriched is also provided as Supplementary Figure S1.
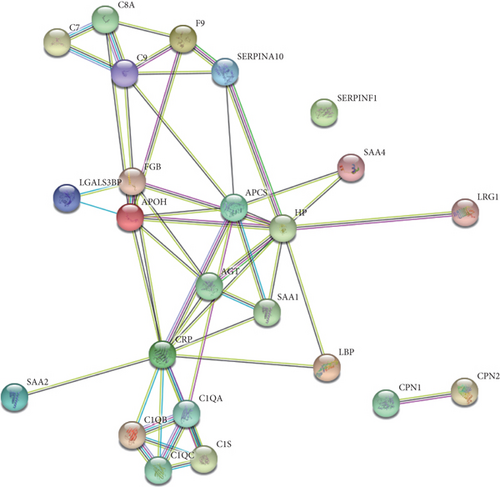
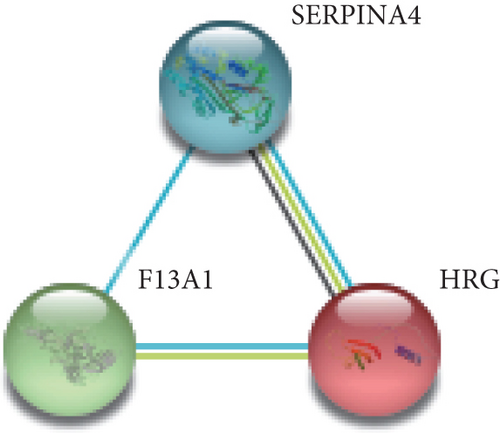
Moreover, protein-protein interaction (PPI) networks of the total 37 DEPs (Figure 3(a)), as well as the 25 AAD-induced proteins (Figure 3(b)) and 12 AAD-reduced proteins (Figure 3(c)), were shown. The PPI of AAD-induced proteins showed that serum amyloid A proteins (SAAs), complement component proteins, and carboxypeptidase N catalytic chain proteins (CPNs) possessed the key nodes of the network (Figure 3(b)), indicating that these proteins may be important for AAD development.

3.3. Potential Biomarker Groups Validated by ELISA in Extended Samples
According to the bioinformatic analyses of the DEPs, several representative proteins were selected as potential biomarkers for AAD to perform further validation using an ELISA assay in extended samples. The selected potential biomarker candidates include beta-2-glycoprotein 1 (B2-GP1), carboxypeptidase N catalytic chain (CPN), coagulation factor IX (F9), lipopolysaccharide-binding protein (LBP), serum amyloid A-1 protein (SAA1), and serum amyloid A-2 protein (SAA2), which are included in significantly enriched GO terms and protein-protein interaction network nodes (Figures 2 and 3). The clinical characteristics information of the 110 (60 AAD and 50 controls) extended patients and control samples is provided in the ELISA section in Table 1.
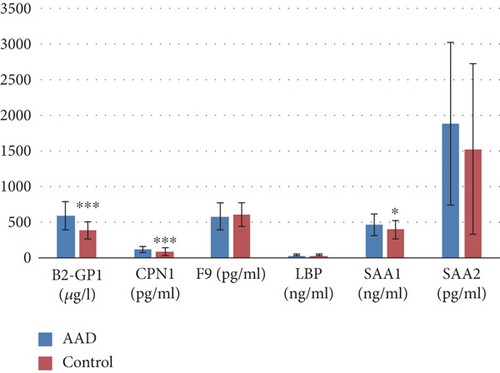
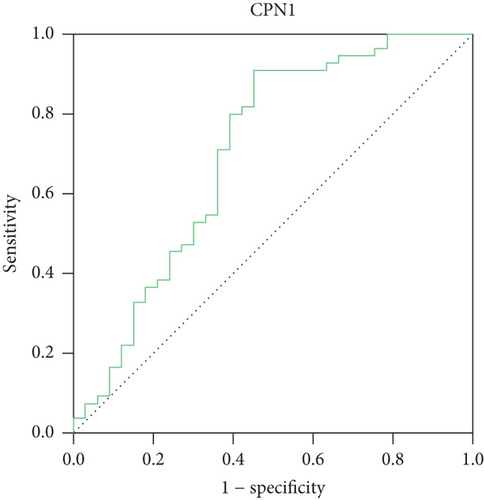
The contents of the candidate proteins in the plasma samples are calculated and shown in Figure 4(a). Significantly different amounts of B2-GP1 (P < 0.001), CPN1 (P < 0.001), and SAA1 (P < 0.05) were found between the control (blue columns) and AAD (orange columns). Furthermore, the receiver operating characteristic (ROC) curves of the 3 biomarker candidates with significant differential amounts between AAD patients and controls are illustrated (Figures 4(b)–4(d)) to assess their abilities to diagnose AAD. As is shown, two candidates including beta-2-glycoprotein 1 (B2-GP1) and carboxypeptidase N catalytic chain (CPN1) exhibited significant specificities to AAD, with the AUC values of 0.808 and 0.702, respectively. The ELISA and ROC curve data indicated that B2-GP1 and CPN1 could potentially serve as novel biomarkers to facilitate the diagnosis of AAD at an early stage. A further investigation of B2-GP1 and SAA1 in patients that recovered from surgery was also performed, resulting in nonsignificant levels of these two proteins between controls and cured patients (Supplementary Figure S2, n = 23).


4. Discussion
The morbidity of AAD increased during recent years accompanied with a high frequency of hypertension and other chronic diseases [35]. About 3/4 of patients are older than 40 years old, and the incidence of male patients is 2–3 times higher than that of women of the same age. Even with modern imaging methods (such as computed tomography and magnetic resonance), AAD is still often overlooked or misdiagnosed often owing to variability in presentation and lack of suspicion by the attending physician, leading to high mortality due to potentially fatal complications with a mortality rate of approximately 1% per hour within the first 24 h after symptom onset [36]. The 24-hour mortality risk is about 21%, and the risk of death within 1 week is about 74%, while the 1-year mortality rate is 93% [37, 38]. To develop novel plasma biomarkers that are more effective and specific to AAD will be helpful for reducing the mortality of AAD, developing individualized treatment for AAD patients, and improving prognosis.
As a high-throughput proteomic technology developed in recent years, iTRAQ technology is an effective method to develop novel serum markers and has been used to identify plasma protein markers for various diseases [39–43]. Previous studies reported potential AAD biomarker candidates discovered by iTRAQ technology [29, 30]. However, limited by the resolution of mass spectrometry, Gu et al. identified only 174 proteins from pooled serum samples, but the different abundant proteins are not reliable due to lack of biological and technical replicates [29]. Likely, Xiao et al. identified 355 proteins, while only 164 proteins reached the strict quantitative standard. The threshold to determine significantly different abundant proteins was not strict (1.2-fold), leading to 125 different abundant proteins out of 164 high-quality quantitative proteins (over 76% proteins are differentially accumulated) [30]. The potential biomarkers reported by these previous works are Lumican, D-dimer, CRP, and TSP-1. However, a single biomarker can only respond to a moment of some physiological and pathological state and is unable to reflect the physiological state of multiple pathologies. These biological markers have poor specificity, as the expression levels were different in various chest diseases. For instance, D-dimer is reported to increase not only in AAD but also in acute myocardial infarction, angina pectoris, and pulmonary embolism disease [44, 45]. We carried out an experiment including pooled biological replicates, as well as technical replicates by labeling samples of each group with three different isobaric tags (114, 115, and 116 for the control group; 117, 118, and 119 for the AAD group). In addition, an advanced AB Sciex TripleTOF 5600 plus system was used to perform the iTRAQ experiment, resulting in 345 identified proteins and 266 high-quality quantified proteins (the most high-quality data of plasma proteomics in AAD to date). A total of 37 different abundant proteins (25 increased and 12 reduced) were identified due to biological and technical replicates, leading to a high reliability of protein expression levels (Figure 1 and Table 2).
The pathway enrichment analysis of the AAD-induced proteins showed that high-density lipoprotein particles and collagen trimers were the branch-ends of significantly enriched GO terms for the cellular component category (Figure 2(a)). This is consistent with the knowledge that high plasma lipid/cholesterol is a risk factor for cardiovascular diseases. Furthermore, the PPI analysis showed that serum amyloid A proteins (SAAs), complement component proteins, and carboxypeptidase N catalytic chain proteins (CPNs) possessed the key nodes of the network (Figure 3(b)), indicating the potential possibility of these proteins to serve as biomarkers. Thus, six of these proteins were selected to be examined in an expanded group of AAD and control plasma samples. Previous proteomic investigation in AAD identified ten significantly differentially expressed proteins between AAD and controls [30], including complement component C9, Lumican, Ceruloplasmin, complement factor B, and CRP, which also showed differential expression levels in this study (Table 2). The ELISA results showed that B2-GP1 and CPN1 have significant ROC curves, indicating the potential possibility of these two proteins as biomarkers (Figures 4(b) and 4(c)). The B2-GP1 is a phospholipid-binding glycoprotein and was reported to be involved in the immune system by directly interacting with membrane Toll-like receptors, resulting in activation of endothelial cells and monocytes and expression of proinflammatory cytokines [46]. The B2-GP1 also has been reported as a potential biomarker for predicting thrombosis after renal transplantation [47]. CPN1 was also reported to be useful in early detection of breast cancer [48]. These independent works suggest that B2-GP1 and CPN1 are involved in human disorders and may serve as potential biomarkers.
In summary, our work provides a comprehensive proteomic investigation for molecular changes after AAD. For the 25 AAD-induced proteins, significantly enriched GO terms of high-density lipoprotein particles and collagen trimers were identified. From the PPI key nodes, six AAD-induced proteins were selected for validation in an expanded group of samples. The ELISA and ROC curve analysis showed that B2-GP1 and CPN1 are significantly accumulated in the plasma of AAD patients and may be potential biomarkers for detecting AAD early.
Ethical Approval
This study was carried under the approval of the Medical Ethics Committee in the First Affiliated Hospital of Xinjiang Medical University (Approval No. 20160218-20).
Consent
Written informed consent was obtained from all the participants prior to enrollment.
Conflicts of Interest
The authors declare no competing financial interests.
Acknowledgments
This work was supported by the National Natural Science Foundation of China (81660085). We thank LetPub (http://www.letpub.com) for its linguistic assistance during the preparation of this manuscript.
Open Research
Data Availability
The mass spectrometry proteomic data have been deposited to the ProteomeXchange Consortium (http://proteomecentral.proteomexchange.org) via the iProX partner repository [49] with the dataset identifier PXD013465.


