An Optimal Control for a Two-Dimensional Spatiotemporal SEIR Epidemic Model
Abstract
In this paper, we present an application of optimal control theory on a two-dimensional spatial-temporal SEIR (susceptible, exposed, infected, and restored) epidemic model, in the form of a partial differential equation. Our goal is to minimize the number of susceptible and infected individuals and to maximize recovered individuals by reducing the cost of vaccination. In addition, the existence of the optimal control and solution of the state system is proven. The characterization of the control is given in terms of state function and adjoint. Numerical results are provided to illustrate the effectiveness of our adopted approach.
1. Introduction
In the literature, there are numerous books and articles [1–7] that deal with epidemic mathematical models. It is well established that human mobility plays an important role in the spread of an epidemic [8–13]. Mathematical modelling of the spread of infectious diseases has an important influence on disease management and control [14–16]. In general, after the initial infection, a host remains in a latency period before becoming infectious, so the population can be divided into four categories: susceptible (S), exposed (E), infected (I), and recovered (R). In this contribution, we treat a model of epidemic type SEIR in which the model takes into account the total population size as a refrain for the transmission of the disease, and it is assumed that it is constant over time. The approach used is based on the work of El Alami Laaroussi et al. [17, 18], which was applied on a SIR model. So, our goal is to characterize optimal control in the form of a vaccination program, maximizing the number of people reestablished and minimizing the number of susceptible, infected people and the cost associated with vaccination over an infinite space and in a time domain. The theory of semigroups and optimal control makes it possible to show the existence of state system solutions and optimal control and to obtain the optimal characterization of this control in terms of state functions and adjoint functions. To illustrate the solutions, based on the numerical results, we find that the use of the vaccine control strategy in the spatial region helps to fight the spread of the epidemic in this region over a period of 60 days. The structure of this article is as follows. Section 2 is devoted to the basic mathematical model and the associated optimal control problem. In Section 3, we prove the existence of a strong global solution for our system. The existence of the optimal solution is proved in Section 4. The necessary optimality conditions are defined in Section 5. As an application, the numerical results associated with our control problem are given in Section 6. Finally, we conclude the paper in Section 7.
2. The Basic Mathematical Model
2.1. The Model
2.2. The Optimal Vaccination
K1, K2, and K3 are constant weights. The cost of vaccination is a nonlinear function of v, and we choose a quadratic function indicating the additional costs associated with high vaccination rates.
- (i)
We put ; we denote by W1,2([0, T], H(Ω)) the space of all absolutely continuous functions y : [0, T]⟶H(Ω) having the property that (∂y/∂t) ∈ L2([0, T], H(Ω)).
- (ii)
ℒ(T, Ω) = L2([0, T], H2(Ω))∩L∞([0, T], H1(Ω)).
3. Existence of Solution
Theorem 1. Let Ω be a bounded domain from ℝ2; with the boundary smooth enough, on Ω( with i = 1, 2, 3, 4), the problem (1)–(3) has a unique (global) strong solution y ∈ W1,2([0, T] : H(Ω))such thatyi ∈ ℒ(T, Ω)∩L∞(Q) with i = 1, 2, 3, 4. In addition y1, y2, y3, and y4 are nonnegative. Furthermore, there exists C > 0 (independent of (v)) for all t ∈ [0, T]:
Proof. To prove the existence of a (global) strong solution for system (1)–(3), now we write system (1)–(3) as shown in (7) (see Appendix). Let
System (10) represents the nonlinear term of (1) and we consider the function g(y(t)) = (g1(y(t)), g2(y(t)), g3(y(t)), g4(y(t))); then, we can be rewrite system (1)–(3) in the space H(Ω) as follows:
It is clear that function g is Lipschitz continuous in y = (y1, y2, y3, y4) uniformly with respect to t ∈ [0, T].
As the operator A defined in (7) and (8) is dissipating, self-adjoint and generates a C0-semi-group of contractions on H(Ω) [19]. Therefore, Theorem A.1 (see Appendix) assures problem (1)–(3) which admits a unique strong solution y ∈ W1,2([0, T], H(Ω)) with
In order to show that yi ∈ L∞(Q) for i = 1, 2, 3, 4, we denote and {S(t), t ≥ 0} is the C0-semigroup generated by the operator B : D(B) ⊂ L2(Ω)⟶L2(Ω), where By1 = d1Δy1 and D(B) = {y1 ∈ H2(Ω), (∂y1/∂η) = 0, a.e ∂Ω}. It is clear that the function satisfies the system:
Note that this system has a solution given by
As and g1(s, y(s)) − M ≤ 0, we have U1(t, x) ≤ 0, ∀(t, x) ∈ Q. Similarly, the function satisfies U2(t, x) ≥ 0, ∀(t, x) ∈ Q.
Then,
Thus, we have proved that
By the first equation of (1), we obtain
Using the regularity of y1 and Green’s formula, we can write
Then,
Since for i = 1, 2, 3, 4 are bounded independently of v and , we deduce that
We make use of (12), (13), and (21) in order to get
In order to show the positiveness of yi for i = 1, 2, 3, 4, we write system (1) in the form:
It is easy to see that the functions H1(y1, y2, y3, y4), H2(y1, y2, y3, y4), H3(y1, y2, y3, y4), and H4(y1, y2, y3, y4) are continuously differentiable satisfying H1(0, y2, y3, y4) = ωy4 + μN(1 − v(x, t)) ≥ 0, H2(y1, 0, y3, y4) = β(y1y3/N) ≥ 0, H3(y1, y2, 0, y4) = σy2 ≥ 0, H4(y1, y2, y3, 0) = γy3 + μNv(x, t) ≥ 0, for all y1, y2, y3, y4 ≥ 0 (see [20]). This completes the proof.
4. The Existence of the Optimal Solution
In this section, we will prove the existence of an optimal control for problem (5) subject to reaction diffusion system (1)–(3) and (v) ∈ Uad. The main result of this section is the following theorem.
Theorem 2. Under the hypotheses of Theorem 1, the optimal control problem (1)–(5) admits an optimal solution (y∗, (v∗)).
Proof. From Theorem 1, we know that, for every v ∈ Uad, there exists a unique solution y to system (1)–(3). Assume that
Let {(vn)} ⊂ Uad be a minimizing sequence such that
By Theorem 1, using the estimate (9) of the solution , there exists a constant C > 0 such that for all n ≥ 1, t ∈ [0, T],
H1(Ω) is compactly embedded in L2(Ω), so we deduce that is compact in L2(Ω).
Let us show that is equicontinuous in C([0, T] : L2(Ω)). As is bounded in L2(Q), this implies that for all s, t ∈ [0, T],
The Ascoli–Arzela theorem (see [21]) implies that is compact in C([0, T] : L2(Ω)). Hence, selecting further sequences, if necessary, we have in L2(Ω), uniformly with respect to t and analogously, we have for in L2(Ω) for i = 2, 3 4, uniformly in relation to t.
From the boundedness of in L2(Q), which implies it is weakly convergent in L2(Q) on a subsequence denoted again by , for all distribution φ,
We put N(y) = (β/(y1 + y2 + y3 + y4)); we now show that and strongly in L2(Q), and we write
Since vn is bounded, we can assume that vn⟶v∗ weakly in L2(Q) on a subsequence denoted again by vn. Since Uad is a closed and convex set in L2(Q), it is weakly closed, so v∗ ∈ Uad.
We now show that
Writing with i = 1, 2, 3, 4,
By taking n ⟶ ∞ in (26)–(28), we obtain that y∗ is a solution of (1)–(3) corresponding to (v∗) ∈ Uad. Therefore,
This shows that J attains its minimum at (y∗, v∗), and we deduce that (y∗, v∗) verifies problem (1)–(3) and minimizes the objective functional (5). The proof is complete.
5. Necessary Optimality Conditions
Proposition 1. The mapping y : Uad⟶W1,2([0, T]; H(Ω)) with yi ∈ ℒ(T, Ω) for i = 1, 2, 3, 4 is Gateaux differentiable with respect to v∗. For all direction v ∈ Uad,y′(v∗)v = Y is the unique solution in W1,2([0, T]; H(Ω)) with Yi ∈ ℒ(T, Ω) of the following equation:
Proof. Put for i = 1,2,3,4. F(y1, y2, y3, y4) = (βy1y3/(y1 + y2 + y3 + y4)), , and .
We denote Sɛ system (1) corresponding to vε and S∗ system (1) corresponding to v∗, subtracting system Sɛ from S∗; so, we have:
We prove that are bounded in L2(Q) uniformly with respect to ɛ. For this end, denoting by ,
Then, (38) is rewritten as
Let (S(t), t ≥ 0) be the semigroup generated by A; then, the solution of (42) can be expressed as
On the other hand, the coefficients of the matrix Hɛ are bounded uniformly with respect to ɛ; using Gronwall’s inequality, we have
Hence, in L2(Q), i = 1, 2, 3, 4. Denote
Hence, system (38)–(40) can be written in the form
By (43) and (48), we deduce that
Thus, all the coefficients of the matrix Hɛ tend to the corresponding coefficients of the matrix H in L2(Q). An application of Gronwall’s inequality yields to in L2(Q) as ɛ ⟶ 0, for i = 1, 2, 3, 4.
Let v∗ be an optimal control of (1)–(4), be the optimal state, Z be the matrix defined by , K = (K1, K2, 0, K3), Z∗ be the adjoint matrix associated to Z, H∗ be the adjoint matrix associated to H, and p = (p1, p2, p3,, p4) be the adjoint variable; we can write the dual system associated to system (1)–(4):
Lemma 1. Under hypotheses of Theorem 1, if (y∗, (v∗)) is an optimal pair, then there exists a unique strong solution p ∈ W1,2([0, T]; H(Ω)) to system (50) with pi ∈ ℒ(T, Ω) for i = 1, 2, 3, 4.
Proof. Similar to Theorem 1, by making the change of variable s = T − t and the change of functions qi(s, x) = pi(T − s, x) = pi(t, x), (t, x) ∈ Q, i = 1, 2, 3, 4, we can easily prove the existence of the solution to this lemma.
To obtain the necessary conditions for the optimal control problem, applying standard optimality techniques, analyzing the objective functional and utilizing relationships between the state and adjoint equations, we obtain a characterization of the control optimal.
Theorem 3. Let α > 0, v∗ be an optimal control of (1)–(4) and let y∗ and p ∈ W1,2([0, T]; H(Ω)) with for i = 1, 2, 3, 4.p is the adjoint variable, and y∗ is the optimal state.
y∗ is the solution to (1)–(4) with the control v∗. Then,
Proof. We suppose v∗ is an optimal control and are the corresponding state variables. Consider vε = v∗ + ɛh ∈ Uad and corresponding state solution ; we have
We use (37) and (50), and we have
Since J is Gateaux differentiable at v∗ and Uad is convex, as the minimum of the objective functional is attained at v∗, it is seen that J′(v∗)(u − v∗) ≥ 0 for all u ∈ Uad.
We take h = u − v∗and we use (52) and (53); then, . We conclude that J′(v∗)(u − v∗) ≥ 0 equivalent to for all u ∈ Uad. By standard arguments varying u, we obtain
Then,
As v∗ ∈ Uad, we have
6. Numerical Results
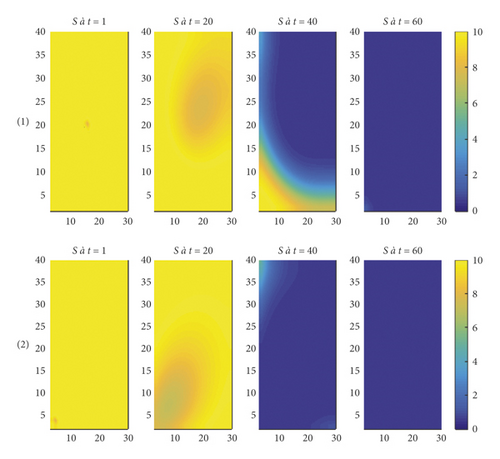
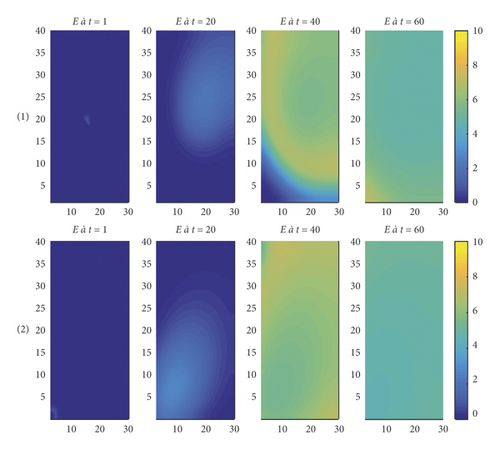
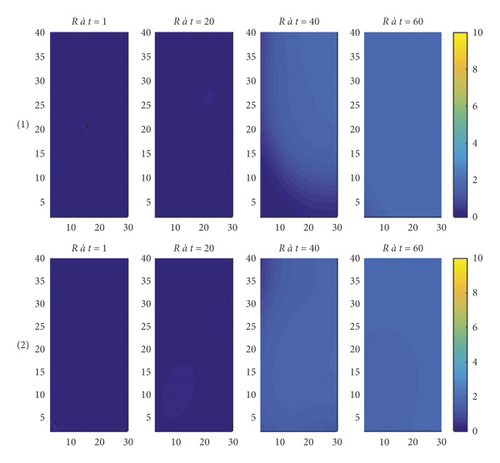
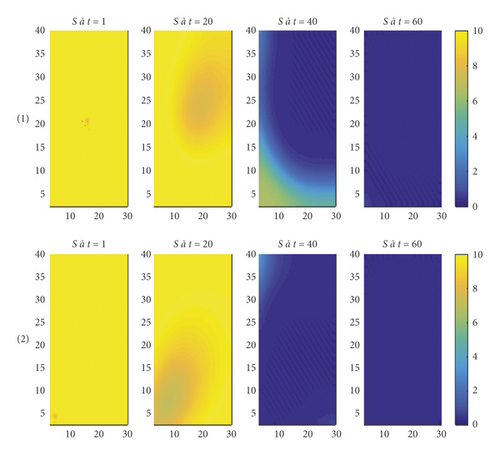
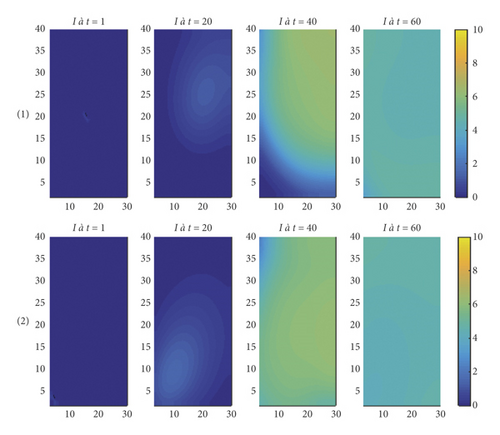
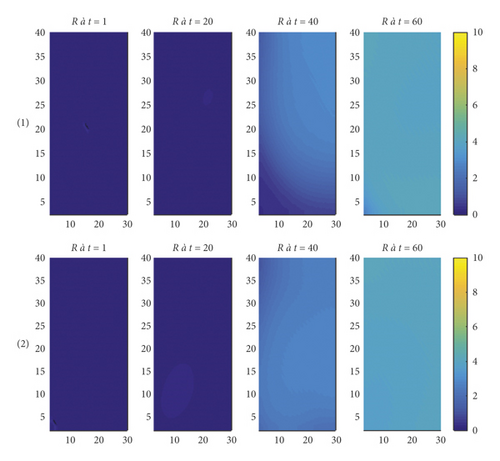
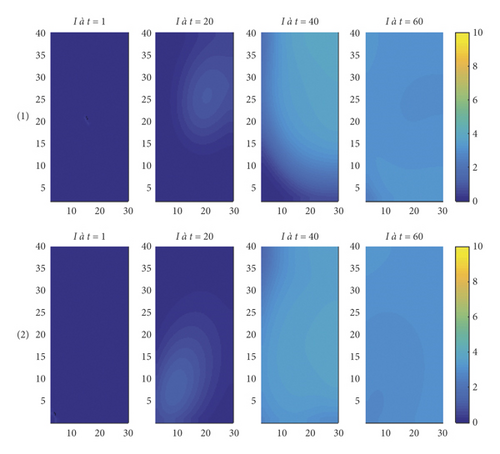
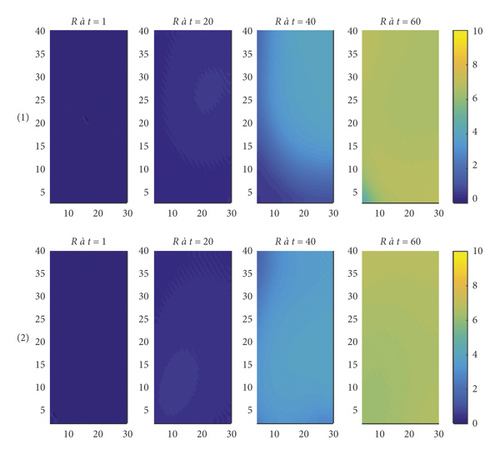
In this section, we give the results obtained by the numerical resolution of the optimality system ((1)–(3), (50), (51)) using forward-backward sweep method (FBSM) [22]. We adopt two situations for the resolution: the first is that the disease starts with the middle of domain Ω(1), and in the second situation, the disease begins with the lower corner Ω(2). A rectangular area of 30 km × 40 km is considered, and the parameter values and the initial values are given in Table 1. The upper limits of the optimality condition are considered to be vmax = 1 [23]. The constant weighting values in the objective function are K1 = 1, K2 = 1, K3 = −1, α = 2.
| Notations | Value | Description (units) |
|---|---|---|
| S0(x, y) | Initial susceptible population (people/km2) | |
| E0(x, y) | Initial exposed population (people/km2) | |
| I0(x, y) | Initial infected population (people/km2) | |
| R0(x, y) | 1 for (x, y) ∈ Ω | Initial recovered population (people/km2) |
| σ−1 | (1/0.09) | Average duration of latent |
| μ | 0.01 | Rate of deaths (day−1) |
| β | 1 | Transmission constant |
| γ−1 | (1/0.04) | Infective periods |
| ω | 0.2 | The rate of losing immunity (day−1) |
| dS | 0.2 | Diffusion rate for susceptible |
| dE | 0.3 | Diffusion rate for exposed |
| dI | 0.5 | Diffusion rate for infected |
| dR | 0.5 | Diffusion rate for recovered |
| t | [1,60] | Time period (day) |
Figures 1–4 show the results without vaccination, and we can see clearly the spread of the disease throughout the domain, for both situations of the onset of the disease.
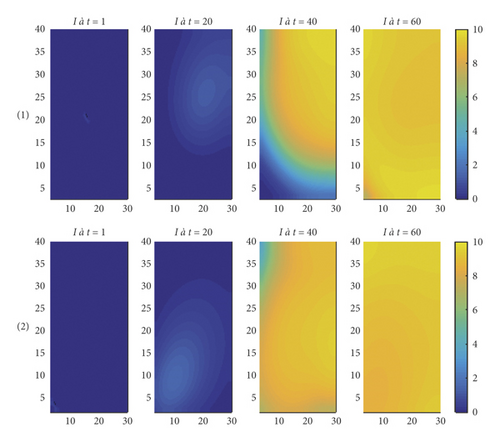
In Figure 3, in the absence of control and for the two situations at the beginning of the epidemic, it can be seen that the number of infected individuals increases by I0(x, y) = 0 for (x, y)/∉ Ωi, i = 1; 2, to about 9 people infected. To validate our vaccination strategy, we consider two ways to do it.
The first is to inject vaccination after 30 days of the onset of the disease, while for the second, vaccination begins on the first day of the epidemic. In Figures 5 and 6, when injecting the vaccine after 30 days, it is easy to see the effectiveness of our control strategy in slowing the spread of the epidemic, since in Figure 6, after 60 days, the number of infected individuals has decreased to about 6 infected individuals, which is a gain by comparing it with the uncontrolled case. Another benefit of our control strategy is illustrated in Figure 7 for recovered individuals, as the number of individuals has increased to reach 4 recovered individuals. In the second case, when the vaccination against the disease starts from the first day (t = 1), the effectiveness of our vaccination strategy to control the spread of the epidemic is clear, since the disease disappears quickly (Figures 8–10).
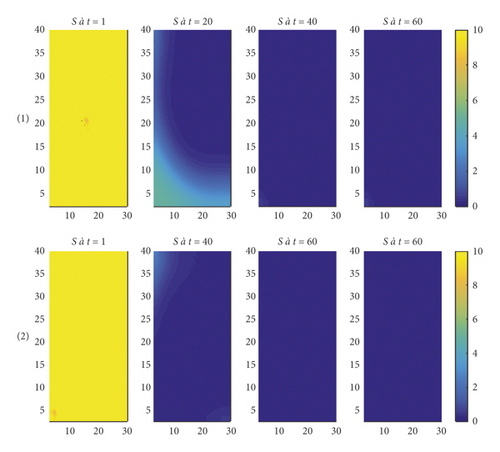
The comparison of these results with those obtained when vaccination is introduced at 30 days allows to conclude the influence of the vaccination from the first days for the elimination of the epidemic.
7. Conclusion
In this work, we proposed an effective vaccination strategy for a two-dimensional spatiotemporal SEIR model, in order to minimize the number of susceptible and infected individuals and to maximize the number of individuals recovered. To achieve this goal, we have based our mathematical work on the use of semigroup theory and optimal control to show the existence of solutions for our state system, and these solutions are positive and related. In addition, we have proven the existence and characterization of optimal control that achieves both our goal and reduce the cost of vaccination. The characterization of the control was made in terms of state functions and adjoint functions. A numerical simulation was given to validate our control strategy.
Conflicts of Interest
The authors declare that they have no conflicts of interest.
Appendix
Theorem A.1. Let X be a real Banach space, A : D(A) ⊆ X ⟶ X be the infinitesimal generator of a C0−semigroup of linear contractions S(t), t ≥ 0 on X, and g : [0, T] × X ⟶ X be a function measurable in t and Lipschitz continuous in x ∈ X, uniformly with respect to t ∈ [0, T].
- (i)
If z0 ∈ X, then problem (A.1) admits a unique mild solution, i.e., a function z ∈ C([0, T]; X) which verifies the equality .
- (ii)
If X is a Hilbert space, A is self-adjoint and dissipative on X, and z0 ∈ D(A), then the mild solution is in fact a strong solution and z ∈ W1,2([0, T]; X∩L2(0, T; D(A)))
Open Research
Data Availability
The data used to support the findings of this study are available from the corresponding author upon request.


