A Trust-Game-Based Access Control Model for Cloud Service
Abstract
In order to promote mutual trust and win-win cooperation between the users and the providers, we propose a trust-game-based access control model for cloud service in the paper. First, we construct a trust evaluation model based on multiple factors, such as the direct trust, feedback trust, reward punishment, and trust risk and further propose a weight method by maximum discrete degree and information entropy theory; second, we combine trust evaluation with the payoff matrix for game analysis and calculate the mixed Nash equilibrium strategy for the users and service providers; third, we give the game control condition based on trust level prediction and payment matrix to encourage participants to make honest strategy. Experimental results show that our research has good effect in terms of acceptance probability, deception probability, accuracy of trust evaluation, and cooperation rate in the cloud service.
1. Introduction
Cloud computing is a very popular technology in the field of information technology and is highly valued by the government, academia, and industry [1, 2]. For example, Apple and Amazon have launched cloud computing services, which allow personals and organizations to use dynamic computing infrastructure based on needs. Convenient and fast services are the core advantages of cloud computing, but cloud computing services have a lot of security problems, which have attracted widespread attention in the industry [3]. So, it is necessary to choose a good solution for requirement of customer in terms of service quality and cost.
1.1. Motivation
With the development in information technology, many fraud incidents have damaged the interests of transaction entities and brought crisis to cloud services [4]. In cloud computing, each entity will choose favorable action strategies according to the actual environment and benefits, and these strategies will eventually reach a mutually constrained equilibrium state.
The process of trust is a bargaining game process. Applying game theory to trust construction provides a new way for cloud computing services. Because the decision-making strategies of different trust levels are different, the control strategy depends on the game analysis of both sides, rather than their own unilateral inference. However, trust is a complex process based on multifactor decision-making, which involves interactive history, and direct and recommend trust management [5]. Because of the coexistence of trust and risk, it is very one-sided and dangerous to rely on trust level alone in decision-making. Therefore, it is necessary to combine behavioral trust and game analysis to analyze the payment matrix of both sides and calculate the mixed Nash equilibrium strategy based on the attribute of user’s behavior.
Access control is also an important security mechanism to prevent malicious users from illegally accessing [5–7]. However, due to the large number of dynamic users and services, how to authenticate the access security and mutual trust of outsourcing data is a problem [8, 9]. Game theory provides many mathematical frameworks for analysis and decision process of network security, trust, and privacy problems. In fact, service providers and users play different roles of complexity, which need further detailed analysis from three disciplines: access control, trust evaluation, and game theory [8, 10–12].
1.2. Contributions
- (1)
We construct a trust model based on multiple factors, such as the direct trust, reward punishment, feedback trust, and trust risk, and the weight factor is determined by maximum discrete degree and information entropy.
- (2)
We combine the trust evaluation results with the payoff matrix for game analysis and calculate the mixed Nash equilibrium strategy for the users and service providers.
- (3)
We give the game control condition based on trust prediction and payment matrix to encourage subjects for honest access.
The rest of this paper is structured as follows. In Section 2, we review some related research in access control, game theory, and trust management in cloud services. In Section 3, we propose a method of trust evaluation in the cloud environments. In Section 4, in order to motivate both sides to behave in an honest manner, we make use of trust-game-based access control model to calculate the mixed strategy Nash equilibrium for users and service providers. In Section 5, we design several related experiments. Simulation results show the superiority of our research in the cloud service. Finally, in Section 6, we conclude the current research and discuss some future work.
2. Related Work
In the basic idea of access control based on game theory, service providers decide whether to open information to users according to income matrix to maximize their own benefit, which is suitable for dynamic and complex cloud service environment [8, 9].
Many researchers have applied access control, trust, and risk assessment to deal with security and privacy problems in dynamic environments [6, 9]. Chunyong et al. [7] studied the hybrid recommendation algorithm for large data based on optimization and constructed some trust models, and the results showed that the error was reduced compared with the traditional method. Considering the practical existence and involvement of permission risk, Helil et al. [12] constructed a non-zero-sum game model that chose trust, risk, and cost as metrics in the payoff functions of player and analyzed the Pareto efficient strategy from the application system and the user. Based on game theory, Furuncu and Sogukpinar [13] proposed an extensible security risk assessment model in cloud environment, which can assess whether the risk should be determined by the cloud provider or tenant.
Njilla and Pissinou [14] proposed a game theoretic framework in cyberspace, which can optimize the trust between the user and the provider. Baranwal and Vidyarth [15] proposed a new license control framework based on game theory in the cloud computing, and the results showed that there were a dominant strategy and Nash equilibrium in pure strategy. He and Sun [16] used the game theory model to study the impact of the adversary’s strategy and the accuracy requirements on defense performance.
Mehdi et al. [17] proposed a method of identifying and confronting malicious nodes. The outcome was determined by the game matrix that contained the cost values of the possible action combination. Kamhoua et al. [18] proposed a zero-sum game model to help online social network users determine the best strategy for sharing data. It is difficult for peer-to-peer network to identify random jammer attacks. Garnaev et al. [19] proposed an attack model based on Bayesian game and proved the convergence of the algorithm. LTE networks are vulnerable to denial of service and service loss attacks. Aziz et al. [20] proposed a strategy algorithm based on repeated game learning, which can recover most of the performance loss.
Considering the social effects represented by the average population, Salhab and Malhamé [21] proposed a collective dynamic choice model and proved that the dispersion strategy of the optimal tracking trajectory was an approximate Nash equilibrium. Wang and Cai [22] proposed a trust measurement model of a social network based on game theory and solved the free-rider problem by the punishment mechanism. From the perspective of noncooperative game theory, Hu et al. [23] studied the multiattribute cloud resource allocation and proposed both ESI (equilibrium solution iterative) and NPB (near-equalization price bidding) algorithms to obtain Nash equilibrium solution.
Cardellini and Di Valerio [24] proposed a game theory approach to the service and pricing strategy of cloud systems. Furthermore, they proposed SSPM (Same Spot Price Model) and MSPM (Multiple Spot Prices Model) strategies for IAAS suppliers. Based on contextual feedback from different sources, Varalakshmi and Judgi [25] proposed a reliable method to select service providers, which can filter unfair feedback nodes to improve transaction success rate and help customers to select suppliers more accurately. Gao and Zheng [26] studied the acceptance of reputation-based access control system, which was constructed by applying a compensation mechanism to improve the utility and punishment mechanism of users in the cloud computing.
3. Trust Computation
Trust computing needs multiple factors, and we introduce the direct trust, feedback trust, reward punishment, trust risk, and so on. In addition, the weight of the trust factor is determined by information entropy and maximum dispersion; in order to the convenience of reading this paper, some symbols are given in Table 1.
| Symbols | Meanings |
|---|---|
| D1, D2, …, DZ ∈ D(S) | Z entities of system |
| Y1, Y2, Y3, Y4, Y5 | Trust function |
| ωm | Weight of trust function |
| TG(Di, Dj, S, t) | Trust between Di and Dj |
| TS = (T1, T2, …, Ti, …, TN) | N level trust level |
| ψ(TG(Di, Dj)) | Trust decision |
| T(i) | Decay time factor |
| R(Di, Dj) | Risk function |
| S = {s1, s2, …, sP} | Service level |
| Level | The level of a trust tree |
| ρ(Fk) | Feedback weight factor |
| F(Di) = {F1, F2 … Fn} | Feedback entities of Di |
| PTi | Predicted probability of Ti |
| et | Evaluation error at time t |
3.1. Trust Decision
TS = (T1, T2, …, Ti, …, TN) is determined by the application requirement in the network environment, and permission is determined by the trust value. For example, a cloud application system provides 3 levels of services, S = (s1, s2, s3): s1 represents denial of service, s2 represents the reading services, and s3 represents both reading and writing services. The corresponding decision space is TS = {T1, T2} = {0.3, 0.5}, the trust decision function can be expressed as follows: . If the trust value of Di is TG(Di, Dj) = 0.2, then the decision result is ψ(TG(Di, Dj)) = ψ(0.2) = s1 = deny.
3.2. Fuzzy Trust Level
Discrete trust level is conducive to the normalization and quantification of the trust evaluation, and we introduce the concept of fuzzy [27]. We set the fuzzy center value of adjacent trust values to 1 : 1.3 (Table 2), and some overlap is used to represent the trust evaluation.
| Trust level | Description | Trust value |
|---|---|---|
| T5 | Distrust | (0, 0.26, 0.34) |
| T4 | Doubt | (0.26, 0.34, 0.44) |
| T3 | Common trust | (0.34, 0.44, 0.57) |
| T2 | Middle trust | (0.44, 0.57, 0.74) |
| T1 | Very trust | (0.57, 0.74, 1) |
In formula (4), TG(u) represents the total trust value of the node u; furthermore, when TG(u) is in [0,0.26], the probability of T5 is PT5, PT5 = (0.26 − TG(u))/(0.26 − 0) = (0.26 − TG(u))/0.26; when the trust value of TG(u) is in [0.26, 0.34], PT5 = (0.34 − TG(u))/(0.34 − 0.26) = (0.34 − TG(u))/0.08. If level of TG(u) is T4, T3, T2, or T1, the probability of the trust level can be calculated by formula (4).
3.3. Direct Trust
Direct trust is usually made up of multiple factors, and the relevant attributes can be selected from the interaction history.
3.3.1. Weight Calculation
3.3.2. Time Decay Factor
3.3.3. Calculation of Direct Trust
3.4. Feedback Trust
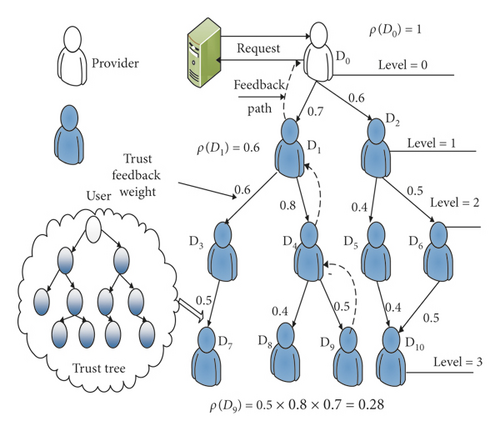
D(S) is a set of entity; DTR represents the direct trust relationship among entities; and Y1 is the direct trust value. In the WDT, the level of the root entity is level = 0, the level of the direct neighbor of the root entity is level = 1, the level of neighbor’s neighbor is level = 2, and the rest of nodes can follow the arrangement in turn.
3.5. Reward Punishment
3.6. Trust Risk
According to formulas (14) and (15), risk and service have an inverse proportional relationship between Y4(Di, Dj) and R(Di, Dj).
3.7. Weight of Trust Attribute
In the practical application, we can set a series of reasonable values of α and calculate ω1, ωi, and ωm by formulas (18)–(20). Next, according to these above descriptions, we introduce Algorithm 1 to determine the values of different trust attributes.
-
Algorithm 1: Weight of the trust attribute.
- (1)
if 0 < m ≤ 2
- (2)
then ω1 = a,
- (3)
ω2 = 1 − a;
- (4)
if m > 2
- (5)
then ,
- (6)
ωm = ((m − 1)α − m)ω1 + 1/(m − 1)a + 1 − mω1;
- (7)
for i = 2 to m − 1 do
- (8)
;
- (9)
when ω1 = ω2 = ⋯ = ωm = 1/m
- (10)
⟹disp(W) = ln m, a = 0.5;
- (11)
End.
In Algorithm 1, the classification weight vector is mainly determined by m and α. m is a certain value, and the key is how to reasonably determine the value of the α. According to Table 3, if α = 0, then ω1 = 1, ω2 = ω3 = ⋯ = ωm = 0; if α = 1, then ωm = 1, and ω1 = ω2 = ⋯ωi = ⋯ = ωm−1 = 0; if α = 0.5, then ω1 = ω2 = ⋯ = ωi = ⋯ = ωm = 1/m, when 0 < α < 1, a ≠ 0.5, we get different values of ωi.
| Weight | a = 0 | a = 0.1 | a = 0.2 | a = 0.3 | a = 0.4 | a = 0.5 | a = 0.6 | a = 0.7 | a = 0.8 | a = 0.9 | a = 1.0 |
|---|---|---|---|---|---|---|---|---|---|---|---|
| ω1 | 0.00 | 0.0104 | 0.0145 | 0.0983 | 0.1647 | 0.2500 | 0.3474 | 0.4612 | 0.5965 | 0.7646 | 1.00 |
| ω2 | 0.00 | 0.0434 | 0.1065 | 0.2756 | 0.2133 | 0.2500 | 0.2722 | 0.2757 | 0.2757 | 0.1818 | 0.00 |
| ω3 | 0.00 | 0.1821 | 0.2520 | 0.4614 | 0.2722 | 0.2500 | 0.2133 | 0.1647 | 0.1647 | 0.0433 | 0.00 |
| ω4 | 1.00 | 0.7641 | 0.5965 | 0.1647 | 0.3474 | 0.2500 | 0.1647 | 0.0451 | 0.0451 | 0.0103 | 0.00 |
3.8. Total Trust
Total trust reflects the overall subjective judgment of the object in the network environment, according to requirement of the trust evaluation model, we introduce Algorithm 2 to compute the total trust value.
-
Algorithm 2: Total trust value.
-
Input: Y1, Y2, Y3, Y4, and ωm
-
Output: total trust value
- (1)
Calculate direct trust function Y1, feedback trust function Y2, reward punishment function Y3, and trust risk function Y4,
- (2)
Calculate the weight ωm of the trust attribute function (Algorithm 1);
- (3)
Calculate total trust TG(Di, Dj, S, t).
4. Trust-Game-Based Access Control
Essentially, access control can be regarded as a game between the users and the service providers in the cloud computing environment. From the perspective of the service provider, access authorization is the payoff, and long-term protection services can be rewarded [14], and these meanings of different related game parameters are described in Table 4.
| Symbol | Definition |
|---|---|
| The average loss of the service provider in accepting the user’s deception access | |
| The average benefit of the service provider in accepting the user’s honest access | |
| The average loss of the service provider in rejecting an honest access of the user | |
| The user’s extra benefit of deception access | |
| The average benefit of user of honest access | |
| Ucost | The cost of deception for a user |
| Upunish | The punishment of user for deception |
| Ai | Payment matrix of service provider |
| Bi | Payment matrix of user |
| γk ∈ [0,1], (k = 1, …, 6) | Parameter factor of the game |
| y∗ | Deception probability of user |
| x∗ | Acceptation probability of provider |
4.1. Game Theory
- (1)
Player: it is a basic entity in a game that is responsible for making choices for certain behaviors. A player can represent a person, a machine, or a group of individuals in a game.
- (2)
Strategy: it is the action plan that player can take during the game.
- (3)
Order: it is the sequences of strategy chosen by the player.
- (4)
Payoff: it is a positive or negative reward for player ‘s specific action in the game.
- (5)
Nash equilibrium: it is a solution for a game involving two or more players in which each player is assumed to know the equilibrium strategy of the other players and no player can gain benefit by changing his or her strategy [25].
4.2. Game Analysis
In a dynamic game, strategy and trust are closely related, which can reach the equilibrium by continuous amendment. If the service providers accept the honest access of users, both the service provider and the user can obtain win-win benefits which are and , respectively; if the service provider accepts the deception access of user, then it has no benefit and only losses ; in addition to , the user can also get by deception behavior. Obviously, users can suffer losses because of deception behaviors, the cost is Ucost, and Upunish is punishment for users. If the service provider rejects the user’s access request, he/she has no income and no loss; if user has the intent to cheat, he/she also must pay Ucost.
By the simple line drawing method, there is no pure strategy equilibrium in the game model, but a mixed strategy Nash equilibrium P1 = (x, 1 − x) is established. Assume that the service provider chooses the acceptance probability x and reject probability 1 − x, and the service provider’s mixed strategy is P1 = (x, 1 − x).
In formula (25), the acceptance probability of the service provider is related to the payment of the user. Because 0 < x∗ < 1 is true, further ; if , then x∗ > 1, but that is not true. In addition, according to formula (25), in order to improve the acceptance probability, when the cost is constant, service providers can increase the average normal benefit and punishment of deception and reduce the benefits of user deception.
The advantage of the mixed strategy Nash equilibrium is that users can only get an uncertain game result. Although users know the payment matrix and decision probability of service providers, they do not know how to make decisions. In this game, the acceptance probability and reject the probability of service provider are x∗ and 1 − x∗, respectively, which can reduce the control cost of the service provider. Even if denial access is uncertain, the high probability of rejection threatens the user’s deception. If the rejection probability is less than 1 − x∗, because the user is rational, according to formula (24), the best choice of user is deception strategy.
On the contrary, if reject probability is greater than 1 − x∗, the optimal selection of user is honest access. In a word, if the reject probability of service provider is too low or too high, users can have the pure strategy choice; under the mixed strategy Nash equilibrium, the acceptance probability of service provider is x∗, and reject probability is 1 − x∗, there is no difference between the user’s choice of deception and honesty, and service providers do not provide users with any speculative opportunity. Next, we introduce Lemma 1 to express the relationship between trust level and payment.
Lemma 1. Both gain and loss of the service provider and the user are positively proportional to the user’s trust value.
Proof. In Section 4, the gain and loss of the service provider and the user are , , , , and . Assume that the trust levels of users Ui and Uj are Ti, Tj, i < j, i − j = Δ < 0 and γi−1/γj−1 = γ(i − 1)−(j − 1) = γΔ, when γ ∈ [0,1], then γΔ > 1, so the ratio of the same payment value between user Ui and Uj is constant greater than 1, so their relationship is actively proportional. This Lemma 1 can be understood from the actual network application, the trust value of user is higher, and service providers and users can be in more in-depth cooperation.
The mixed strategy Nash equilibrium of the service provider has been calculated, but each specific evaluation is not determined, which also depends on the trust level of user and the probability of the other user′s decision. Because the evaluation strategies of users with different trust levels are different and the control strategy depends on the game result, this is not just one side inference, which is also the connotation of game theory [20, 22, 31]. Next, we give Lemma 2 to show the game control condition based on trust prediction and payment matrix.
Lemma 2. Assume that the prediction probability PTi of the user trust level and the payment matrix of the service provider have been known, formula (26) is the control condition that the service provider accepts access:
Proof. Because the payment matrix of users of trust levels is different, PTi can be predicted by fuzzy membership formula and trust evaluation model; furthermore, participants can judge the total revenue according to the strategy choice. Assume that the users and service providers are rational, they seek to play game in the most favorable way of payment and know that the mixed strategy Nash equilibrium is the optimal choice for both sides to ensure the maximum benefit of mutual transaction. The expected payment matrix function of the service provider can be expressed as follows:
We can derive the partial derivative of formula (27) for x, and the first-order optimization condition for the user is expressed as follows:
Further deduction, we can obtain the following formula of deception probability y∗:
Here, (y∗, 1 − y∗) is the user’s Nash equilibrium of mixed strategy, and the payment matrix of the service provider is expressed as follows:
In fact, when the service provider’s acceptance probability is 1, these user’s choices are deception probability y∗ and honest probability 1 − y∗, respectively. According to formula (30), the first line represents that provider choose to accept access of user, the first column represents deception choice of user, and the second column represents honesty choice, so the benefit of service provider can be expressed as
Formula (31) is the benefit of service provider when the trust level of user is Ti. Because the trust level is uncertain, in order to obtain the total benefit of the user, and then determine whether the decision is or not, it needs a weighted sum of each trust level, and the total benefit of the provider is expressed as follows:
Solving formula (32), if this value is greater than zero, and the service provider′s benefit is greater than zero, then request is accepted; otherwise, access is denied.
5. Experiment and Analysis
Experiment hardware environment: 2 core CPU, clock 2.2 GHz, 8 GB memories, storage 500 GB; soft environment: Windows 10, 64 Bit. In addition, in order to objectivity, these experiments are divided into two parts: the synthetic data and real data.
5.1. Evaluation of Synthetic Data
Based on the parameters of trust and game model, we design relevant experiments by MATLAB 2015a, and specific numerical details are listed in Table 5.
| Trust level | Ucost | Upunish | |||||
|---|---|---|---|---|---|---|---|
| T1 | 1000 | 300 | 300 | 800 | 1000 | 200 | 350 |
| T2 | 550 | 250 | 250 | 700 | 900 | 200 | 300 |
| T3 | 250 | 200 | 200 | 580 | 800 | 200 | 240 |
| T4 | 180 | 150 | 150 | 450 | 700 | 200 | 200 |
| T5 | 130 | 100 | 100 | 300 | 600 | 200 | 150 |
5.1.1. Acceptance Probability
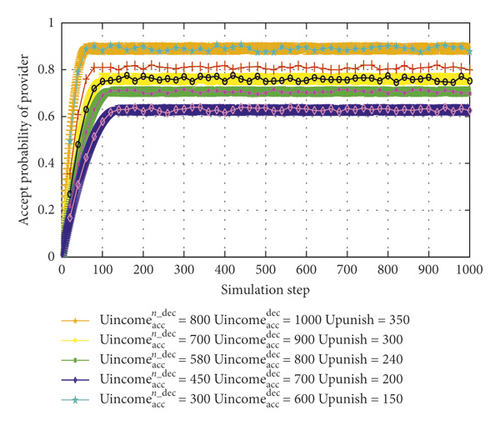
There are γ3 = 0.7, γ4 = 0.65, γ5 = 0.7, and Ucost = 100; these values of , , and Upunish can be adapted by the trust level. According to formula (25), if sum between deception cost and normal average benefit is lower than the deception benefit, the user can choose deception action.
In Figure 2, with the , , and Upunish, the acceptance probability rises from 0.62 to 0.71, 0.76, 0.81, and 0.89.
5.1.2. Deception Probability
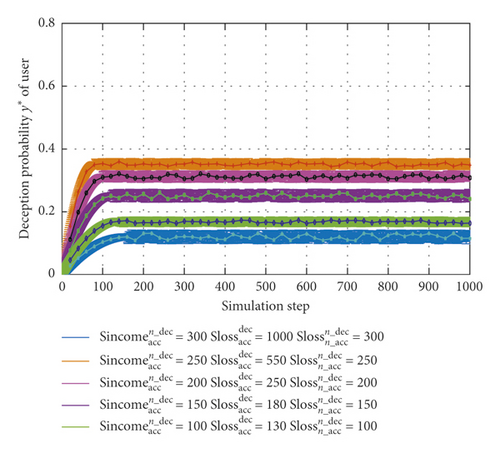
According to formulas (27) and (28) and Lemma 1, parameters can be set as γ1 = 0.9, γ2 = 0.3, and γ6 = 0.3 and the value of , , can be adapted with the trust level. As can be seen from Figure 3, deception probability reduces from 0.35 to 0.29, 0.25, 0.17, and 0.12. These higher values of , , and are corresponded to lower deception probability.
5.1.3. Transaction Success Rate
In this section, successful transaction is that the users choose the honest access, and the service party accepts access.
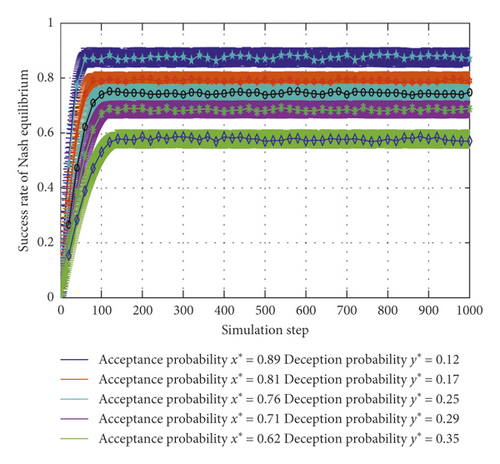
In Figure 4, according to the acceptance probability and deception probability in Figures 2 and 3, after the transaction is carried out to a certain stage, the success rates of five curves are about 0.88, 0.80, 0.70, 0.64, and 0.58, respectively; on further analysis, both a higher acceptation probability and a lower deception probability are corresponded to a better success rate.
5.1.4. Average Payoff of Participant
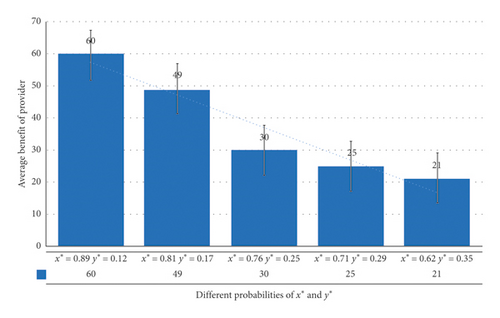
In the process of trust game, according to payment matrix formulas (23) and (27), it is necessary to compare benefits of game participants, according to values of parameters in Table 5 and Figures 2–4, and the specific results are shown in Figures 5 and 6.
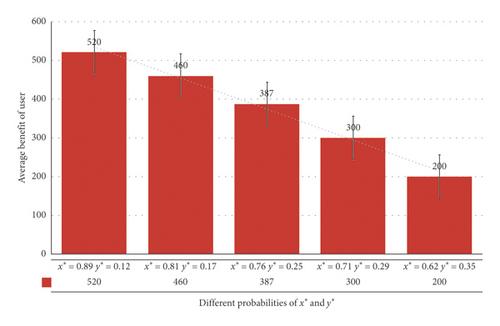
In Figure 5, the average benefit of user is 520, 460, 387, 300, and 200. On further analysis, when the deception probability becomes smaller, the acceptance probability becomes larger, and the user’s income also increases. This result validates Lemma 1 very well.
In Figure 6, the average benefit of provider is 60, 49, 30, 25, and 21. It is like Figure 5, when the deception probability of users becomes smaller, the acceptance probability becomes larger, and the benefit of service providers also increases. Same as Figure 5, this result validates Lemma 2 very well.
According to Figures 5 and 6, users get more benefit than service providers during the game process. Because service providers are market-oriented, which can provide many services to more users, thereby gain more revenue, this indirectly proves the effectiveness in promoting good faith and orderly transactions.
5.2. Evaluation of QWS Dataset
In this section, we design several experiments to compare TGAC (A Trust-Game-Based Access Control Model for Cloud Services) with RCST (an improved recommendation algorithm for big data cloud service based on the trust in sociology) [7] and FFCT (identifying fake feedback in cloud trust systems using feedback evaluation component and Bayesian game model) [19].
For the sake of fairness and credibility of experiments, these three models are evaluated by CloudSim 4.0; furthermore, we consider the QWS dataset on the http://www.uoguelph.ca/qmahmoud/qws/, which contains 5000 real services (Table 6).
| Attribute | Value |
|---|---|
| Cost | (0, 2000) |
| Response time (ms) | (0, 400) |
| Reputation | (1, 10) |
| Success rate | (0, 100) |
| Reliability | (0, 100) |
| Location | {Shanghai, Beijing, London} |
| Privacy | {Visible to anyone, visible to network, not visible} |
| Number of concurrent | (0, 1000) |
| Availability | (0, 100) |
5.2.1. Cooperation Rate
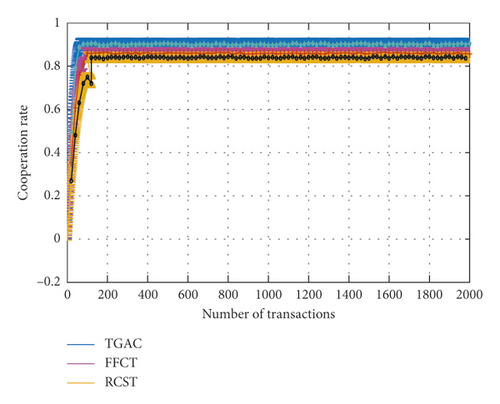
In Figure 7, the cooperation rate of TGAC, FFCT, and RCST is 0.902, 0.861, and 0.853, respectively. In the RCST, quantification of trust is relatively simple, which is difficult to deal with the complex situation, and thus affects mutual trust and transaction between the two sides in the cloud computing. Although FFCT plays a prominent role in identifying error feedback nodes, the lack of attribute weight model will result in accurately determining the role of trust attributes, which can lead to the reduction of mutual trust, and thus affects the cooperative transactions between the two sides. TGAC not only can make use of multiattribute trust algorithms but also can adjust the related parameters by feedback weight, reward punishment, and risk factors; furthermore, it can improve the cooperation rate by adjusting the relevance of honesty probability and deception parameters.
5.2.2. Accuracy Evaluation
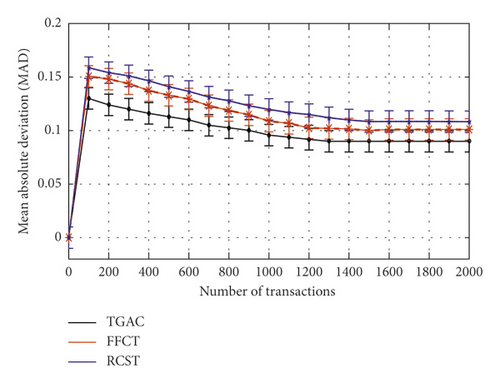
Accuracy is used to check whether the proposed scheme algorithms can accurately and consistently provide trust calculation, which is often measured by the error. The smaller the error, the higher the accuracy. Assuming that At+1 is the actual trust value, TGt+1 is the prediction trust value at time t + 1, and there are three methods for the accuracy of the trust evaluation.
According to Figure 8, the average MAD of TGAC, RCST, and FFCT is stable at 0.090, 0.1081, and 0.1019, respectively. When the number of transactions is more than 1200, the curve of TGAC changes more smoothly than do those of FFCT and RCST, which indicates that fewer transactions enable our model to achieve a better accuracy level.
According to Figure 9, the average RMSE of TGAC, RCST, and FFCT is stable at 0.0918, 0.1087, and 0.1025, respectively. When the number of transactions is more than 1200, the curve of TGAC changes more smoothly than those of FFCT and RCST, which indicates that fewer transactions enable our model to achieve a better accuracy value.
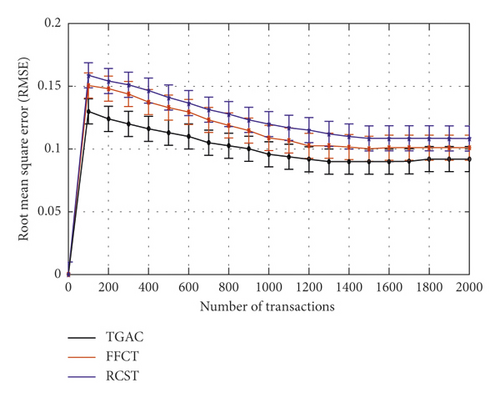
As can be seen in Figure 10, the average MAPE of TGAC, FFCT, and RCST is stable at 10.51%, 12.11%, and 12.75%, respectively. When the number of transactions is more than 1200, the MAPE fitting curve of TGAC changes more smoothly than the other two models, which indicate that fewer transactions can generate unbiased trust prediction. Based on comprehensive comparative analysis between Figures 8–10, TGAC has better accuracy than FFCT and RCST.

5.3. Application Example
According to the trust value of participant and the corresponding payoff matrix of the game model, we can forecast the probability of honesty access of user and acceptance of provider and thus adjust the corresponding parameters to achieve an equilibrium state.
5.3.1. Parameters
In this section, according to Section 3, trust is divided into very trust, trust, medium trust, doubt, and distrust, the probability PTi is corresponded to five trust levels 0.1, 0.65, 0.1, 0.1, and 0.05, and the value of is 0.7, 0.95, 0.9, 0.85, 0.87, and 0.95, and these parameters , , , , , Ucost, and Upunish are shown in the second column to the eighth column of Table 7. These above parameters are put into formulas (21) and (25), the acceptance probability x∗ of service provider and the deception probability y∗ of user can be obtained under the mixed strategy Nash equilibrium, and specific results are shown in Table 7 from the ninth to the tenth column. PTi, ri, , , and x∗ are put into formula (26), and the benefit of provider is calculated.
| Trust level | Ucost | Upunish | x∗ | y∗ | |||||
|---|---|---|---|---|---|---|---|---|---|
| T1 | 1000 | 100 | 100 | 300 | 850 | 200 | 800 | 82 | 18 |
| T2 | 700 | 95 | 95 | 273 | 734 | 200 | 730 | 78 | 22 |
| T3 | 600 | 90 | 90 | 240 | 667 | 200 | 640 | 73 | 25 |
| T4 | 400 | 85 | 85 | 226 | 538 | 200 | 503 | 69 | 31 |
| T5 | 300 | 80 | 80 | 207 | 446 | 200 | 382 | 63 | 36 |
5.3.2. Discussion and Analysis
- (1)
TGAC not only can make use of multiattribute trust algorithms but also can adjust the related parameters by risk and reward punishment factors; especially, it uses feedback weight factors to filter out unnecessary nodes by the “Six Degrees of Separation,” and this can ensure the accuracy of trust evaluation and reduce the computational burden.
- (2)
The prediction probability of trust level is combined with the decision-making in the paper, which is appropriate to make use of game theory to analyze the gains and losses, and the results of the statistical data of example are shown in Figure 11.
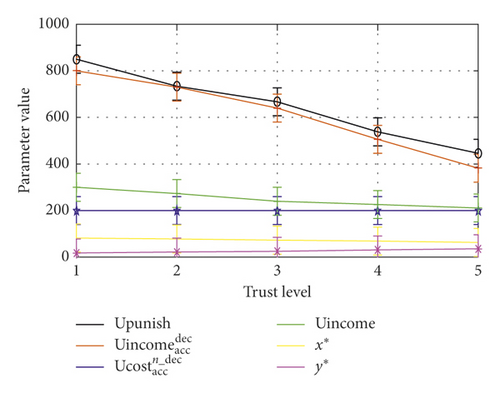
In Figure 11, we can see that the value of and Upunish increases as well as the trust level. When the user deception cost is fixed, with the decrease in trust level, the acceptance probability x∗ of service provider increases, and the deception probability y∗ of user reduces, which is consistent with the conclusion of the paper. Note: in order to see the trend of the computed results in the same drawing, the percentage of the drawings is magnified by 100 times.
6. Conclusion
Trust has a great influence on making decisions in the open and dynamic network environment, and we construct a trust evaluation scheme based on multiple factors and propose a weight method of trust attribute. Furthermore, from the perspective of game theory, we design the mixed strategy Nash equilibrium mechanism and give the game control condition based on trust prediction and payment matrix to encourage the participant to continue honest strategy. The experimental results show that our research is feasible and effective in cloud services. Furthermore, compared with other two models (RCST and FFCT), our model shows considerable advantages in terms of trust evaluation accuracy and cooperation rate.
In the future, we will use trust-game-based access control in a more complex scenario, develop more advanced technology, and design more experiments to further improve the effectiveness in mobile cloud environments [26, 31, 32].
Conflicts of Interest
The authors declare that they have no conflicts of interest.
Acknowledgments
This work was financially supported by the National Development and Reform Commission, Information Security Special Project, Development and Reform Office, under No. 1424 (2012).
Open Research
Data Availability
The data used to support the findings of this study are included within the article.


