Ball Screw Fault Detection and Location Based on Outlier and Instantaneous Rotational Frequency Estimation
Abstract
Ball screw, as a crucial component, is widely used in various rotating machines. Its health condition significantly influences the efficiency and position precision of rotating machines. Therefore, it is important to accurately detect faults and estimate fault location in a ball screw system to make sure that the ball screw system runs safely and effectively. However, there are few research studies concerning the topic. The aim of this paper is to fill the gap. In this paper, we propose a method to automatically detect and locate faults in a ball screw system. The proposed method mainly consists of two steps: fault time estimation and instantaneous rotational frequency extraction. In the first step, a statistics-based outlier detection method is proposed to involve the fault information mixing in vibration signals and estimate the fault time. In the second step, a parameterized time-frequency analysis method is utilized to extract the instantaneous rotational frequency of the ball screw system. Once the fault time and instantaneous rotational frequency are estimated, the fault location in a ball screw system is calculated through an integral operation. In order to verify the effectiveness of the proposed method, two fault location experiments under the constant and varying speed conditions are conducted in a ball screw failure simulation testbed. The results demonstrate that the proposed method is able to accurately detect the faults in a ball screw system and estimate the fault location within an error of 22%.
1. Introduction
Ball screw, a low-friction transmission component providing acceptably smooth motions with relatively high stiffness, is widely used in rotating machines. Due to the tough operation environment and overload, ball screw is one of the most common failure components in rotating machines. Its failure may lead to an equipment breakdown, loss of production and income, and even human casualties [1, 2]. Therefore, the fault detection and fault location of a ball screw system are important and play a curial role for the reliable operation of rotating machines [3–5].
Although faults of a ball screw system are widespread in rotating machines, to the best of our knowledge, there are limited research reports concerning on health monitoring and fault location of a ball screw system. Jin et al. [6] proposed an intelligent fault diagnosis method to classify multiple failure modes of a ball screw system. Zhang et al. [7] developed a deep learning based condition monitoring system to classify the health condition of a ball screw system. Tsai et al. [8] proposed a technique to determine the onset of preload loss in a ball screw feed drive system via monitoring the change of ball pass frequency. Feng and Pan [9] set up an embedded sensing system for precisely measuring acceleration and temperature of interest points on a ball screw system. This system is able to diagnosis different ball screw preloads through processing acquired signals with further classification using support vector machine method. Han et al. [10] developed a fault diagnosis approach of a ball screw system for determining the running distance at which initial lubrication degradation occurs. Li et al. [11] proposed a systematic methodology for ball screw prognosis to implement the fault diagnosis, early diagnosis, health assessment, and remaining useful life prediction. It can be found that the abovementioned research studies mainly focused on some specific failure models classification of a ball screw system and achieved good results. However, there is no research on the fault location.
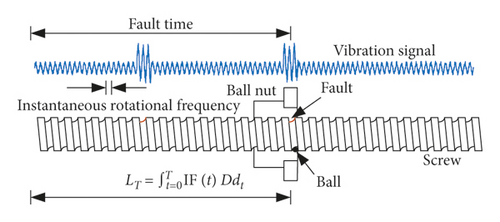
Actually, the core procedure of fault time estimation is the detection of outliers hidden in vibration signals. Concretely, after long-time or overload operation, some defects, such as fatigue and wear, may be found in a ball screw system. When balls roll through those defect regions, the abnormal mechanical vibration characteristics in amplitude and frequency can be detected [13]. Therefore, the intuitive method for ball screw fault detection is outlier detection of vibration signals. Generally, the faults of ball bearings can be detected and localized through the vertical-horizontal synchronization quantitative diagnosis method [14]. Beyond that, the fault detection could be thought of as one problem of outlier detection. Outlier detection refers to the problem of finding points that do not conform to the expected behavior [15, 16]. One of the simplest methods is 3σ principle based outlier detection, which is designed to detect all data instances that are more than 3σ distance away from the distribution mean μ. Currently, the 3σ principle-based outlier detection methods have been employed in many tasks [17, 18].
The IRF extraction has been a hot research topic in recent years, and a large number of reports on this topic have been published. Bonnardot et al. [19] proposed a method for rotating speed reconstruction. In this method, the IRF estimation via vibration signals selected a suitable frequency band around the shaft frequency and then phased demodulating on this band. Combet and Gelman [20] extended the work from Bonnardot et al. [19] and provided some guidelines for the choice of the best band for demodulation. In recent contributions to this area, a promising approach is to use time-frequency representation of vibration signals to extract IRF, since it could produce robust results under noise conditions [21–25]. Typical methods in a broad class of time-frequency analysis include short-time Fourier transfer [26], Wigner–Ville distribution [27], and wavelets [28]. Although those abovementioned nonparameterized time-frequency analysis methods produce promising results and find successful application in IRF extraction, they suffer from a resolution limitation. Alternatively, parameterized time-frequency analysis methods may be more powerful than the nonparameterized ones for IRF extraction since the advantage of improved resolution. The parameterized time-frequency analysis uses some signal dependent parameters to characterize the time-frequency features of the signals to be analyzed. The chirplet transform [29, 30] is another kind of linear time-frequency analysis method which is particularly designed for the analysis of chirp-like signals with linear instantaneous frequency. Yang et al. [31–33] proposed a series of parameter estimation procedures for the parameterized time-frequency analysis to analyze nonstationary vibration signals, such as linear transforms-based methods [31], polynomical chirplet transform [32], and spline chirplet transform [33]. Nowadays, those methods have been widely used in instantaneous frequency estimation and received promising results.
- (1)
A 3σ principle-based outlier detection method is proposed to detect faults in a ball screw system and estimate the corresponding fault time. Generally, when a ball rolls over the defect section of a ball screw, the amplitude of acquired vibration signals increases. Based on the statistical characteristics, a point whose amplitude exceeds a predefined 3σ threshold can be recognized as an outlier one. The corresponding outlier time is recognized as the fault time.
- (2)
A fault location method of a ball screw system based on the outlier detection and IRF extraction is proposed. In this method, the IRF is extracted through parameterized time-frequency analysis, and the fault time is estimated through the 3σ principle-based outlier detection method. The result of IRF integration under the fault time is the fault location of a ball screw system.
- (3)
In the designed experiment testbed, two fault location experiments under the constant and varying speed condition are conducted. The experimental results demonstrate the effectiveness of the proposed method for fault detection and location of a ball screw system.
The rest of the paper is organized as follows. Section 2 introduces the parameterized time-frequency analysis method. The detailed procedure of the proposed method is presented in Section 3. Using the designed experiment platform, the performance of the proposed method is evaluated in Section 4. Finally, conclusions are drawn in Section 5.
2. Preliminary
3. Proposed Method
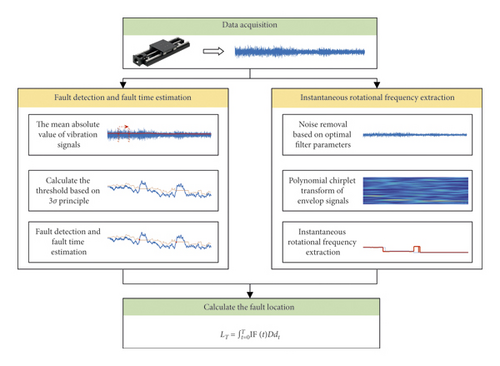
The main purpose of the proposed method is to locate faults appearing in a ball screw system. According to equation (1), once the fault time and IRF are estimated, the fault locations can be easily calculated. Therefore, as shown in Figure 2, the proposed method mainly consists of three steps: data acquisition, fault time estimation and IRF extraction, and fault location. In the step of data acquisition, an accelerometer is installed in a nut which moves along a screw. In consequence, the acquired vibration signal is able to monitor the condition of a ball screw system. Then, in the stage of fault time estimation and IRF extraction, the fault time and IRF information are all extracted from the acquired vibration signals. This stage is the crucial one for the proposed method, and we detail it as follows.
3.1. Fault Detection and Fault Time Estimation
When balls roll over fault defect regions of a ball screw system, the unstable contact between balls and a screw may produce an impact. The impact results in outliers hide in monitoring vibration signals. Therefore, a 3σ principle-based outlier detection method is proposed in this paper to detect outlier region in the monitoring vibration signal to find out faults in a ball screw system and estimate corresponding fault time. The detailed flowchart of the proposed fault detection and fault time estimation method is shown in Figure 3. Moreover, the whole procedure mainly includes three substeps, which are detailed in the following.

3.1.1. Data Preprocessing
3.1.2. Fault Detection
3.1.3. Fault Time Estimation
3.2. Instantaneous Rotational Frequency Extraction
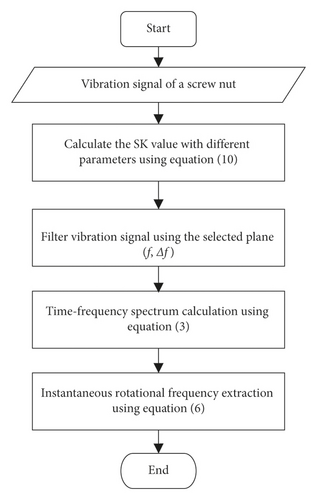
The above step estimates the fault time. In this step, we set up a method to extract IRF from the acquired vibration signals. The flowchart of the IRF extraction is shown in Figure 4. Additionally, the detailed procedure is concluded as the following three steps.
3.2.1. Data Preprocessing
3.2.2. Time-Frequency Analysis
The filtered signals are demodulated through Hilbert transform to obtain the envelope signals. The envelop signals are transferred into a time-frequency spectrum through polynomial chirplet transform. The amplitude of time-frequency spectrum is calculated using equation (3).
3.2.3. IRF Estimation
Based on the theoretical rotational frequency fmax of a system, the maximum value in a frequency range [0, fmax] is extracted as the IRF. The maximum value is calculated using equation (5).
Once the fault time and IRS are estimated, the fault location is calculated using equation (1).
4. Experiment and Discussion
4.1. Experiment Data
An experiment platform, as shown in Figure 5, is designed to conduct some condition monitoring and fault location experiments of a ball screw system. This platform mainly contains two parts: a mechanical motion part and a data acquisition part. The mechanical motion part includes a synchronous motor with a ball screw and two supporting bearings. A synchronous motor acts as the actuator that allows the screw to rotate through two supporting bearings and a screw nut. In order to monitor the operation condition of the ball screw system, three accelerometers are mounted. They are located in the two supporting bearings and the screw nut, respectively. A Beckhoff controller-based data acquisition card is installed to collect the vibration signals. The Beckhoff controller enables the motion control and data acquisition to be integration.
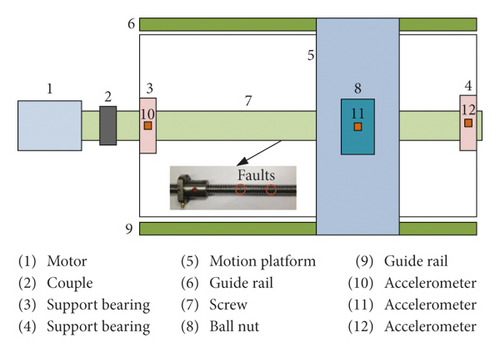
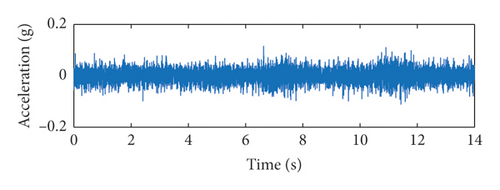
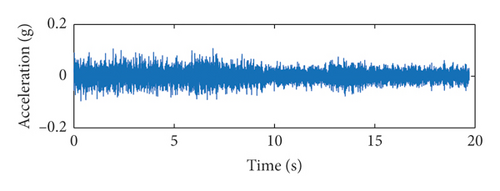
In the experiment, the test ball screw is SFU2005-4, and the detailed information is documented in Table 1. To verify the proposed fault detection and location method, two faults are simulated on the screw through an electrical discharge machining. As shown in Figure 5, the two simulated faults are located at 90 mm and 160 mm, respectively. Then, three different experiments are conducted. The speed of the first two experiments is set as piecewise static and that of the third experiment is set as dynamic. In the first experiment, the driven motor rotates with a constant speed 180 rpm, i.e. the rotational frequency is 3.00 Hz. In the second experiment, the driven motor rotates with the fluctuation speed 225 rpm, 120 rpm, and 90 rpm, i.e., the rotational frequency is 3.75 Hz, 2.00 Hz, and 1.50 Hz, respectively. In those two experiments, the vibration signals at the screw nut are acquired and shown in Figures 6(a) and 6(b), respectively.
| SFU2005-4 | ||
|---|---|---|
| Nominal diameter (mm) | Nominal lead (mm) | Ball diameter (mm) |
| 20 | 5 | 3.17 |
4.2. Fault Time Estimation
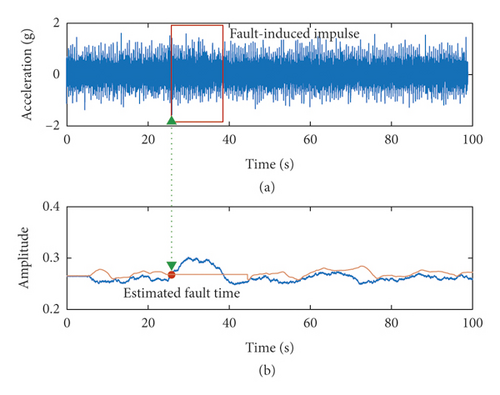
In the experiment, the amplitude of the fault-induced impulse component is N times the amplitude of the simulation signal. It should be noted that although there are some impulse components in the acquired vibration signals, they are not totally separable. Therefore, we first enhance those impulse components through calculating the mean absolute value of the segmented acquisition signals. Figure 7(b) is the result of outlier detection where the amplitude of the fault induced impulse component is 1.2 times the amplitude of the simulation signal. From the figure, it can be observed that the proposed method is able to detect the outliers in the signal. In the experiment, N is further set to range from 1.1 to 2.0. The estimated time of outliers is documented in Table 2. Those results also demonstrate the power of the proposed method for detecting outliers and estimating fault time.
| Real | Estimation of different N | |||||
|---|---|---|---|---|---|---|
| 1.1 | 1.2 | 1.5 | 1.8 | 2.0 | ||
| Time (s) | 25 | 22.7 | 25.8 | 25.5 | 25.1 | 24.8 |
| Error rate (%) | 9.2 | 3.2 | 2.0 | 0.4 | 0.8 | |
The effectiveness of the proposed fault time estimation method has been demonstrated through the above simulated case study. Now, the method is applied to process the acquired signals shown in Figure 6. The impulse components in the acquired signals are also first enhanced through the mean absolute value method. The mean window, i.e., the red window as shown in Figure 7, shifts as the time axial to obtain the smoothed curve. In this paper, the length of the mean window is set to 1000. The results of the smoothed signals are the blue line in Figure 8. It can be found that in the smoothed vibration signals, the impulse components are more salient and the noise is basically eliminated. This allows us to easily detect faults.
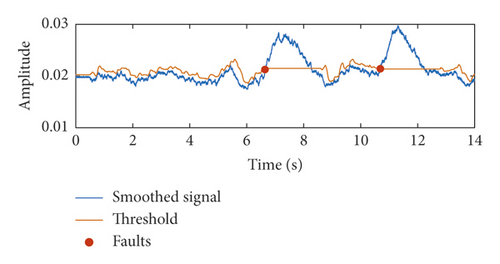
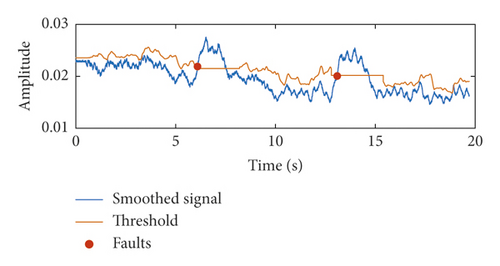
Then, we detect faults and estimate the fault time using the 3σ principle-based outlier detection method. The results are presented in Figure 8. In the figure, the orange line is the failure threshold calculating through equation (7), and the red points are the detected outliers which are also the fault points. The estimated fault time are documented in Table 3.
| Experiments | The first fault time (s) | The second fault time (s) |
|---|---|---|
| 1 | 6.64 | 10.69 |
| 2 | 6.09 | 13.09 |
4.3. Instantaneous Rotational Frequency Estimation
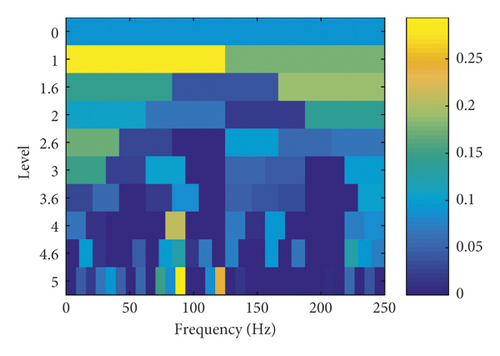
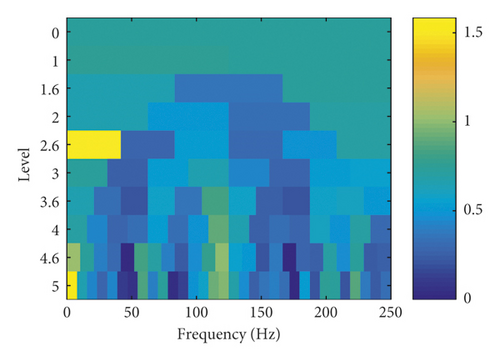
As the procedure of the proposed method as shown in Figure 4, we extract the IRF of the test ball screw system as the following steps. Firstly, the optimal bandpass filter parameters are selected. Depending on the length of signals, the maximum decomposition level is set to 5, the spectral kurtosis of different filter parameters is calculated, and the results are plotted in Figure 9. For the acquired signals in the constant speed, the optimal filter parameter is a center frequency fc = 62.5 Hz with a bandwidth Bw = 125 Hz. For the signals in the varying speed, the optimal filter parameter is a center frequency fc = 20.8 Hz with a bandwidth Bw = 41.7 Hz.
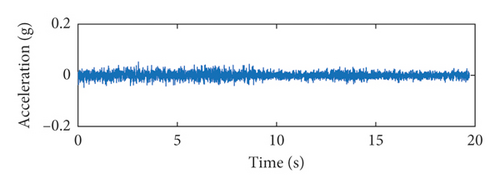
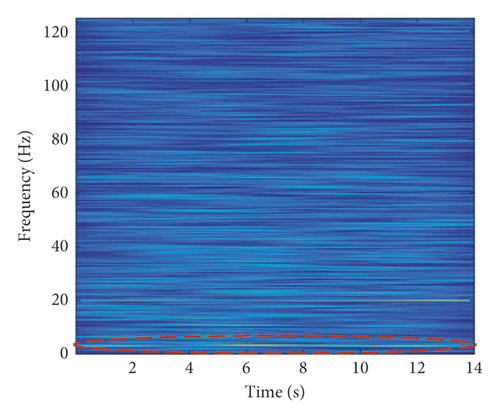
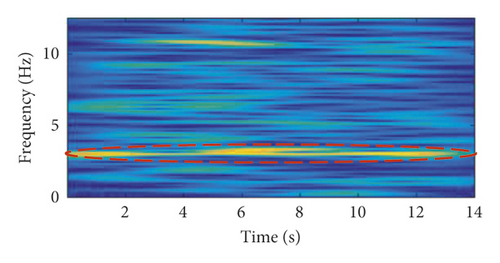
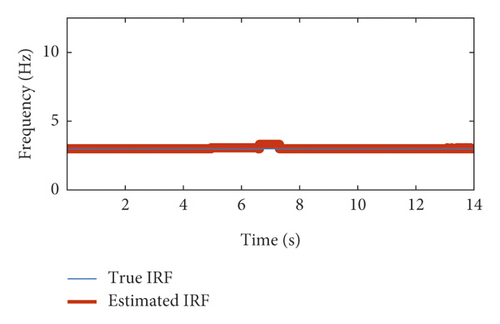
Once obtaining those optimal filter parameters, the acquired vibration signals are filtered using the bandpass filter, and the results are shown in Figure 10. From those figures, the noise hidden in the periodic signals are basically removed, which allows the IRF estimation to be easier. Finally, the polynomial chirplet transform is applied to obtain the time-frequency spectrum of the filtered signals. The time-frequency distribution is shown in Figure 11. Figure 11(b) is the detailed exhibition of Figure 11(a) in the frequency span [0, 12.5] which is decided by the rated speed of the driven motor applied in the experiment platform, in which the IRF and its harmonic curves are clearly exhibited. According to equation (5), the IRF of the constant speed is calculated and shown in Figure 11(c), i.e., the red line. Compared to the real IRF, i.e., the blue line in Figure 11(c), the estimated IRF is almost stationary and equals to the true IRF. Figure 11(d) is the result of vibration signals from the varying speed experiment. Also, its processing procedures are same as the constant speed experiment. In Figure 11(f), it can be found that the estimated IRF is mixed and unstable at the junction points of different rotating speeds, and this may be caused by the length of data truncation window in equation (8). Although the estimated IRF is unstable at the junction points, it generally remains stable at the condition of the constant speed.

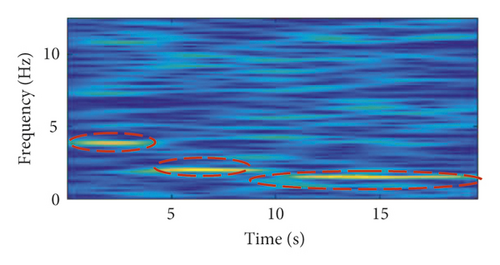
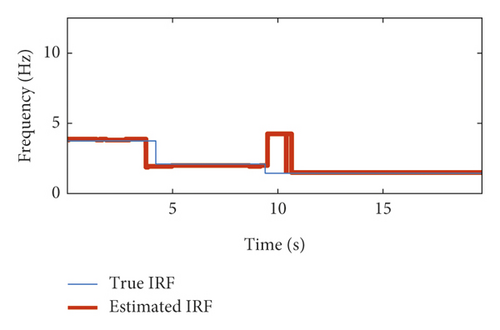
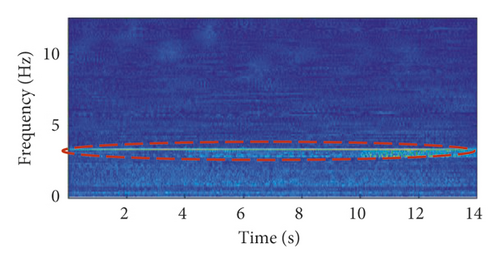
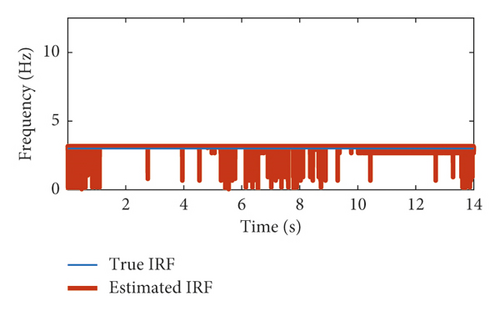
In order to validate the superiority of the proposed method, a comparison experiment is conducted. In the experiment, a commonly used time-frequency analysis technique, continuous wavelet transform (CWT) [32], is applied to compare with the method in the paper. In the experiment, the comr3-3 in MATLAB is applied to process the acquired vibration signal. From Figure 12, it can be seen that the extracted IRF based on CWT presents to be obvious fluctuation. It seems that the smoothness and stability of the CWT-based method are worse than those of the proposed method. The fluctuation and instability may affect the estimation of IRF and fault location. The comparison experiment indicates that the proposed method presents the superiority for the IRF estimation.
4.4. Dynamic Speed Estimation
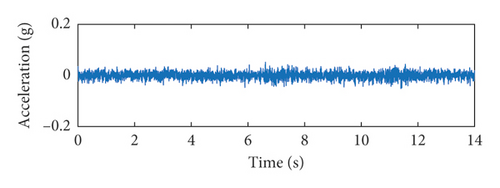
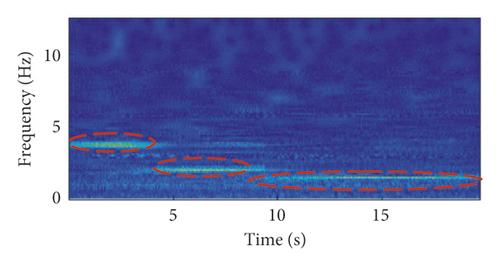
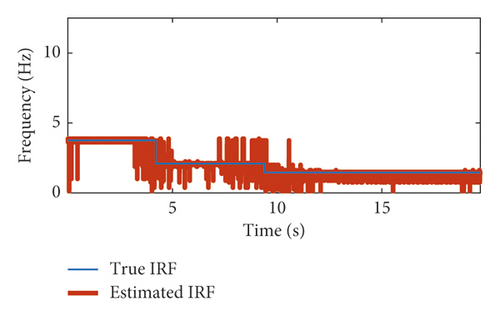
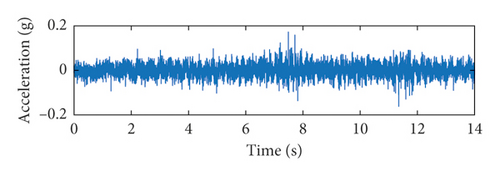
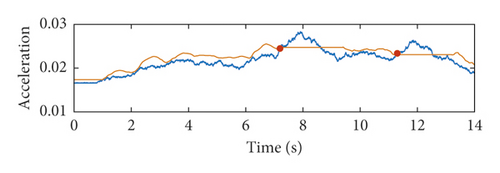
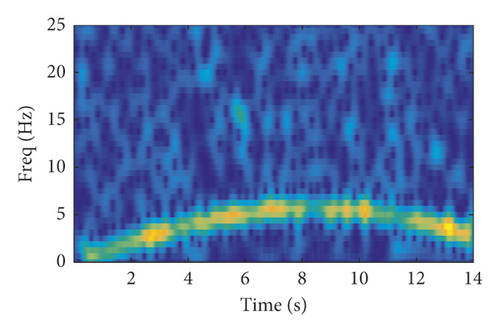
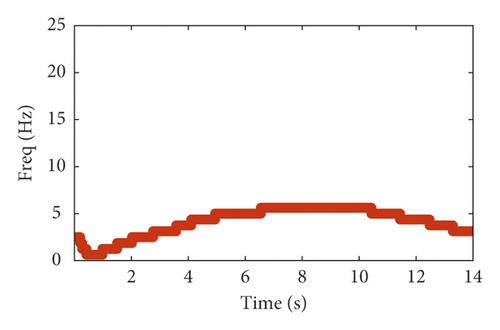
The speed of the above two experiments is set as piecewise static without fluctuations. However, in the industrial application, the speed of a ball screw may be dynamic. Therefore, in order to further validate the effectiveness of the proposed method, a dynamic speed experiment is conducted. In the experiment, the speed of the testing ball screw varies with the running time. The raw vibration signal of this experiment is shown in Figure 13(a). Firstly, in the step of fault time estimation, the length of the mean window is also set to 1000. The fault points of the smoothed signals are detected as shown in Figure 13(a). The first and second fault time is estimated as 7.5 s and 11.2 s, respectively. Secondly, in the step of IRF estimation, the vibration signal is filtered through the center frequency with the bandwidth. The time-frequency spectrum of the vibration signal is calculated with the polynomial chirplet transform, as indicated in Figure 14(a). At last, the IRF can be estimated through equation (5), as shown in Figure 14(b).
4.5. Fault Location
| The first fault | The second fault | ||||
|---|---|---|---|---|---|
| Location (mm) | Re | Location (mm) | Re | ||
| Real | 90 | 160 | |||
| Proposed method | Exp1 | 84 | 6.67 | 171 | 6.88 |
| Exp2 | 79 | 12.22 | 178 | 11.25 | |
| Exp3 | 97 | 7.78 | 177 | 10.62 | |
| CWT based method | Exp1 | 81 | 10.00 | 186 | 16.25 |
| Exp2 | 75 | 16.67 | 194 | 21.25 | |
| Exp2 | 101 | 12.22 | 185 | 15.62 | |
Furthermore, from Table 4, it is seen that the relation error at the constant speed experiment is much smaller than the one at the varying speed experiment. That is the reason of dynamic accumulation error. Additionally, the relation error results of the three experiments are less than 22%, and it indicates that the proposed method is able to locate the faults in the ball screw system within a small error. This enables the proposed method to be potentially applied to the industrial field.
5. Conclusions
This paper proposes a ball screw fault detection and location method. Firstly, we set up a 3σ principle-based fault detection method, which allows us to discover faults of a ball screw system and calculate the fault time. A simulated case study verifies that the proposed 3σ principle-based fault detection method is able to detect faults under various compact levels. Then, the polynomial chirplet transform is utilized to estimate the IRF of the test ball screw, and the polynomial chirplet transform-based method produces a better result than the CWT-based method for the IRF estimation. Combining the estimated fault time with the extracted IRF, fault locations of the ball screw system are calculated. In order to verify the effectiveness of the proposed method, an experiment platform of the ball screw system is designed. In the experiment platform, two experiments, i.e., the constant speed and the varying speed, are conducted to test the proposed fault detection and location method. The results demonstrate that the proposed method is able to detect faults effectively and locate faults within a small error.
Conflicts of Interest
The authors declare that they have no conflicts of interest.
Acknowledgments
This research was supported by the National Natural Science Foundation of China (no. 51775452) and Fundamental Research Funds for the Central Universities (2682019CX35 and 2018GF02).
Open Research
Data Availability
The experiments are conducted with the support of a company. The company does not want to make the experiment data public currently.


