A Binary Logistic Regression Model for Severe Convective Weather with Numerical Model Data
Abstract
Based on meteorological observations and products of a GRAPES and an ECMWF model from March to April 2014, some indexes and parameters with good relevancy were selected as predictors. Through analyzing the spatial distributions and the binary logistic regressions of the indexes, estimated values of the predictors and severe convective weather diagnostic prediction equations were established to get a severe weather predictor P for forecasting severe convective weather for the next 12 hours in Guangdong province. The equations were tested and analyzed, respectively, with the two models as well as the radiosonde data. The results indicated that the severe weather forecasts’ CSI by the predictor P was obviously higher than by any single index. The TT error between the models and the soundings was small, while the K index of the models was more discrete than the soundings. The index MDPIs were 1 greater than the soundings, but their trends of change were consistent with the soundings.
1. Introduction
Severe convective weather is the main severe weather in the Guangdong Province, China, during its first flood season. The severe convective weather affecting Guangdong Province mainly includes severe thunderstorm wind gusts (gusts ≥17.2 m/s), hail, tornadoes, and short-time heavy rains (hourly rainfall ≥20 mm). In recent years, there have been many researches on severe convective weather forecasting methods in the world. The comprehensive use of a physical quantity index for potential forecasting is one of the important methods. Li and Jianwen [1] pointed out that the downdraft convective available potential energy and wind index present the downward convection and micro-downburst, respectively. Downward convection is closely related with the altitude of the dry intrusive, the dryness of the air, the instability, and the humidity of the low-level atmosphere. A proper vertical wind shear is favorable to severe storms. The storm relative helicity is a predictive factor for severe storms. The bulk Richardson number reflects the balance between convective energy and dynamic effect. The energetic helicity index reflects the combination of the buoyancy energy and the dynamic effect.
The binary logistic regression model [2], based on the logistic function, is generally used to study the nature of dependence of a dichotomous response variable (Y) on a number of explanatory variables (X1, X2, and Xk), which are either discrete or continuous in nature. Although used extensively in epidemiology, the use of logistic regression in the context of meteorology is of a recent origin. Sanchez et al. [3] have applied this model to the short-term forecast of hail risk in the province of Leon in the northwestern Iberian Peninsula of Spain.
A total of 31 indexes [4] describing conditions of humidity, stability, helicity, or precipitable water were used as input to a binary logistic regression model. Of the 31 indexes, 5 were selected: Showalter index (SI), wind speed at 500 hPa (SPD500), dew point temperature at 850 hPa (Td850), relative helicity between 0 and 3 km (SREH3km), and wet bulb zero height (WBZ). It is suggested that these results provide a new tool that complements those previously developed for this study area, toward improving severe storms prediction and pinpointing these storms in space and in time. Trenton and Labosier [5] examined drought persistence in the Southeastern United States by identifying spatial patterns of seasonal drought frequency and persistence, using logistic regression to calculate the odds and probability of drought persisting from one season to the next, and examined the effects of El Nino–Southern Oscillation (ENSO) drought persistence in the southeast. Lee [6] associated geopotential height and temperature fields to historic F2 and stronger United States’ tornadoes days using binary logistic regression. Using output data from two Global Climate Models (GCMs), spanning five different model emissions scenarios, this synoptic climatology of tornadoes is then utilized in order to project the changes in the frequency and seasonality of tornadic environments due to a changing climate. Dasgupta and De [7] considered binary logistic regression models for prediction of convective developments from a prior knowledge of the values of the certain dynamic and thermodynamic parameters. Holden and Wright [8] pointed out that tornado distribution was shown to be significantly affected by topography and the density of potential observers. The binary logistic regression was used to predict actual tornado occurrences across England, Wales, and Scotland during the 5-year study period. Pablo et al. [9] introduced 31 stability indexes in a binary logistic regression model, which selected the most accurate ones for detecting hail days in the region, namely, the Showalter index, dew point temperature at 850 hPa, and TQ index. The new forecast tool shows satisfactory results and complements other studies in the same region, and it can be a useful tool for operational forecasters in predicting hail days and determining the spatial distribution of hailfalls.
In recent years, Pang et al. [10–13] used indexes calculated with the radiosonde data as a potential forecasting factor and made related studies on the severe convective weather potential forecasting in the Guangdong Province. Most of the researches were based on the real-time data, which are of poor temporal and spatial resolutions. To improve these resolutions, products of GRAPES, a new numerical weather prediction model (NWP) developed in China with a resolution of 12 km, are adopted in this study. At the same time, ECMWF (EC) products with a resolution of 25 km were used to compare and analyze the prediction effects.
2. Source of Data and Procedures of Calculating
In this study, meteorological observation products of the GRAPES and EC models from March to April, 2014, were used. The severe convective weather includes severe thunderstorm wind gusts and short-term heavy rains. The indexes were calculated by the model data such as K index TT index, MDPI index, and IQ index. Except for the original data of the models, no other products were used.
- (1)
Find out the severe convective weather events in Guangdong Province over the years.
- (2)
The criterion for judging whether a severe convective weather event occurred at a model grid is as follows: if there are three or more severe weather reports in a square from the center of a model grid to the adjacent grid; the grid recorded that there is severe convective weather, otherwise none.
- (3)
According to the spatial and temporal distribution characteristics of these model grid data, find out the indexes which have good correlation with the severe convective weather events.
- (4)
The binary logistic regression model will be established based on the indexes which determines whether severe convective weather events occurred and not. According to the binary logistic regression model, the prediction factor (P) of severe convective weather events will be calculated.
3. Correlations between Indexes and Severe Convective Weather Events
Based on 184904 grid samples of GRAPES from March to April, 2014, and the correlation coefficients of 16 indexes (Table 1) and severe convective weather were analyzed statistically. It was shown that the correlation coefficients of K index, TT index, MDPI index, and IQ index with severe convective weather were among the highest and passed the significant test at 0.01 level, respectively, reaching 0.09, 0.12, 0.13, and 0.1. The positive correlation of Q850-hPa, θse(850-hPa), T850-hPa-500-hPa, WS850-hPa, VV850-hPa, ω925-hPa, DIV925-hPa, Q925-hPa, θse(925-hPa), VV925-hPa, and other indexes with severe convective weather were weak but passed the significant test at 0.01 level. The negative correlation of VFD850-hPa and VFD925-hPa was weak and passed the significant test at 0.01 level (Table 2). Considering comprehensively, the indexes which had higher correlations with severe convective weather events, the K index, TT index, MDPI index, and IQ index were selected.
| Index | Abbreviation of index |
|---|---|
| 850 hPa vapor flux divergence | VFD850-hPa |
| K Index | K |
| 850 hPa specific humidity | Q850-hPa |
| Total totals | TT |
| The microburst-day potential index | MDPI |
| 850 hPa potential pseudoequivalent temperature | θse(850-hPa) |
| Temperature difference between 850 hPa and 500 hPa | T850-hPa-500-hPa |
| 850 hPa wind shear | WS850-hPa |
| 850 hPa vertical velocity | VV850-hPa |
| 925 hPa vorticity | ω925-hPa |
| 925 hPa divergence | DIV925-hPa |
| 925 hPa vapor flux divergence | VFD925-hPa |
| 925 hPa specific humidity | Q925-hPa |
| 925 hPa Potential pseudoequivalent temperature | θse(925-hPa) |
| 925 hPa vertical velocity | VV925-hPa |
| Integral Q | IQ |
| Index | VFD850-hPa | K | Q850-hPa | TT | MDPI | θse(850-hPa) | T850-hPa-500-hPa | WS850-hPa |
|---|---|---|---|---|---|---|---|---|
| Correlation coefficient | −0.02 | 0.09 | 0.06 | 0.12 | 0.13 | 0.05 | 0.08 | 0.04 |
| Index | VV850-hPa | ω925-hPa | DIV925-hPa | VFD925-hPa | Q925-hPa | θse(925-hPa) | VV925-hPa | IQ |
| Correlation coefficient | 0.02 | 0.02 | −0.04 | −0.05 | 0.07 | 0.05 | 0.05 | 0.1 |
4. Establishment of Binary Logistic Regression Model
4.1. Probability Formula of Logistic Regression
Regression is a statistical analysis method [11] that studies whether there is a linear or nonlinear relationship between one or more independent variables and a dependent variable. It is suitable to analyze the relationship between the occurrence of severe convective weather (dependent variable) and each index (independent variable) by binary logistic regression.
It can be seen from the above two equations that the probability caused by a test sample has a curvilinear relationship to the related factors.
We call P/Q the ratio and β1, β2, …, βm the logistic regression coefficients.
4.2. Derivation of Logistic Regression Coefficients
In the above formula, , , i = 1,2, …, n.
5. Establishment of Severe Convective Weather Forecasting Equation Based on Two NWP Models
By using SPSS software, GRAPES indexes of 184904 grids and severe convective weather reports from March to April, 2014, were analyzed on binary logistic regression. The outputs are given in Table 3.
| Index | B | SE | Wals | Df | Sig. | Exp (B) |
|---|---|---|---|---|---|---|
| K | 0.116 | 0.12 | 100.168 | 1 | 0.000 | 1.123 |
| IQ | 0.002 | 0.000 | 751.513 | 1 | 0.000 | 1.002 |
| MDPI | 0.603 | 0.048 | 155.081 | 1 | 0.000 | 1.828 |
| TT | −0.23 | 0.011 | 4.803 | 1 | 0.000 | 0.977 |
| Constant | −16.251 | 0.41 | 1570.145 | 1 | 0.000 | 0.000 |
Similarly, the binary logistic regression results for EC indexes of 35670 grids are given in Table 4.
| Index | B | S.E. | Wals | Df | Sig. | Exp (B) |
|---|---|---|---|---|---|---|
| K | −0.098 | 0.006 | 243.151 | 1 | 0.000 | 0.906 |
| IQ | 0.511 | 24.752 | 0.000 | 1 | 0.984 | 1.667 |
| MDPI | 0.067 | 0.169 | 0.155 | 1 | 0.694 | 1.069 |
| TT | 0.20 | 0.013 | 244.178 | 1 | 0.000 | 1.222 |
| Constant | −9.834 | 0.356 | 761.342 | 1 | 0.000 | 0.000 |
6. Goodness-of-Fit Testing of Forecasting Equation
The regression testing is required after constructing the logistic regression model. There are two methods for regression testing, which are regression coefficient testing and goodness-of-fit testing. We tested the goodness-of-fit of the regression equation. There are three kinds of tests for the goodness-of-fit, −2 logarithm likelihood values (the logistic regression model uses the maximum likelihood for parameter estimation, and the likelihood value is the probability of obtaining the observation under certain parameter estimation conditions; the larger the maximum likelihood value, the better the model fits), the Cox & Snell R Square, and the Nagelkerke R Square (the better the effect, the closer the value is to 1). In Table 5, it could be seen that the Cox & Snell R Square and the Nagelkerke R Square of the two models were not ideally fitted, and the results were 0.026, 0.151, 0.016, and 0.088. However, both the −2 logarithm likelihood values are large and obviously significant.
| NWP model | −2 logarithm likelihood values | Cox & Snell R Square | Nagelkerke R Square |
|---|---|---|---|
| GRAPES | 30591.374a | 0.026 | 0.151 |
| EC | 6648.102a | 0.016 | 0.088 |
Table 6 is the verification of the GRAPE-based model. When the observation is equal to 0, which means no severe convection weather occurred, the forecasting succeeded 162,033 times and failed 19,263 times, reaching up to 89.4% accuracy. When the observation is equal to 1, which means severe convection weather occurred, the forecasting succeeded 1,485 times and failed 2,123 times, reaching up to 41.2% accuracy. The total verification accuracy rate is 88.4%, indicating that the GRAPES-based model was stable.
| Observation | Forecasting | Forecasting accuracy | |
|---|---|---|---|
| 0 | 1 | ||
| 0 | 162033 | 19263 | 89.4 |
| 1 | 2123 | 1485 | 41.2 |
| Verification accuracy | 88.4 | ||
Table 7 is the verification of the EC-based model. When the observation is equal to 0, which means no severe convection weather occurred, the forecasting succeeded 31,167 times and failed 3,758 times, reaching up to 89.2% accuracy. When the observation is equal to 1, which means severe convection weather occurred, the forecasting succeeded 269 times and failed 475 times, reaching up to 36.2% accuracy. The total verification accuracy rate is 88.1%, indicating that the EC-based model was also stable.
| Observation | Forecasting | Forecasting accuracy | |
|---|---|---|---|
| 0 | 1 | ||
| 0 | 31167 | 3758 | 89.2 |
| 1 | 475 | 269 | 36.2 |
| Verification accuracy | 88.1 | ||
The total verification accuracy rate from Tables 6 and 7 is the number of successful forecasting times divided by the total number of forecasting times.
7. Severe Convective Weather Forecast Evaluation of Forecast Equation
After the goodness-of-fit test of the model itself, the real-time forecasts by the two forecast equations were evaluated in the first flooding season of 2015 (Table 8).
| Model | Threshold of P | X | Y | Z | POD (%) | FAR (%) | CSI (%) |
|---|---|---|---|---|---|---|---|
| GRAPES | 0.03 | 2260 | 1348 | 34966 | 62.64 | 93.93 | 5.86 |
| 0.04 | 1883 | 1725 | 25660 | 52.19 | 93.16 | 6.43 | |
| 0.05 | 1485 | 2123 | 19263 | 41.16 | 92.84 | 6.49 | |
| 0.06 | 1115 | 2493 | 14725 | 30.90 | 92.96 | 6.08 | |
| 0.07 | 881 | 2727 | 11150 | 24.42 | 92.68 | 5.97 | |
| 0.08 | 669 | 2939 | 8330 | 18.54 | 92.57 | 5.60 | |
| 0.09 | 511 | 3097 | 5913 | 14.16 | 92.05 | 5.37 | |
| 0.1 | 391 | 3217 | 4040 | 10.84 | 91.18 | 5.11 | |
| EC | 0.02 | 539 | 205 | 12740 | 72.45 | 95.94 | 4.00 |
| 0.03 | 426 | 318 | 6635 | 57.26 | 93.97 | 5.77 | |
| 0.04 | 269 | 475 | 3758 | 36.16 | 93.32 | 5.98 | |
| 0.05 | 185 | 559 | 2389 | 24.87 | 92.81 | 5.90 | |
| 0.06 | 269 | 475 | 3758 | 36.16 | 93.32 | 5.98 | |
| 0.07 | 131 | 613 | 1581 | 17.61 | 92.35 | 5.63 | |
| 0.08 | 51 | 693 | 779 | 6.85 | 93.86 | 3.35 | |
| 0.09 | 29 | 715 | 545 | 3.90 | 94.95 | 2.25 | |
| 0.1 | 14 | 730 | 370 | 1.88 | 96.35 | 1.26 | |
As threshold of P in GRAPES went from 0.03 to 0.1, POD had been falling from 62.64% to 10.84%, and CSI first rose from 5.86% to 6.49% and then declined to 5.11%, while FAR stayed above 91%. As threshold of P in EC rose from 0.02 to 0.1, POD has been falling from 72.45% to 1.88%, and CSI first rose from 4.00% to 5.98% and then declined to 1.26%, while FAR stayed above 92%.
8. Contrast Analysis of Indexes on NWPs and Soundings
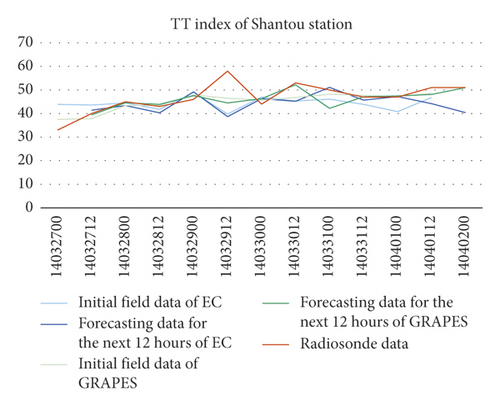
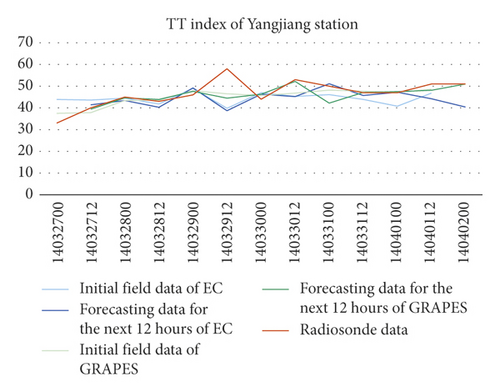
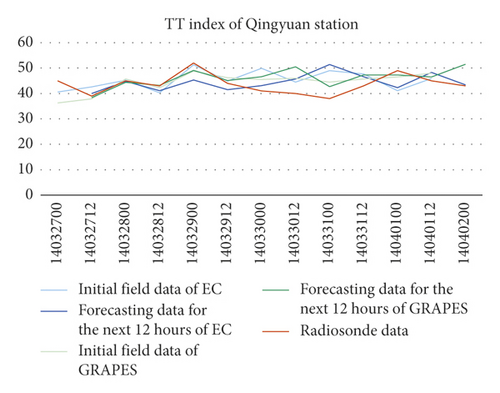
Comparing the indexes calculated using the NWP models grid data nearest to the radiosonde station and the indexes calculated using soundings of the station, it was found that the errors of TT index were small between the soundings’ and the two NWP models’, including their initial’s and the forecasting’s in the next 12 hours (Figure 1).

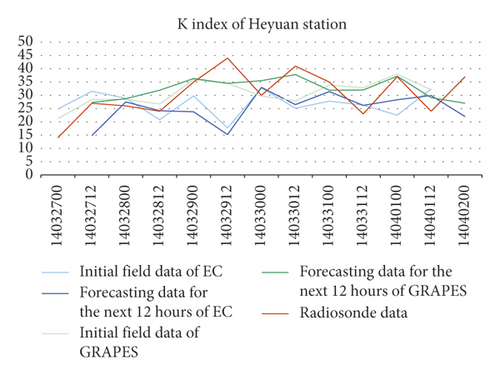
The errors of K index between the GRAPES′, including the initial’s and the forecasting’s in the next 12 hours, and the soundings’ were smaller than the EC’s. Meanwhile, the K indexes of the two NWPs were relatively discrete compared to the soundings’, and the errors of the 4 stations were all greater than TT indexes’ (Figure 2).
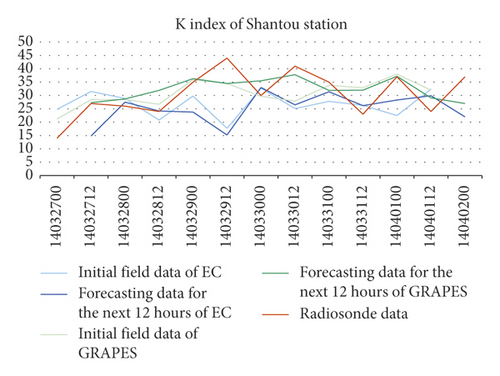
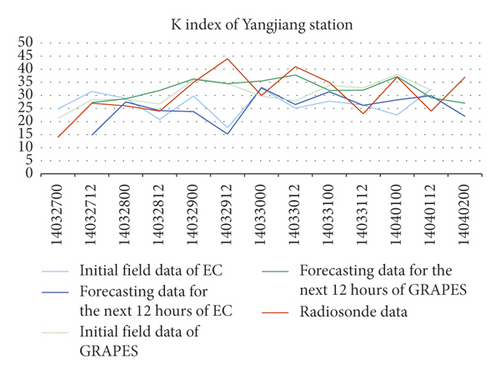
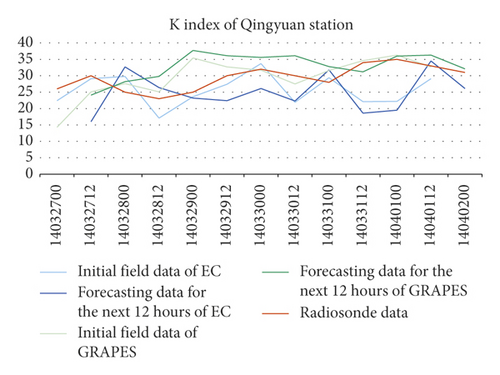
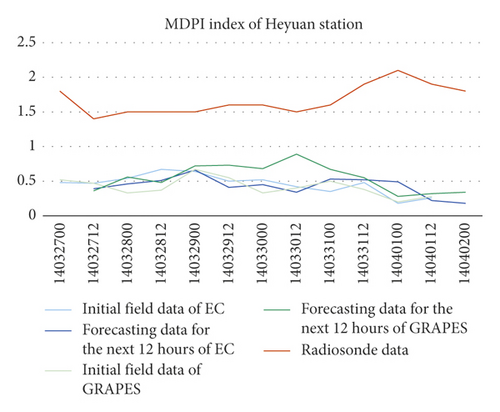
The NWP MDPI indexes of the 4 stations were greater than the soundings’ by 1 to 1.5, their trends of change were consistent with the soundings’ (Figure 3).
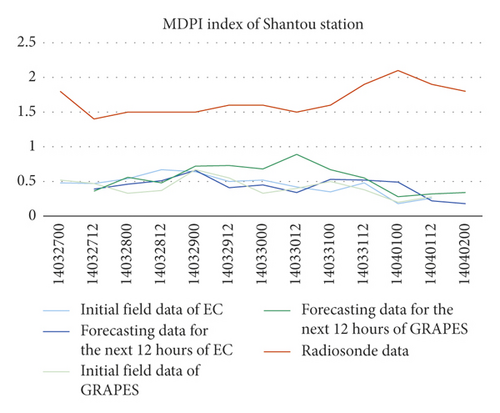
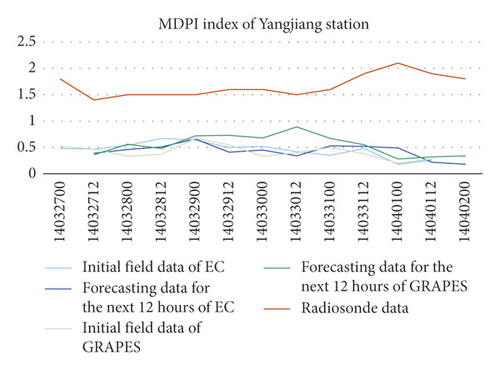
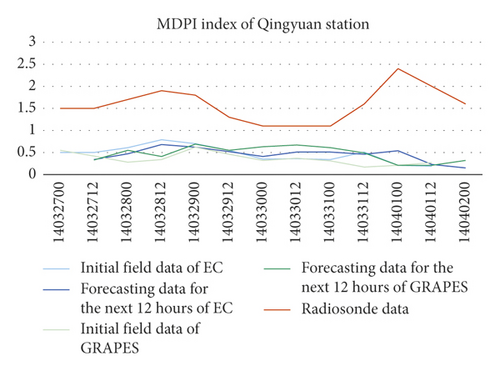
Through the spatial distribution analysis, it was found that severe convection weather occurred at 4% of the grids where GRAPES K indexes were greater than 34, meanwhile at 1.75% for EC K index. In the same time, severe convection weather occurred in the grid at 10.72% and 3.31% where IQ index was greater than 4500, at 4.52% and 7.63% where MDPI index was less than 1.5, and at 2.86% and 5.37% where TT index was greater than 40, on GRAPES and EC, respectively (Figure 4).
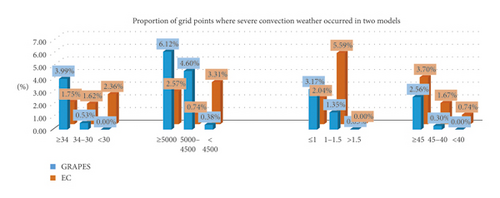
In terms of overall forecasting evaluation, both models had their advantages, and the rates of missed forecasting were low; however, the rates of false alarm were high.
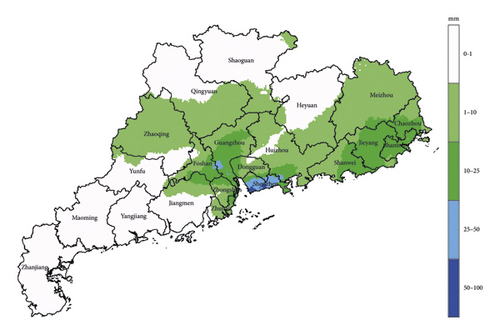
Figure 5 is the 1-hour accumulated precipitation Chart of Guangdong Province at 12:00 on March 30, 2014.
9. Analysis of Severe Convective Weather Events
9.1. Analysis of Initial Field Data and Actual Precipitation
Figure 5 shows the 1-hour cumulative precipitation of Guangdong Province recorded at 12:00 (UTC) on March 30, 2014.
Figure 6 shows K index, IQ index, MDPI index, and TT index calculated by initial field data of GRAPES, and Figure 7 shows the P index calculated by the 4 indexes.
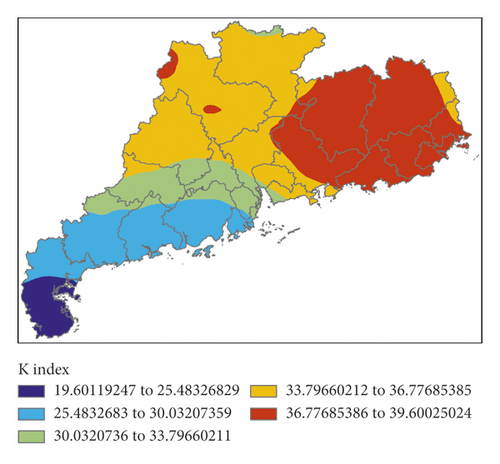
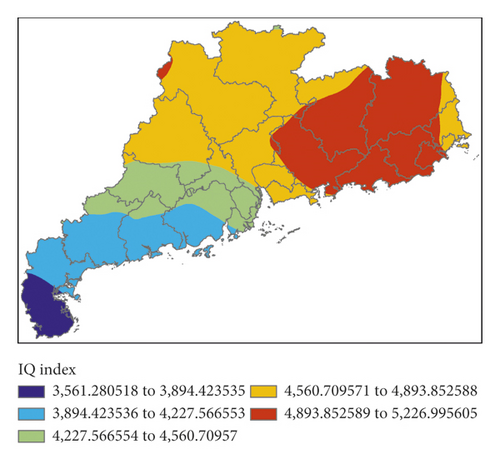
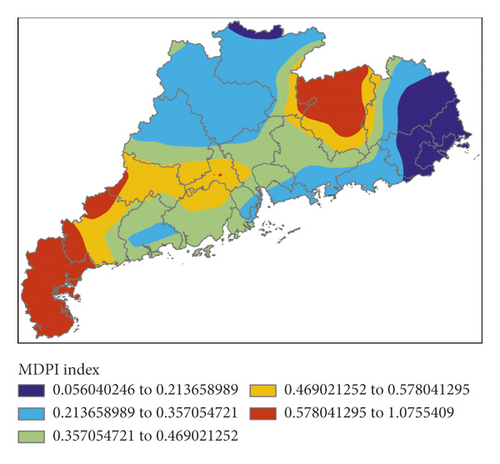
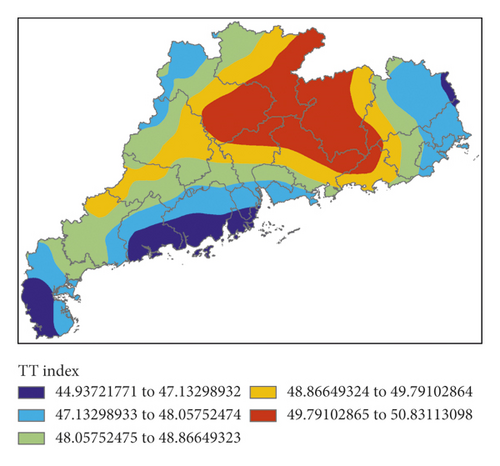
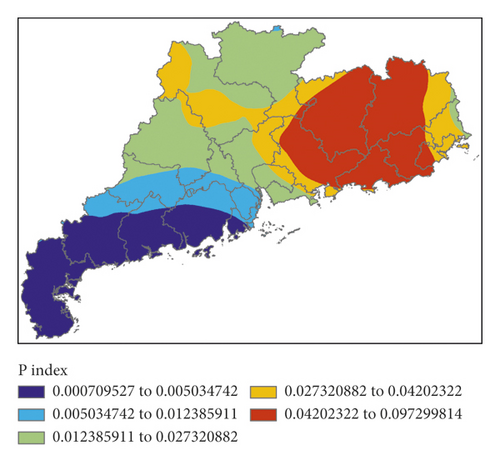
There was a rather well corresponding relationship between K index and the precipitation areas. Except for the southwest of Guangdong Province, the IQ index of the whole province was of high values, indicating that the water vapor in the air over Guangdong Province was relatively high. Except for the poor correspondence between MDPI index and precipitation areas in the north of Guangdong Province, the correspondence between the two in other areas was good. TT index corresponded well with precipitation areas. P index had a better fitting effect for the nonsignificant precipitation in the southwest of Guangdong Province but a worse fitting effect for the no precipitation in the north. However, generally speaking, P index could well fit the precipitation in the whole region.
Figure 8 shows K index, IQ index, MDPI index, and TT index calculated by initial field data of EC, and Figure 9 is the P index calculated by the 4 indexes.
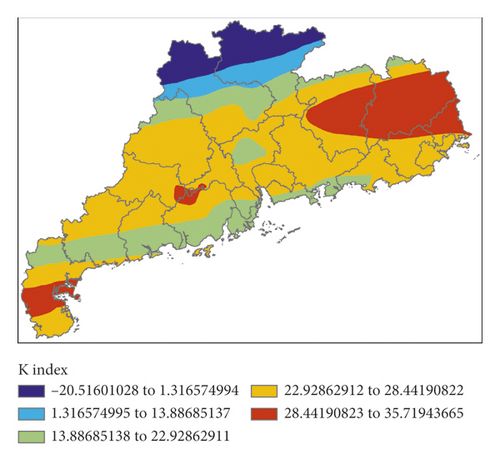
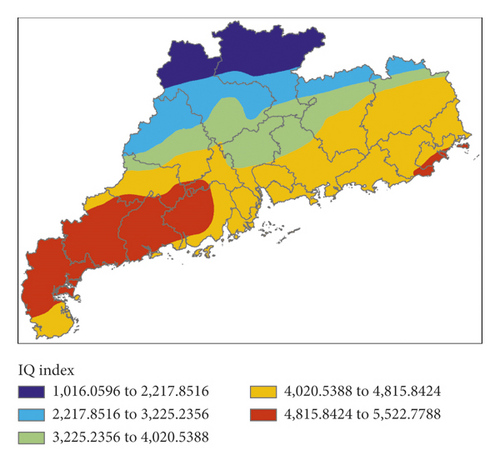
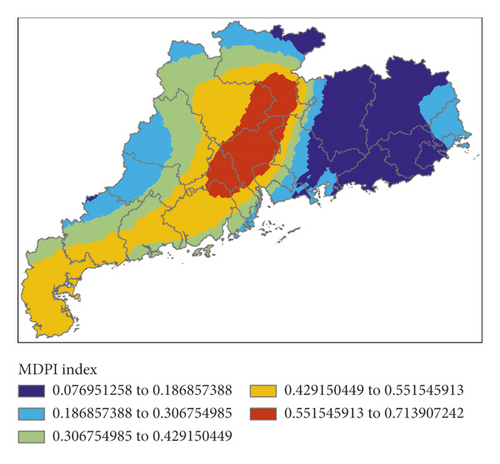
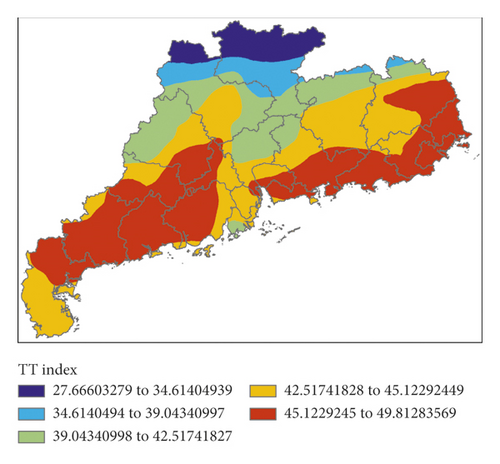
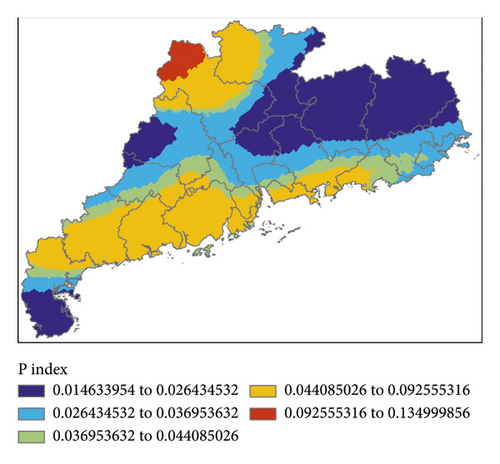
The high value areas of K index were mainly located in the eastern part of Guangdong Province and slightly east to the precipitation areas; the high value areas of IQ index were found in the western part of Guangdong Province and west to the precipitation areas. MDPI index was a good indication for the precipitation areas in the eastern part but failed to reflect the precipitation in the central part. The high value areas of TT index were to the west of the precipitation areas. To sum up, the high value areas of P index were to the south and west of the precipitation areas, and false alarm of precipitation was made for the northern part. In this event, the forecast effect of GRAPES was better than that of EC.
9.2. Analysis of Forecasting Data and Actual Precipitation
Figure 10 shows the 1-hour cumulative precipitation of Guangdong Province recorded at 00:00 on March 31, 2014.
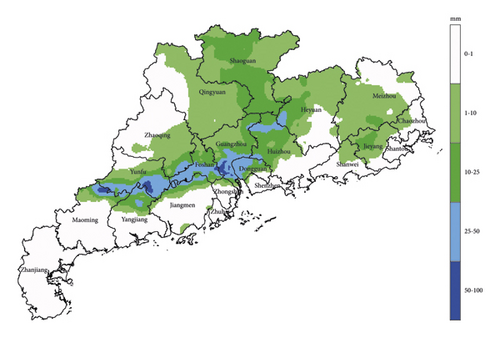
Figure 11 shows K index, IQ index, MDPI index, and TT index calculated by forecasting data for the next 12 hours (i.e., 00:00 on March 31, 2014) of GRAPES, and Figure 12 shows the P index calculated by the 4 indexes.
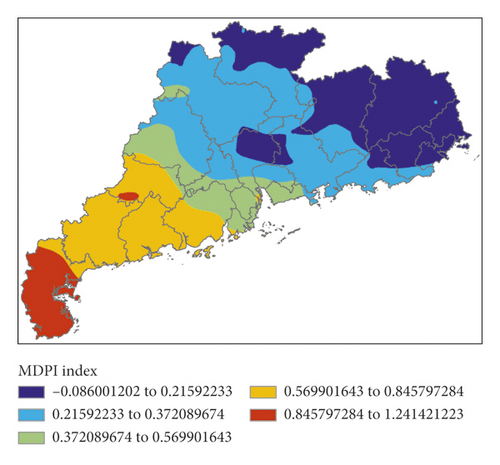
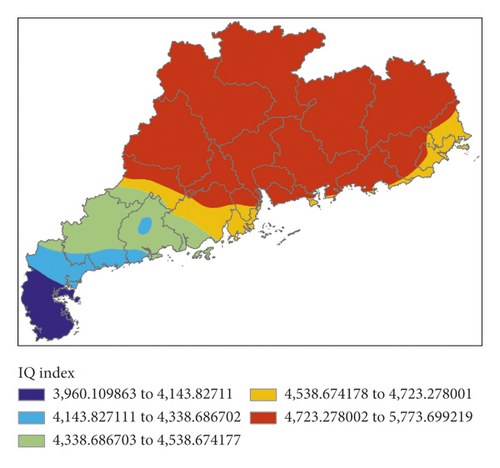
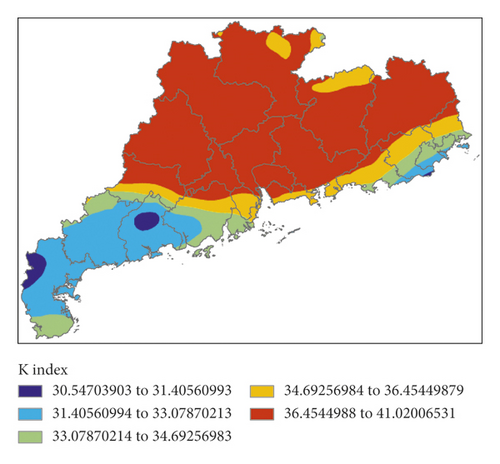
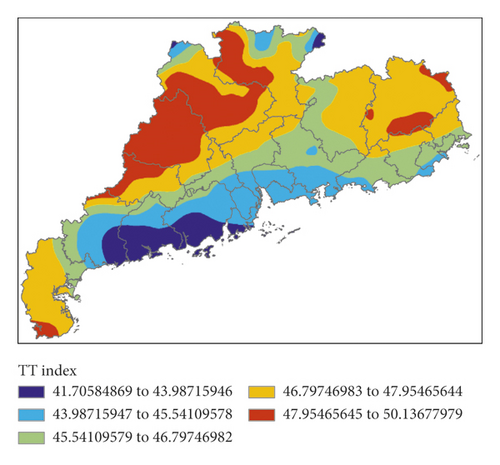
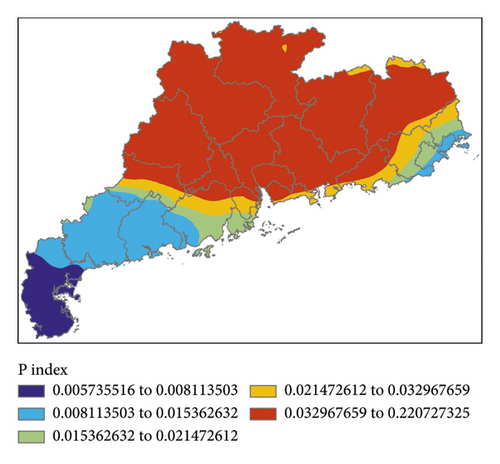
All 4 indexes indicated that there would be short-term heavy precipitation in the central and eastern parts of Guangdong Province. P index also predicted that there would be short-term heavy precipitation in most parts of Guangdong Province except for the southwest regions. As shown by the actual weather, P index accurately reflected the event that there was no short-term heavy precipitation in the southwest region, but false alarm of precipitation was made for the central and eastern parts.
Figure 13 shows K index, IQ index, MDPI index, and TT index calculated by forecasting data for the next 12 hours (i.e., 00:00 on March 31, 2014) of EC, and Figure 14 shows the P index calculated by the 4 indexes.

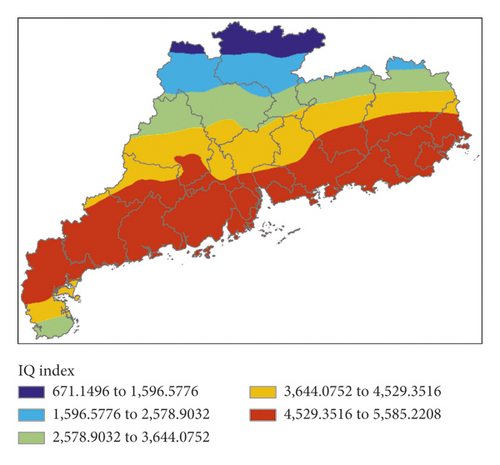
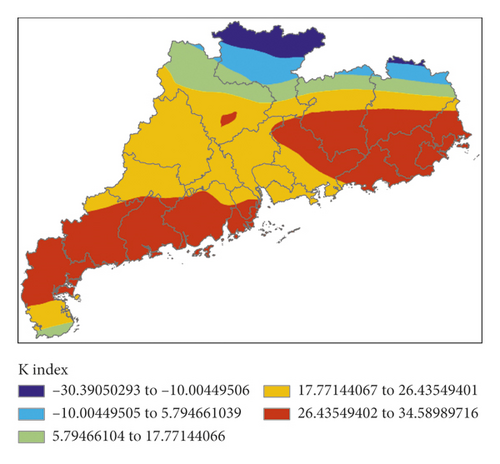
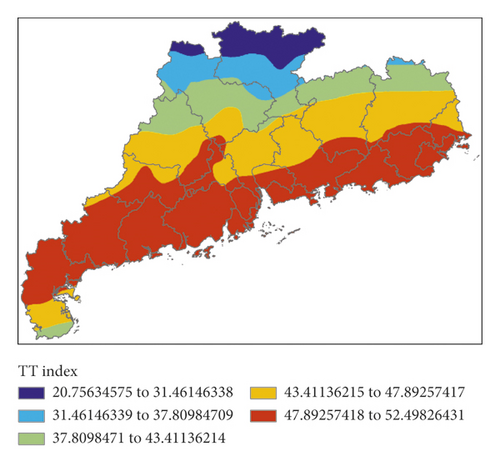
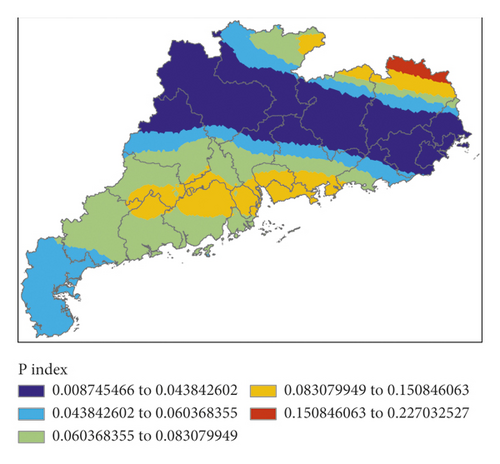
The corresponding relation between the high value areas of K index and the precipitation areas was poor, located in the eastern and western parts, respectively. The high value areas of IQ index were to the south of the precipitation areas. The high value areas of MDPI index were to the east and north of the precipitation areas. The distribution of the high value areas of TT index was similar to that of IQ index. The forecast effects of the 4 indexes were all unsatisfactory, but the high value areas of P index perfectly matched the precipitation areas in this event. In this event, the forecast effect of EC was obviously better than that of GRAPES. Although the precipitation areas were also forecasted by GRAPES, its false alarm rate was higher.
In general, according to one effect test of initial field and one effect test of forecast field, GRAPES did not generate missed alarm, while it may make false alarm. Compared with the actual precipitation areas, the precipitation areas calculated by EC model may have a deviation in location, resulting in both false alarm and missed alarm in the model test, which led to test results of a certain event even worse than those of the situation with only false alarm.
10. Summary and Discussion
- (1)
The correlation coefficients between 16 indexes and severe convection weather were analyzed. The correlation coefficients between K index, TT index, MDPI index, IQ index, and severe convection weather were better than the other indexes. Then, the 4 indexes were selected for binary logistic regression analysis.
- (2)
Comparing the indexes calculated using the NWP models grid data nearest to the radiosonde station and the indexes calculated using soundings of the station, it was found that the errors of TT index were small between the soundings’ and the two NWP models’, including their initial’s and the forecasting’s in the next 12 hours. The errors of K index between the GRAPES’, including the initial’s and the forecasting’s in the next 12 hours, and the soundings’ were smaller than the EC’s. Meanwhile, the K indexes of the two NWPs were relatively discrete compared to the soundings’, and the errors of the 4 stations were all greater than TT indexes’. The NWP MDPI indexes of the 4 stations were greater than the soundings’ by 1 to 1.5, and their trends of change were consistent with those of the soundings’.
- (3)
Through the spatial distribution analysis, it was found that, in terms of overall forecasting evaluation, both models had their advantages, and the rates of missed forecasting were low; however, the rates of false alarm were high.
- (4)
According to one effect test of initial field and one effect test of forecast field, GRAPES did not generate missed alarm, while it may make false alarm. Compared with the actual precipitation areas, the precipitation areas calculated by the EC model may have a deviation in location, resulting in both false alarm and missed alarm in the model test, which led to test results of a certain event even worse than those of the situation with only false alarm.
- (5)
Binary logic regression is an algorithm of machine learning, and it can improve the accuracy of the model in the future by further applying machine learning to NWP.
- (6)
With the development of NWP, the accuracy of the model will be further improved. And, the accuracy of severe convection weather forecasting will be further improved by applying products of the models.
Conflicts of Interest
The authors declare that they have no conflicts of interest.
Acknowledgments
This paper was supported by the Natural Science Foundation of Guangdong Province of China—Major Basic Research and Cultivation Projects (grant no. 2015A030308014) and the Special Fund for Promoting High-quality Economic Development of Guangdong Province of Ocean Economic Development Project (grant no. GDOE[2019]A11).
Open Research
Data Availability
The data used to support the findings of this study are available from the corresponding author upon request.


