Energy Analysis on Dynamic Fragmentation Degree of Cemented Sand Specimens under Confining Pressure
Abstract
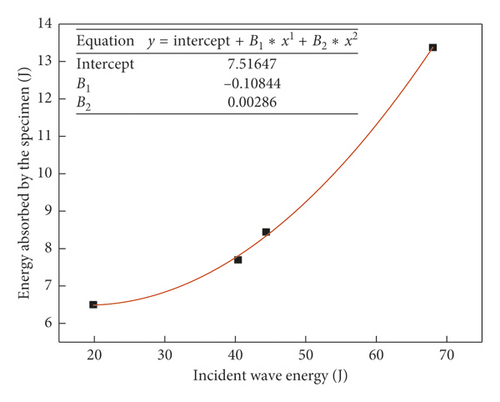
In order to study the fragmentation energy dissipation characteristics of cemented sand specimens under confining pressure and impact loads, the energy consumption of cemented sand specimens was analyzed through an impact compression and split test performed at different loading rates with different impact pressures by using a variable cross section SHPB (split Hopkinson pressure bar) with an active confining pressure loading apparatus. The results show that (1) the absorbed energy and incident energy were in a linear relationship and the proportion between them was relatively constant under confining pressure, and the absorbed energy had a quadratic relationship with the incident energy under zero confining pressure. (2) The fracture energy ratio increased with the increase in incident energy, the damage energy ratio decreased with the increase in incident energy, and the damage energy ratio were always higher than the fracture energy ratio under confining pressure. (3) The energy absorbed by the cemented sand specimens decreased sharply with the increase of confining pressure under the same incident wave energy conditions, and the reflected wave energy and transmitted wave energy increased. (4) When the incident wave energy was constant, the ratio of the energy causing surface fractures to the energy absorbed by the cemented sand specimens decreased sharply with the increase of confining pressure, while the energy causing crack growth and damage increased sharply. These conclusions may guide similar models of blasting tests in the future.
1. Introduction
As underground construction work in China continues to increase in depth, their geological conditions are becoming more and more complicated. Therefore, deep rock mass mechanics has become a major issue relating to state property and public safety, and this has led to focus on rock mass mechanics and underground engineering in China and around the world [1–5].
For the purposes of deep resource exploitation, the creation and growth of cracks in deep surrounding rock caused under dynamic blasting loads are still unclear due to high crustal stress. One of the most effective ways to study and understand the mechanisms and techniques involved in ultra-deep-hole loosening control blasting under column charging in deep high-stress surrounding rocks is to develop testing models to simulate deep rock mass blasting [6–9].
Previous research shows that rocks under external force will undergo stages such as microcrack closure, elastic deformation, microdefect evolution and expansion, and catastrophic failure. During these stages, the rocks are always exchanging energy with the surrounding environment, converting the mechanical energy from the surrounding environment into strain energy and thermal energy and storing them as their own internal energy. At the same time, the strain energy is converted into plastic energy and surface energy, among other forms of energy, and this energy is released in the form of electromagnetic radiation, acoustic emission, and kinetic energy [10–15]. Therefore, “energy” can be considered as a parameter present throughout the process of rock deformation and fragmentation. In addition, the microfragmentation of rocks under load is caused by concentrated small fragment groups, while these small fragment groups evolve in turn from smaller concentrations of cracks. This pattern of self-similarity will inevitably lead to characteristics of self-similarity being present in the degree of fragmentation and energy dissipation patterns [16].
However, in the similar testing models for deep rock mass blasting (part of the National Natural Science Foundation Program of China), a cemented sand substitute was subject to the dynamic load from explosive blasting and a static load generated by active confining pressure to simulate crustal stress. Its deformation and fragmentation process, just like that of rocks, inevitably resulted in energy exchange with the surrounding environment, and the subsequent degree of fragmentation and energy dissipation also featured characteristics of self-similarity.
This paper establishes a relationship between degree of fragmentation and energy based on the analysis on the degree of fragmentation and energy of cemented sand measured under confining pressure and impact load, obtains the fragmentation energy consumption factor of the cemented sand according to the results of the fragmentation, screening, and energy calculation of SHPB test specimens and energy calculation, and analyzes the relationship between the fragmentation and fracture energy of the cemented sand and the confining pressure. These research findings are of great importance to guide similar future test models for deep rock mass blasting.
2. Background of Testing Model
2.1. Engineering Prototype and Stress Loading Apparatus
The prototype of this simulation test of deep rock mass blasting was a model of extrathick hard roof used in deep coal mines. The crustal stress field of the mining area focuses on the area where the roof was located relative to horizontal tectonic stress. The measured horizontal lateral pressure coefficient of the stress was 1.5. The underground elevation was −706.3 to −760.1 m, and the thickness was 35 to 55 m. The extrathick hard roof was the coal roof of the second-level 2101 Mining Area 1 in the well field of Fully Mechanized Mining Face 210108 of Xinji Mine 2. The rock strata above Mining Area 1 for coaling were in order 6.0 m thick siltstone (developed from west to east as sandy mudstone, siltstone, medium-grained quartz sandstone, and medium sandstone), 8.0 m thick medium-to-fine sandstone, and 10.5 m thick fine sandstone, indicating a high degree of stability. The bulk density of the primary rock of the roof was 26 kN/m3 and the average compressive strength was 135 MPa, according to the result of the core.
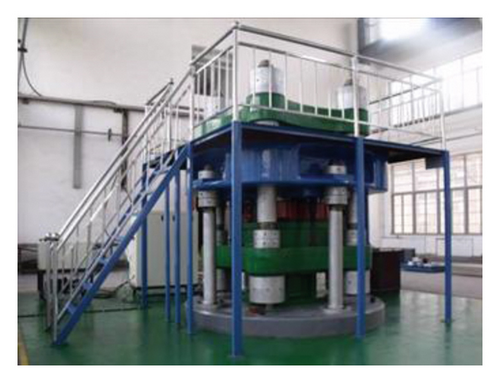
A 3D stress was applied to the model body using a 3D stress loading apparatus [17] (Figure 1) at the National Key Laboratory for Deep Coal Mining and Environmental Protection in order to simulate the high crustal stress of the prototype rock mass. This apparatus can be used to test any model body with dimensions within 1000 mm (length) ∗ 1000 mm (width) ∗ 400 mm (height).
2.2. Proportion of Cemented Sand Substitute Material
According to the study [18], the cemented sand materials exhibit excellent elasticity and plasticity under uniaxial compression: their stress-strain curve is obvious in segments, the postpeak softening section and residual strength are stable, and the failure mode is similar to that of real rock.
Thus, this study used quartz sand as the aggregate, gypsum powder as the regulator (adding gypsum to the simulated cemented sand can greatly change its mechanical properties, such as reducing its strength and hardness [19]), and cement as the cementing agent. Through changing the content of components, a nontoxic and harmless cemented sand substitute material (with a unit density of 18.2 kN/m3) featuring a wide range of mechanical parameters, stable performance, low price, and simple processing needs was prepared and used to simulate the sandstone roof.
In order to promote the application of the model test results in the physical prototype [20], it is necessary to determine the proportional relationship (similarity coefficient) between the prototype and the physical quantities of the model, which is usually expressed by C. Geometric similarity coefficient CL was determined to be 20, considering the sizes of the engineering prototype and loading apparatus. The similarity coefficient (Cr = 1.42) of the bulk density of natural material was obtained according to the bulk densities of the cemented sand substitute (18.2 kN/m3) and the prototype rock mass (26 kN/m3), while the stress similarity coefficient was Cσ = CL × Cr = 28.4.
Under the conditions that the stress similarity coefficient and primary rock strength were 28.4 and 135 MPa, respectively, the measured strength of the model substitute was 4.75 MPa. The strength of the specimen prepared according to a 1 : 0.095 : 0.05 : 0.10 proportion of sand : cement : gypsum : water was able meet the strength requirement for the model’s cemented sand substitute.
Ordinary Portland cement P.O 42.5 was used in this test; the quartz sand comprised of coarse and fine particles with a particle size no more than 1.18 mm. Five standard cylindrical specimens with an approximate size of 50×100 mm were made according to a 1 : 0.095 : 0.05 : 0.1 proportion of sand : cement : gypsum : water. The basic physical parameters of the specimens were measured after 21 days of natural drying conditions at room temperature (20°C) [21], as shown in Table 1.
| Material type | γ(kN × m−3) | E(GPa) | C(MPa) | φ( °) | μ | σc(MPa) | σt(MPa) |
|---|---|---|---|---|---|---|---|
| Primary rock | 26 | 12.97 | 10.00 | 43 | 0.268 | 135 | 21.5 |
| CS substitute | 18.2 | 0.36 | 0.28 | 43 | 0.268 | 4.75 | 0.603 |
- γ: bulk density; E: deformation modulus; C: cohesion; φ: internal friction angle; μ: Poisson’s ratio; σc: compressive strength; σt: tensile strength.
3. SHPB Test Principles and Energy Calculation
3.1. Test Apparatus and Basic Principles
Figure 2 shows the SHPB test apparatus system of the Impact Dynamics Laboratory at Anhui University of Science and Technology. A 37 mm aluminum pressure bar was selected for the impact split test. The impact bar, incident bar, and transmission bar were all made of aluminum alloy, with respective lengths of 600 mm, 2,000 mm, and 2,000 mm. The density, elastic modulus, and longitudinal wave velocity were 2.7 × 10³ kg/m3, 70 GPa, and 5,090 m/s, respectively. A 50 mm variable cross section steel pressure bar was selected from this laboratory for the impact compression test. Its impact bar, incident bar, and transmission bar were all made of the same type of high-strength alloy steel, with the respective lengths of 800 mm, 2,400 mm, and 1,200 mm. The elastic modulus, density, and elastic wave velocity were 210 GPa, 7,800 kg/m3, and 5,190 m/s, respectively. The incident end of the incident bar adopted a right conic variable cross section transition, so the front edge of the incident wave rose slowly, which was quite helpful for constraining the untimely fracture of fragile materials like rocks and improving the stress uniformity of the specimens [22, 23].

The cemented sand substitute featured a low wave impedance, so a semiconductor strain gauge was used to measure weak transmission signals, and a resistance strain gauge was used for the incident bar. A piece of paper [24] was used as a pulse shaper and pasted on the end of the incident bar to improve the loading waveform of the incident pulse and prolong the rising period of the incident pulse.
In addition, Figures 3 and 4 show the active confining pressure loading apparatus used together with the SHPB test apparatus.
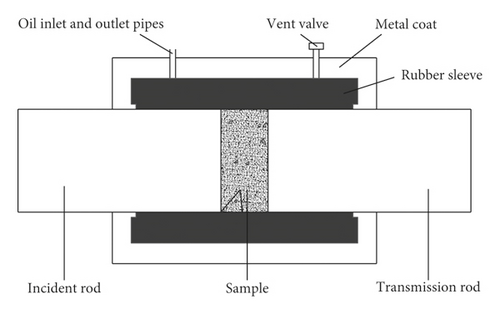
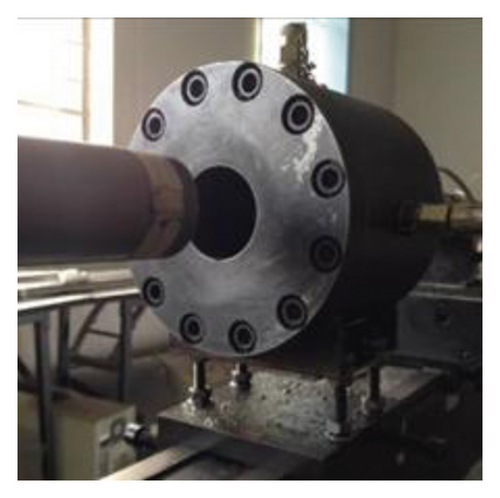
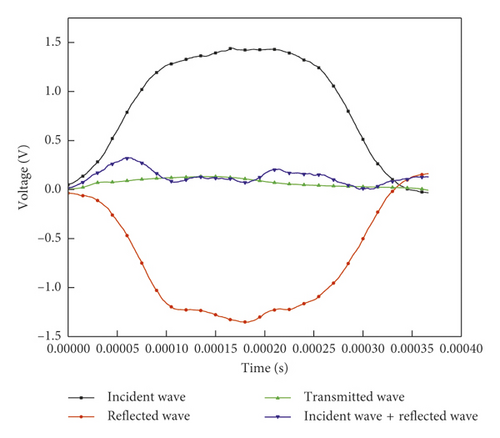
Figure 5 shows the waveforms of the incident wave, reflected wave, and transmitted wave measured during the test. As shown in Figure 5, a section of the reflected wave was basically flat, reflecting the realization of the constant strain rate loading of the material [27].
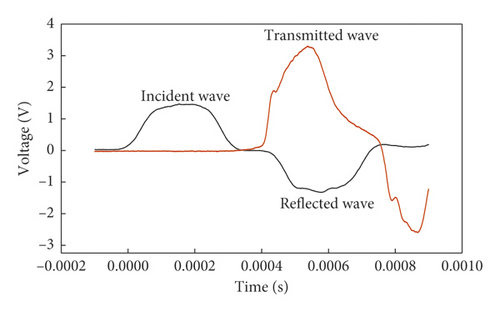
Figure 6 shows the stress balance curve at both ends of the specimen in the test. The stress-time curve of the interface between the incident rod and the specimen (“incident + reflection”) is calculated using both incident signals and the reflection signals, and the stress-time curve (“transmission”) of the interface between the transmission rod and the specimen is calculated using the transmission signal. It can be seen from Figure 6 that the stress balance of the specimen is basically maintained throughout the loading process [28].
3.2. Energy Consumption Calculation of Specimens in Test
3.2.1. Energy WL Absorbed by the Cemented Sand Specimens
The energy WL could also be divided into three parts: (1) fracture damage energy WFD mainly causing surface fractures, crack growth, and microcrack damage; (2) kinetic energy WK resulting in fragmented specimens; and (3) other forms of dissipated energies WO, for example, thermal energy and radiant energy.
3.2.2. Kinetic Energy WK of Cemented Sand Fragment
3.2.3. Fracture Energy WF
The kinetic energy for specimen fragmentation was calculated according to Reference [32], while Reference [32] was based on the SHPB testing of specimens. Therefore, in order to reach the research findings by reasonable and effective means, the kinetic energy of cemented sand fragments and the energy consumption factor C for fragmentation should also be determined based on the SHPB test, and this test was also performed.
As shown in Reference [34], the flat ground load was helpful in improving the concentration of crustal stress at loading positions. When the central angle 2a was equal to 20°, it ensured that the specimens fractured at the center and split along the direction of the load. Specifically, during loading, the microcracks of the specimens mainly grew along the diameter and finally formed surface fractures along the loading diameter. Therefore, it could be approximately considered that the fracture damage energy WFD dissipated completely upon forming the split surface, i.e., WF ≈ WFD.
Therefore based on the screened degree of fragmentation of the dynamic flattened Brazilian disc split strength test and the energy calculation, the fragmentation energy consumption factor of cemented sand could be obtained according to the above equation.
3.2.4. Damage Energy WD
As the microscopic mechanics of the materials are involved, the energy WD for crack growth and microcrack damage was hard to be directly measured or calculated through tests and therefore can only be calculated after the other items above are obtained.
3.3. Fabrication of Cemented Sand Specimens
According to the method [35] recommended by the International Society for Rock Mechanics (ISRM) and the Method for Determining Physical and Mechanical Properties of Coal and Rock [36] (China), specimens of approximately 37 × 19 mm (preferred size) and 50 × 25 mm cylinders were selected to perform dynamic split tests and dynamic compression tests [37–40] in that order to satisfy the stress uniformity requirement of the specimens and mitigate the effect of inertia on the SHPB test.
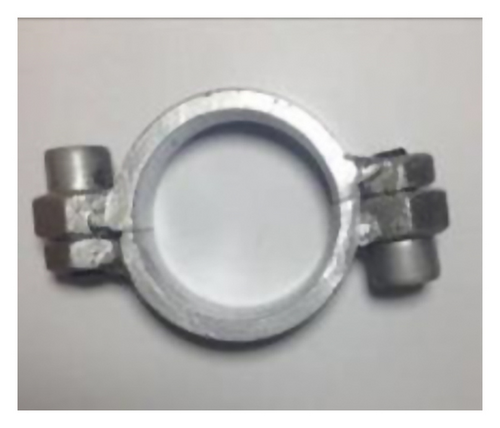
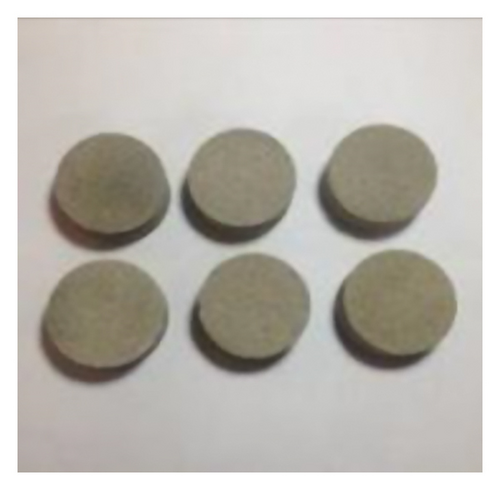
Considering that the cemented sand specimens were liable to be damaged during mold removal, a customized test mold (Figure 7) was used for the fabrication of the cemented sand specimens. In addition, the nonparallel degree of both ends of the specimens was kept within 0.05 mm and the surface roughness was kept within 0.03 mm. See Figure 8 for images of the fabricated specimens.
3.4. Test Design
The test comprised both dynamic tensile test and dynamic compression test. The dynamic tensile test was designed to calculate the fragmentation energy consumption factor of the specimens, while the dynamic compression test was designed to obtain the relationship between confining pressure and fragmentation fracture energy. Different loading rates were applied by adjusting the impact pressure during the test. Three parallel specimens were selected for each group during the test.
According to the model test background, the buried depth and bulk density of the simulated rock mass in the simulation of deep rock mass blasting were H = 750 m and γ = 26 kN/m3, respectively. The horizontal lateral pressure coefficient of the crustal stress was 1.5; and the stress similarity coefficient was Cσ = 28.4. In addition, based on the vertical stress σv = γH, σv was calculated at 19.5 MPa. Based on the average horizontal stress σhav = σv × 1.5, σhav was found to be 29.25 MPa; based on the mean stress σav = (σv + σhav)/2, σav was determined to be 24.375 MPa; and the simulated confining pressure value was σ = σav/Cσ = 0.858 MPa. Therefore, six confining pressure stress values were utilized in this test design, namely, 0 MPa, 0.86 MPa, 1 MPa, 1.15 MPa, 1.3 MPa, and 1.45 MPa. For other design parameters, see Table 2.
| Test category | Impact air pressure (MPa) | Confining pressure (MPa) | Number of test pieces |
|---|---|---|---|
| Dynamic tension | 0.08, 0.1, 0.12, 0.14, 0.16 | 0 | 15 |
| Dynamic compression | 0.15, 0.2, 0.25, 0.3 | 0 | 12 |
| 0.3, 0.5, 0.7, 0.9 | 1 | 12 | |
| 0.9 | 0.86, 1.15, 1.3, 1.45 | 12 | |
4. Test Results and Discussion
4.1. SHPB Test Results
According the sizes of the cemented sand fragments obtained in the SHPB test, standard square hole sandstone screens of various appropriate mesh widths (0.15, 0.3, 0.6, 1.18, 2.36, 4.75, 9.5, 13.2, 16, 26.5, and 31.5 mm) were used. The degree of fragmentation in the specimens were divided into 12 levels based on the size of the fragments: 0–0.15, 0.15–0.3, 0.3–0.6, 0.6–1.18, 1.18–2.36, 2.36–4.75, 4.75–9.5, 9.5–13.2, 13.2–16, 16–26.5, 26.5–31.5, and 31.5–37 mm. An STSJ-4 digital high-frequency vibrating screen was used for screening. The mass of fragment residue in screens of different hole diameters was weighed with a highly sensitive electronic balance. The fragmentation energy consumption factor of cemented sand Ccs was obtained by substituting the screened degree of fragmentation from the dynamic split tensile test of cemented sand into the calculation equation mentioned in Section 2.2. For the relevant dynamic physical split parameters and calculated fragmentation energy consumption factor, see Table 3.
| Number | p(MPa) | v(m · s−1) | σt(MPa) | WL (J) | WK (J) | WFD (J) | Ccs | AVG | |
|---|---|---|---|---|---|---|---|---|---|
| DL-2-1 | 0.08 | 2.45 | 13.2 | 0.93 | 12.07 | 0.2306 | 11.84 | 28.95 | 18.56 |
| DL-2-5 | 0.1 | 2.78 | 18.0 | 0.97 | 12.75 | 0.2729 | 12.48 | 20.49 | |
| DL-2-7 | 0.12 | 3.03 | 21.0 | 1.18 | 13.31 | 0.3077 | 13.00 | 14.83 | |
| DL-2-10 | 0.14 | 3.27 | 23.8 | 1.29 | 13.98 | 0.3467 | 13.63 | 15.29 | |
| DL-2-15 | 0.16 | 3.45 | 29.2 | 1.52 | 14.57 | 0.3785 | 14.19 | 13.26 |
- p: impact air pressure; v: impact velocity; : average strain rate; σt: dynamic tensile strength; WL: energy absorbed by the specimen; WK: kinetic energy of fragments; WFD: fracture damage energy; Ccs: fragmentation energy consumption factor; AVG: mean value of fragmentation energy consumption factor.
The cemented sand fragments were collected after the SHPB dynamic compression test and the specimens’ degree of fragmentation was divided into 13 levels based on size: 0–0.15, 0.15–0.3, 0.3–0.6, 0.6–1.18, 1.18–2.36, 2.36–4.75, 4.75–9.5, 9.5–13.2, 13.2–16, 16–26.5, 26.5–31.5, 31.5–37.5, and 37.5–50 mm. Fracture energy WF causing fragmentation of cemented sand resulting in surface fractures was calculated according to the results of the screened fragment test obtained after the cemented sand was subject to impact compression. For the calculated dynamic compressional physical parameters and fracture damage energy, see Table 4. The incident energy under the same impact pressure loading condition basically remained unchanged, and the maximum difference from the average value was only around 2.7%.
| Number | p(MPa) | Cp(MPa) | v(m · s−1) | σc(MPa) | WI (J) | WL (J) | WK (J) | WF (J) | WD (J) | |
|---|---|---|---|---|---|---|---|---|---|---|
| DY-2-2 | 0.15 | 0 | 3.11 | 89.6 | 8.6 | 19.87 | 6.501 | 0.1540 | 1.752 | 4.595 |
| DY-2-6 | 0.2 | 0 | 3.72 | 115.2 | 9.5 | 40.41 | 7.699 | 0.2144 | 3.554 | 3.931 |
| DY-2-9 | 0.25 | 0 | 4.22 | 118.7 | 11.0 | 44.38 | 8.442 | 0.2651 | 5.024 | 3.154 |
| DY-2-12 | 0.3 | 0 | 4.80 | 143.5 | 13.5 | 68.04 | 13.373 | 0.4723 | 10.39 | 2.510 |
| ZY-2-15 | 0.3 | 1 | 4.88 | 146.6 | 12.9 | 60.96 | 8.656 | 0 | 0.5523 | 8.103 |
| ZY-2-18 | 0.5 | 1 | 6.65 | 189.2 | 22.3 | 109.5 | 19.45 | 0 | 1.744 | 17.67 |
| ZY-2-21 | 0.7 | 1 | 8.16 | 218.3 | 26.0 | 148.1 | 24.71 | 0 | 5.024 | 19.68 |
| ZY-2-23 | 0.9 | 1 | 9.31 | 257.2 | 31.8 | 194.1 | 35.25 | 0 | 10.55 | 24.70 |
| ZY-2-3 | 0.9 | 0.86 | 9.29 | 255.2 | 30.8 | 194.0 | 37.00 | 0 | 13.06 | 23.93 |
| ZY-2-4 | 0.9 | 1.15 | 9.28 | 259.9 | 33.0 | 193.8 | 33.36 | 0 | 3.403 | 29.95 |
| ZY-2-8 | 0.9 | 1.3 | 9.30 | 263.5 | 34.7 | 186.8 | 27.75 | 0 | 2.711 | 25.04 |
| ZY-2-12 | 0.9 | 1.45 | 9.32 | 264.4 | 35.6 | 191.7 | 25.14 | 0 | 1.979 | 23.16 |
- p: impact air pressure; Cp: confining pressure values; v: impact velocity; : average strain rate; σc: dynamic compressive strength; WI: incident wave energy; WL: energy absorbed by the specimen; WK: kinetic energy of fragments; WF: fracture energy; WD: damage energy.
4.2. Relationship between Incident Wave Energy WI/Confining Pressure Cp and Energy WL Absorbed by Cemented Sand Specimens
4.2.1. Relationship between Incident Wave Energy WI and Energy Absorbed by Cemented Sand Specimens
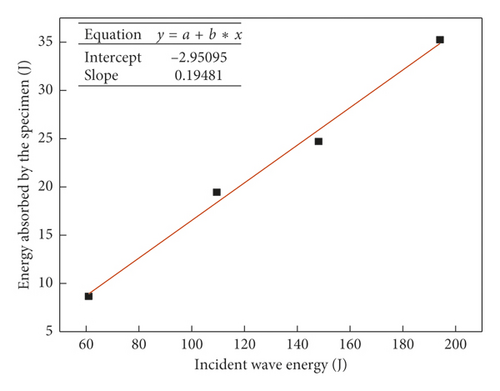
4.2.2. Relationship between Confining Pressure and Energy Absorbed by Specimens
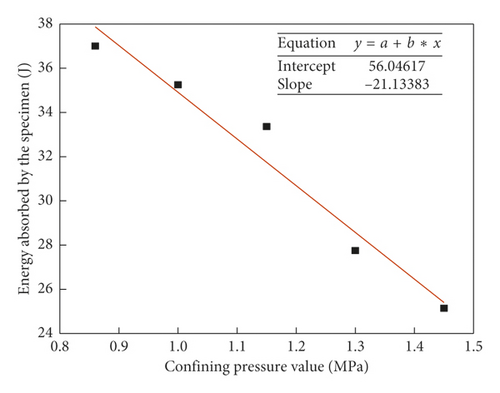
In summary, the energy absorbed by the cemented sand specimens decreased sharply with the increase in the confining pressure when incident wave energy is given, specifically as reflected wave energy and transmitted wave energy increased. It can be indicated that the propagation of the impact wave was influenced greatly under high crustal stress. Under the same impact load, the higher the crustal stress was, the less the energy was dissipated per unit volume of surrounding rock, and the slower the attenuation of the impact wave was. Therefore, under high levels of crustal stress, the strength of the stress wave in the surrounding rock of deep underground constructions was far higher than that calculated according to the frequently used equation of impact wave attenuation. In specific terms, a “stress wave amplification effect” could appear under a high crustal stress levels, and these underground constructions would be subject to more severe changes in dynamic load.
4.3. Relationship between Incident Wave Energy WI/Confining Pressure Cp and Fragmentation Fracture Energy WFD of Cemented Sand
4.3.1. Fragmentation Fracture Energy WFD of Cemented Sand and Incident Wave Energy WI
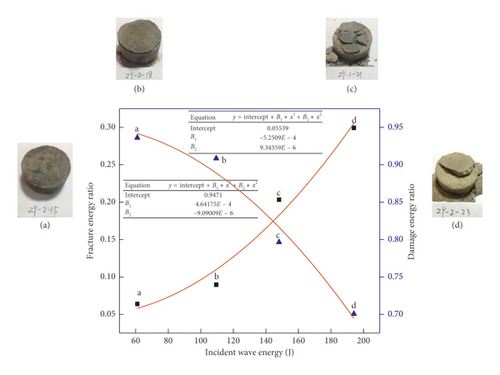
In order to make these research findings comparable with others, the fragmentation fracture energy rate was defined as the ratio of the specimens’ fragmentation fracture energy to their absorbed energy (η = WFD/WL), where the fragmentation fracture energy ratio η comprised the fracture energy ratio η1(WF/WL) and the damage energy ratio η2(WD/WL).
Figure 12 shows the relationship between the fracture energy ratio η1/damage energy ratio η2 and incident wave energy WI when Cp = 0 MPa.
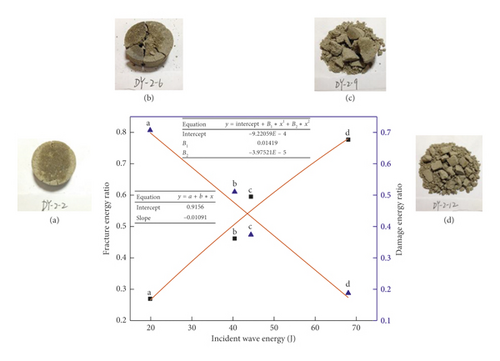
As shown in Figure 12, with the increase of the incident wave energy, the fracture energy ratio from the total energy absorbed by the specimens gradually increased, while the damage energy ratio gradually decreased. According to Figure 12 showing fragmentation deformation, when the incident wave energy was low, no macroscopic fragmentation of the specimens occurred, and at this time, the damage energy ratio was high, indicating that the specimens were mainly subject to damage deformation. Meanwhile, when the incident wave energy was high, the specimens were subject to macroscopic fragmentation, and at this time, the fracture energy ratio was high, indicating that the specimens were mainly subject to macroscopic fragmentation rather than microscopic damage. According to this analysis, the cemented sand specimens under no confining pressure were characterized by deformation and fragmentation that proceeded from microscopic damage to macroscopic fracture with an increase in incident wave energy.
Figure 13 shows the relationship between the fracture energy ratio η1/damage energy ratio η2 and incident wave energy WI when Cp = 1 MPa.
4.3.2. Fragmentation Fracture Energy WFD of Cemented Sand and Confining Pressure Cp
Figure 14 shows the relationship between confining pressure Cp and fragmentation fracture energy ratio η when the incident wave energy WI did not change or was only changed slightly.
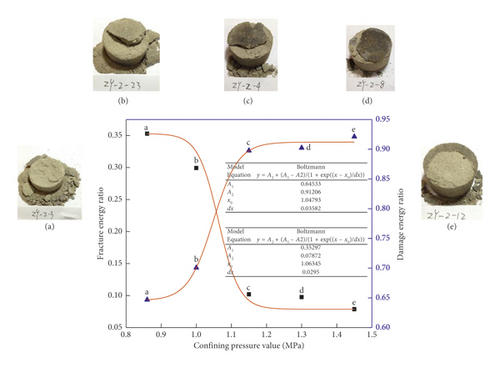
As shown in Figure 14, with the increase of the confining pressure, the ratio of fracture energy to the total energy absorbed by the specimens gradually decreased, while the damage energy ratio increased quickly, and the damage energy ratio was always higher than the fracture energy ratio. According to Figure 14 depicting the specimens’ state of fragmentation, when the confining pressure was low, the specimens were subject to macroscopic fragmentation, and at this time, the fracture energy ratio was slightly lower than the damage energy ratio, indicating that the fragmentation of the specimens was mainly subject to macroscopic fracturing and microscopic damage under low confining pressure due to relatively concentrated main cracks. However, when the confining pressure was high, the specimen tended to remain externally whole, and at this time, the damage energy ratio was far higher than the fracture energy ratio, indicating that the interior of the cemented sand tended to form a homogenized surface damage with widely distributed cracks under the high confining pressure. The above analysis shows that the cemented sand specimens under incident wave energy were characterized by deformation and fragmentation ranging from microscopic fracture fragmentation to macroscopic damage as their confining pressure increased.
In summary, when the incident wave energy was given, the ratio of the energy absorbed by the cemented sand specimens resulting in surface fractures decreased sharply with the increase in confining pressure, while the energy causing crack growth and crack damage increased sharply. It can be concluded that the dynamic fragmentation of the rock was greatly influenced under high crustal stress. Under the same impact wave load, the higher the crustal stress was, the lower the macroscopic degree of fragmentation in the surrounding rock, and the more the microscopic damage and cracks were found. Therefore, when the surrounding rock of deep underground constructions are blasted under high crustal stress, the fragmentation/crack/damage zones for blasting undergo significant and obvious change, and the results can be calculated according to the radius calculation equation for the fragmentation/crack zones that were far lower than those obtained according to the frequently used radius calculation equation, and the radius of the damage zone increased somewhat. This is critical when deep surrounding rock is excavated via blasting, and the accurate calculation of the range of the damage zone is one of the premises for ensuring the stability of the surrounding rock for underground construction.
5. Conclusions
- (1)
In the tested specimens, the absorbed energy and incident energy were in a linear relationship and the ratio between them remained relatively constant under confining pressure. The absorbed energy has a quadratic relationship with the incident energy under zero confining pressure.
- (2)
Under confining pressure/no confining pressure, the fracture energy ratio increases with the increase of incident energy, and the damage energy ratio decreases with the increase of incident energy. However, the damage energy ratio is always higher than the fracture energy ratio under confining pressure.
- (3)
Under the same level of incident wave energy, the higher the confining pressure is, the less the energy absorbed by the cemented sand specimen is, and the greater the reflected wave energy and transmitted wave energy become. Under the same impact wave load, the higher the crustal stress is, the less the energy dissipated per unit volume of the surrounding rock is, and the slower the attenuation of the impact wave is.
- (4)
Under the same level of incident wave energy, with the increase of the confining pressure, the fracture energy ratio decreases, while the damage energy ratio increases. Under the same impact wave load, the higher the crustal stress is, the lower the macroscopic fracture degree of fragmentation of surrounding rock is, and the more microscopic damage cracks will be present.
The above conclusions were only performed on the basis of the SHPB dynamic test of the cemented sand specimens included in this paper, and therefore in terms of research scale, scope, and data, it is still hard to make quantitative calculations of fragmentation/cracks/damage zones under crustal stress. Therefore, for simulation tests of deep rock mass blasting, a CT rock scanner should be used to perform the accurate measurement of the damage/crack zones of models after blasting, and a quantitative study should be performed on the relationship between crustal stress and fragmentations/cracks/damage zones.
Conflicts of Interest
The authors declare that there are no conflicts of interest regarding the publication of this paper.
Acknowledgments
We extend our gratitude to the National Natural Science Foundation, China (51374012), and Anhui Province Science and Technology Project, China (1501041123).
Open Research
Data Availability
The data used to support the findings of this study are available from the corresponding author upon request.


