Intelligent Time-Domain Parameters Matching for Shock Response Spectrum and Its Experimental Validation in Active Vibration Control Systems
Abstract
Shock response spectrum (SRS) test is a kind of vibration test that uses the principle of equivalent damage to simulate complex shock and vibration environment for evaluating product fragility. However, for a certain SRS, neither an analytical nor a unique inverse time-domain shock waveform (TSW) exists, making the SRS test a very challenging problem. Synthesis of a TSW using a group of wavelets with different frequencies, amplitudes, and phases is considered to be a very promising method. However, it is challenging to find an optimal group of wavelets since there are hundreds of optimization variables and objective functions. In this paper, a novel intelligent parameter matching method for TSW synthesis is proposed for the SRS test. A variable-weight method has been introduced to combine the effects of hundreds objective functions so that the optimization problem can be solved by using the genetic algorithm. The frequency response function of the shaking system has been taken into consideration in the calculation of the objective function, so the synthesized TSW can be applied directly to the SRS test. In the optimization process, normalized control factors have been formulated for the optimization variables so that they can be tuned in a reasonable small range to avoid irrationality and accelerating convergence in searching process. The effectiveness of the proposed method has been verified experimentally in two active vibration control systems, in which one contains a 500 N minishaker and the other contains a 1-ton shaking table. It can be seen from the experimental results that the proposed method can accurately synthesize the input TSW for the shaking system, where the output TSW and SRS can accurately meet the time- and frequency-domain specification.
1. Introduction
Shock load is a kind of load generally all kinds of products will undergo in the process of manufacture, transportation, and use. Shock often causes natural frequency response or damage to equipment, which greatly reduces product reliability. The shock test is performed to determine the environmental adaptability, structural reliability, and shock resistance of the product under polytypic mechanical shock load. The control strategy for the shock test can be divided into classic waveform control and shock response spectrum (SRS) control. The former one mainly uses drop hammer or pendulum shock machine [1] to produce simple shock waveforms, such as half-sine wave, rectangular wave, trapezoidal wave, and sawtooth wave [2, 3]. It pays much attention to the time-domain shock waveform (TSW) itself, which is not able to effectively simulate the real environmental shock [4]. Moreover, this method has larger low-frequency energy, which is easier to damage the experimental equipment. The SRS control focuses on the effect of the shock to the device under test (DUT) and adopts the principle of equivalent damage to generate complex TSWs, which can truly and effectively simulate the real environmental shock.
SRS is widely applied for evaluating the product fragility and the vibration environment for the protective packaging system [5], electronic equipment [3, 6], weapons [7], spacecraft and launch vehicle [4], high-speed craft, bridges, etc. For example, Gannon [8] developed a repeatable laboratorial method using SRS for testing shock mitigating seats on high-speed watercraft. George et al. [9] developed an SRS test system of a launch vehicle using LabVIEW. Wang et al. [10] conducted pyroshock response analysis of separation nuts in the aerospace launch system based on the finite element (FE) model and SRS. Haciefendioglu et al. [11] conducted the dynamic assessment of partially damaged historic masonry bridges under blast-induced ground motion using the multipoint SRS method and FE model. Stewart et al. [12] analyzed the response of the hydraulic blast simulator used for generating high-g shock based on the SRS method. Botta et al. [13] investigated the SRS in plates under impulse loads, considering the Mindlin–Reissner model. Li et al. [14] studied the damage boundary of a beam under shock based on the structural dynamics and the SRS analysis.
SRS can also be applied for vibration/noise suppression and even be used for fault diagnosis. For example, Okuyama et al. [15] investigated a design method based on SRS analysis for reducing acoustic noise of a seeking control system in a hard disk driver. Atsumi [16] evaluated the settling vibration and acoustic noise caused by the acceleration feedforward input of the hard disk driver using SRS analysis. Shin et al. [17] investigated two simple methods to suppress the residual vibrations of a translating or rotating flexible cantilever beam, where both methods are based on the SRS of the system. Hussain et al. [18, 19] proposed a gearbox fault detection method using the real coded genetic algorithm (GA), adaptive wavelet filtering, and novel SRS feature extraction.
With the development of computer, digital signal processing, and active vibration control technology [20–29], the SRS test with electrodynamic shaker has become the mainstream. Compared with the traditional shock test equipment, the electrodynamic shaker has the advantages of a simple setup, better controllability and repeatability, convenient adjustment, and high accuracy, which helps in easy realization of the control of SRS [4]. In the SRS test, accurate generation of the TSW is the key problem, where there is lot of research devoted to it. For example, Monti et al. [30] investigated a GA-based dynamic load synthesis method for SRS and verified the FE model of space equipment. James et al. [31] proposed a stochastic SRS decomposition method based on probabilistic definitions of temporal peak acceleration, spectral energy, and phase lag distributions of mechanical impact pyrotechnic shock test data. Brake [32] investigated the inverse of SRS by using the Morlet wavelet as the basis function and using GA to find the optimal parameters. Soize [33] solved the inverse problem of SRS from the perspective of maximum entropy principle, in which a random generator of accelerograms was developed. Wattiaux et al. [34] investigated the prediction of the vibration levels generated by pyrotechnic shocks using an approach based on SRS specification and equivalent mechanical shock.
It can be seen from the literature review that the time-domain parameters matching, i.e., finding the inverse of SRS, is the critical and difficult problem since a specific SRS specification may not have unique inverse TSW. Moreover, the dynamic of the shaking system may greatly affect the control of SRS. Synthesis of a TSW using a group of wavelets with different frequencies, amplitudes, and phases is considered to be the very promising method. However, it is challenging to find an optimal group of wavelets since there are hundreds of optimization variables and objective functions. In this paper, the intelligent parameters matching method of TSW considering the SRS specification and frequency response function (FRF) of the shaking system is proposed. The multiple objective problem, considering the restriction of shock duration, shaking forces, and SRS specification, is simplified through a variable-weight method so that the optimization problem can be solved based on GA. The TSW matching corresponding to the SRS specification is successfully obtained and has been experimentally validated in an active vibration control (AVC) system under different working conditions. This paper is structured as follows: Section 2 introduces the principle of SRS and SRS specification. Section 3 presents the parameters matching process of TSW with regard to SRS. Section 4 presents the parameters optimization using the proposed objective function and GA. Section 5 conducts the experimental validation of SRS in an AVC system with minishaker. Section 6 conducts the experimental validation of SRS in an AVC system with 1-ton shaking table. Section 6 briefly concludes the whole paper.
2. Principle of SRS
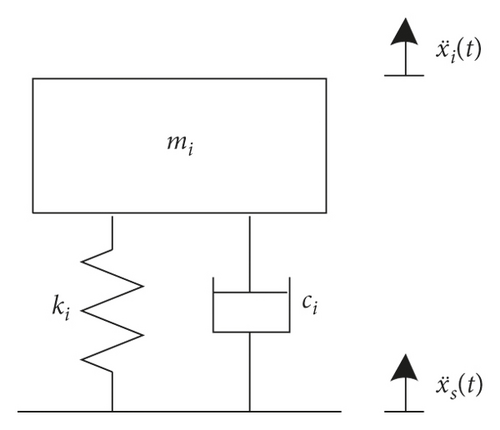
Shock response spectrum (SRS) is a graphical representation of a shock, or any other transient acceleration input, in terms of how a single-degree-of-freedom (SDOF) system (like a mass on a spring) would respond to that input. In real application, a continuous system can be approximately represented as a series of the discrete linear SDOF system [35]. Applying the same shock excitation to these SDOF systems, the relationship between the peak responses and the nature frequency of these SDOF systems is SRS, as shown in Figure 1. The horizontal axis in Figure 1 shows the natural frequency of the hypothetical SDOF systems, and the vertical axis shows the peak acceleration of these SDOF systems with same shock input. In Figure 1, there are M SDOF systems fixed on the same foundation, where mi, ki, ci, and fi are the mass, stiffness, damping, and natural frequency of the ith (i = 1, 2, …, M) SDOF system, is the foundation acceleration excitation, is the acceleration response of the ith SDOF system, and Ai is the maximum amplitude of the acceleration response of the ith SDOF system. The natural frequency fi and maximum amplitude Ai will determine one point in SRS. Connecting all the M points forms the integrated SRS.
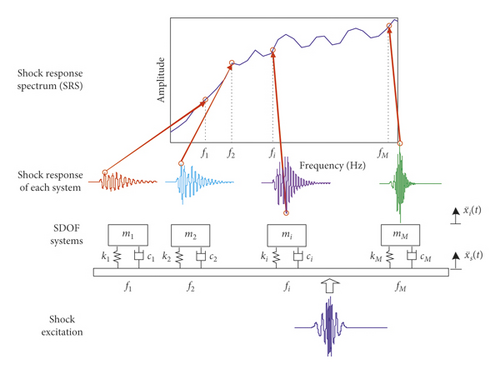
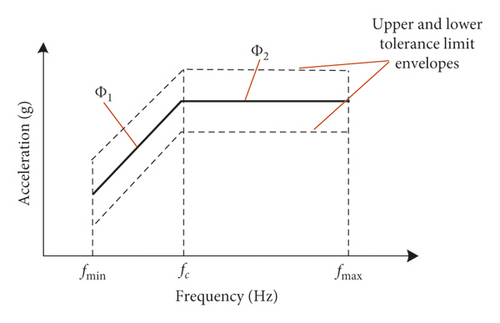
It can be seen that SRS is not simply a spectrum of shock response of the continuous system. It describes maximum responses of each frequency component of the system. Thus, it is able to reflect the harmful effect that shock brings about to the system and offers a criterion to the damage of the shock test. SRS specification is the standard to judge whether the product has passed certain strength examination in the shock test [30]. Figure 2 shows a typical SRS specification. It includes a standard curve and its upper and lower tolerance limit envelope, which is composed of low-frequency rising section and high-frequency horizontal section. In Figure 2, fmax and fmin are the maximum and minimum values of analysis frequency, fc is the frequency of inflection point, and Φ1 and Φ2 are the slope of the curve.
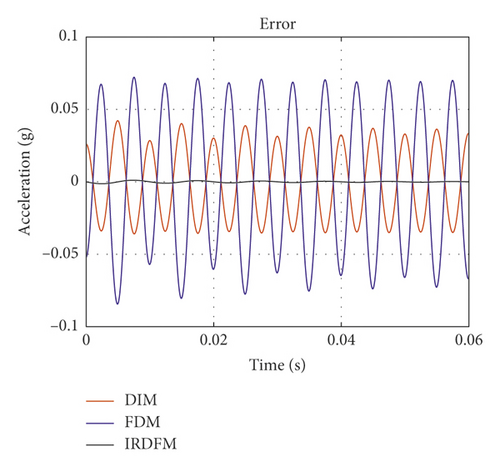
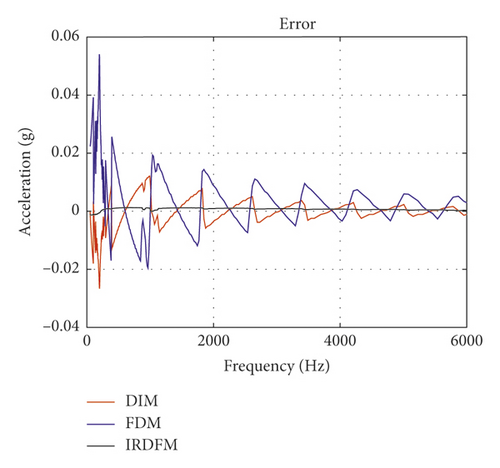
It can be seen that the error of the IRDFM is obviously smaller than that of the other two methods, and the error of the FDM is the largest. At the same time, the time consumption of the three numerical methods are compared, where the code is running on the PC with Intel Core i7-4790 CUP @ 3.60 GHz and 16G RAM, number of analysis frequency is 288, sampling frequency is 48000 Hz, and sampling number is 7680. The result shows that DIM cost 1.346 s, FDM cost 0.121 s, and IRDFM cost 0.098 s. In summary, the IRDFM is superior in both accuracy and efficiency.
3. Parameters Matching of TSW
In the SRS test, the first step is to determine test specification and then solve an inverse of SRS, i.e., TSW, to driving the electrodynamic shaker and making the SRS of DUT matching the predefined test specification. The SRS corresponding to a certain TSW is unique, while the TSW corresponding to a certain SRS is not unique. In order to achieve the test goal, an applicable TSW needs to be constructed according to a determined SRS specification, which is known as time-domain parameters matching. Three principles should be followed in the time-domain parameters matching. They are (1) the duration of the TSW should be short and not exceed the prescribed limit; (2) The maximum acceleration of the TSW should be small and not exceed the limit of the shaker; (3) The SRS corresponding to the TSW should conform to the test specification and not exceed the prescribed tolerant limit envelope.
3.1. Wavelet Frequency fi
3.2. Number of Half Sinusoids Ni and Duration of Wavelet Ti
In addition, in order to satisfy the symmetry of wavelet, Ni is required to take an odd number which is greater than or equal to 3. After the value of Ni is determined, the value of Ti can be determined according to equation (8).
3.3. Wavelet Delay τi
3.4. Wavelet Amplitude Ai
It can be seen that the synthesized TSW is affected by five parameters. However, because the analysis frequency fi is determined according to the SRS specification, and there is a clear relationship between the duration of the wavelet Ti and the number of half-sinusoidal waves Ni, there are mainly three independent variable parameters, i.e., Ai, Ni, and τi, that affect the shock waveform. After these parameters are determined, a TSW can be synthesized. However, the SRS corresponding to this waveform often does not conform to the three principles above. Generally, there are two main problems: one is that the calculated value of the SRS does not meet the requirements of the SRS specification; the other one is that the maximum value of the TSW exceeds the limit of the shaker. It can be seen from the analysis that the maximum value of the TSW and the corresponding SRS are affected by the parameters of Ai, Ni, and τi at the same time. Modifying a certain parameter will affect both targets simultaneously, so it is difficult to match proper parameters of TSW corresponding to a certain SRS specification.
4. Parameters Optimization Based on GA
The genetic algorithm (GA) is applied in this paper for parameters optimization of TSW. This algorithm is a kind of the random search optimization algorithm that simulates the evolution rule in nature. It can be seen from the above analysis of wavelet synthesis that there is a great degree of subjectivity and randomness in parameter determination and it is difficult to find the appropriate parameters artificially. If the advantages of automatic searching by using GA are combined with wavelet synthesis, the shortcomings in parameter selection can be overcome. As presented before, the optimization problem is a multiple objective problem, where there are two main restrictions. One is that the maximum value of TSW is restricted by the limit of the shaker. Actually, we want the amplitude of TSW as small as possible, to reduce the energy consumption. The other restriction is that the SRS of the shock waveform must agree with the test specification. Although we defined the tolerant limit to the SRS specification, we still want the error as smaller as possible. That is to say, the error between actual SRS and the specification at every analysis frequency should meet the requirement. So the purpose of GA is to obtain a suboptimal solution of time-domain parameters by considering the above restrictions. The optimization process of this problem using GA is as follows.
4.1. Chromosome Coding (Variable Regularization)
The chromosome is a (1 × 3M)-dimensional vector containing the normalized control factors (gene) of all variables at all analysis frequencies; M is the number of analysis frequencies. In the optimization process, the chromosome is also called individuals.
4.2. Optimization Objective
4.3. Fitness Function
This weight coefficient can guarantee that the fitness function is small only when all objective functions are small.
In order to verify the performance of the above exponential weighted fitness function, the following three weighted fitness functions are compared: f(s0, s1) = ∑i=0,1exp(si) · si (exponential weight), (square weight), and f(s0, s1) = ∑i=0,1si (linear weight). In order to quantitatively compare the differences among the three fitness functions, the contour lines of the two target values of the three at the fitness function of 0.5, 1, 2, and 3 are also illustrated. The comparison results are shown in Figure 5.
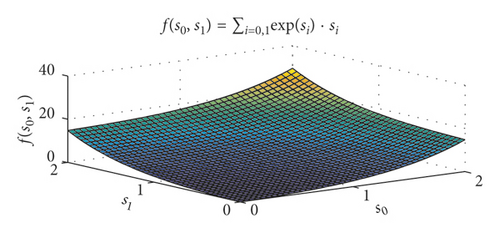
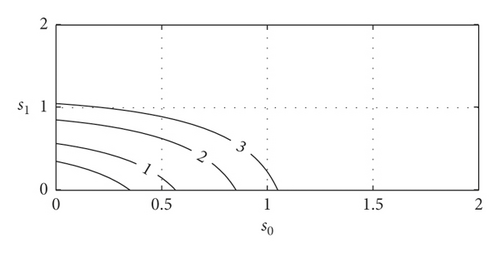
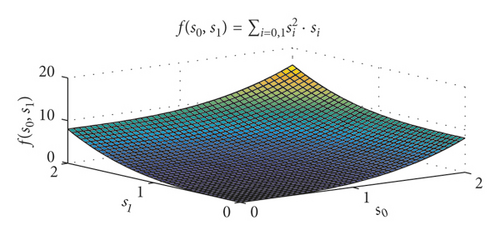
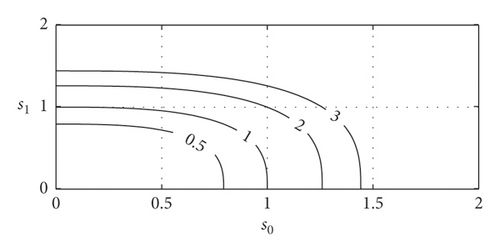
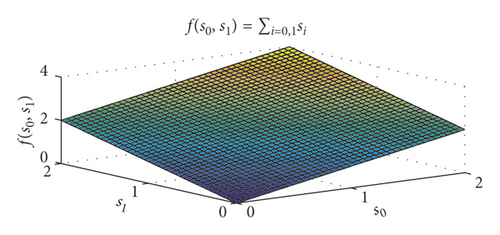
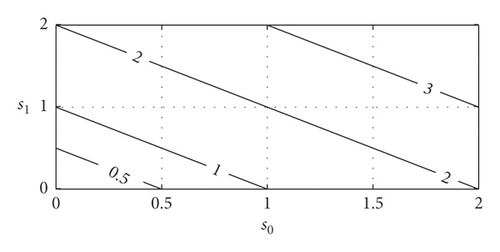
It can be seen from Figure 5 that the value of the exponential weighted fitness function is much greater than that of the other two fitness functions, which amplifies the deviation of each objective function. It can be predicted that the exponential weighted fitness function is more effective than the other two when the deviation of the arbitrary objective function is larger. It can be seen from the contour map that, when the fitness function value is 2, the maximum deviation of the single target in the exponential weight is about 0.8, the maximum deviation of the single target in the square weight is about 1.2, and the maximum deviation of the single target in the linear weight is 2. Therefore, when the fitness function has the same value, the exponential weighted fitness function can guarantee that all objective functions are near their minimum value.
4.4. Genetic Evolution Process (Optimization Process)
4.4.1. Generate the Initial Population
4.4.2. Selection
In GA, selection is the process of preserving the dominant individuals (chromosomes) and eliminating the inferior individuals. In this paper, controlling population and roulette strategy are adopted for selection. In this process, first calculate the fitness of each chromosome, and then pick up the part of the advantage individuals as control population, which do not take part in crossing and variation. The rest of the individuals will be involved in crossing and variation normally. Finally, compare the results of the two parts and eliminate disadvantage individuals by “roulette wheel” way, getting new species for the next generation of evolution. By controlling the population, the dominant individuals in the population can be protected from dying out due to crossing and variation, and the convergence speed of the algorithm can be improved.
4.4.3. Crossing and Variation
Multipoint variation is to randomly select m variation locations on a stochastic chromosome and reproduces random numbers to replace them. The fitness of the two individuals before and after the variation is also compared to choose the better one to the next generation.
4.4.4. Simulation and Optimization Result
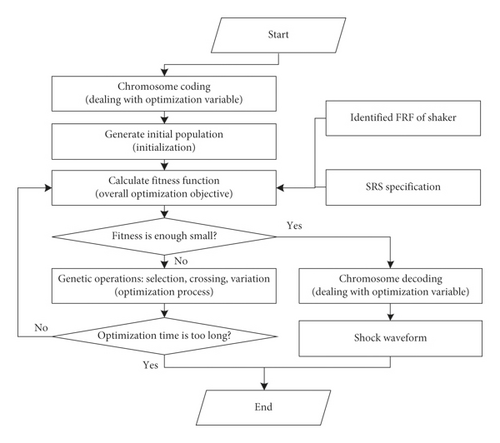
The optimization process of TSW using GA is shown in Figure 6. Step 1 is coding the chromosome, i.e., regulate the optimization variable (also called gene) so that they are suitable for the optimization process of GA. Step 2 is to generate initial population, i.e., generate an adequate numbers of the chromosome (also called individuals). Step 3 is calculating the fitness function, considering the identified FRF and the SRS specification. Step 4 is to judge whether the fitness function of the optimal individual is smaller enough to meet the stopping condition. If YES, decode the chromosome to calculate the TSW. IF NO, continue the evolution process. Step 5 is the genetic operations, i.e., selection, crossing, and variation; Step 6 is to judge whether the optimization process is too long. If NO, continue the evolution process. If YES, break the evolution process.
In order to verify the effect of parameters matching of TSW using GA, a simulation was conducted. During the simulation, the main parameters of the GA are set as follows. Population size (i.e., the number of the chromosome in one generation) is 500. Control population size (i.e., the number of the dominating chromosome to be revered) is 20. Initial crossing probability is 0.7. Initial variation probability is 0.2. The maximum number of generation is 100. The trend of the fitness function is shown in Figure 7(a), and the synthesized TSW is shown in Figure 7(b).
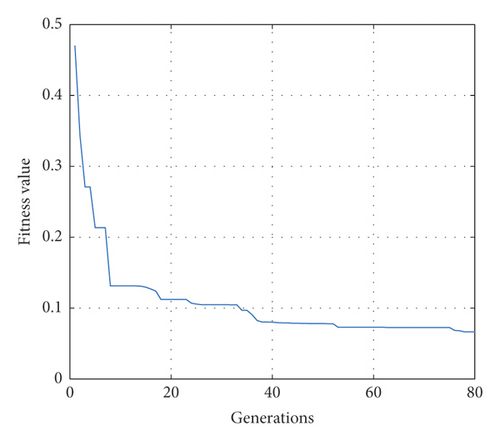
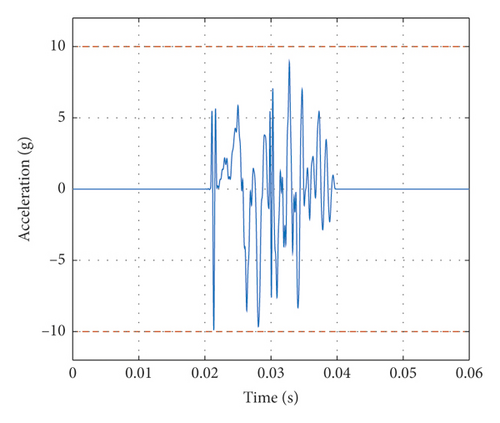
It can be seen from Figure 7(a) that the GA converges very fast in the process of evolution and meets the requirement at about 80th generation. It can be seen from Figure 7(b) that the time-domain parameters matching using GA can meet the time-domain requirement, i.e., the duration and the maximum value of TSW do not exceed the predefined limit. Although we have considered the dynamic of the shaking system in the optimization process, due to the environmental disturbance, the frequency-domain requirement, i.e., the requirement to match the SRS specification, should be validated in AVC system experimentally.
5. Experimental Validation Using Minishaker
5.1. AVC System for SRS Validation
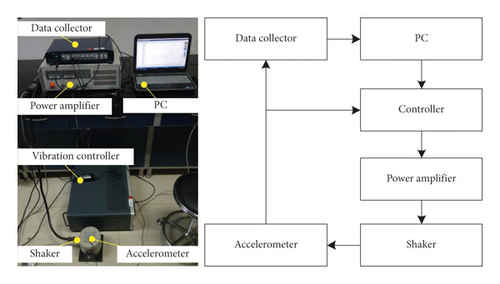
The hardware platform for SRS validation is an active vibration control (AVC) system, which consists of an accelerometer (PCB-333B32, 100 mV/g, ±50 g, 0.5∼3000 Hz, IEPE), electrodynamic shaker (JZK-5, 50 N, ±7.5 mm, 0∼5000 Hz), power amplifier (YE5872 A, 192VA, 0∼50000 Hz), vibration controller (PREMAX MI-8014, 24 bit ADC, 110 dB, 0∼18750 Hz), data collector (AVANT MI-7008, ±10, 24 bit ADC, 110 dB, 0∼204800 Hz), PC, etc. The block diagram and photo of the hardware platform are shown in Figure 8.
5.2. Procedures of SRS Test
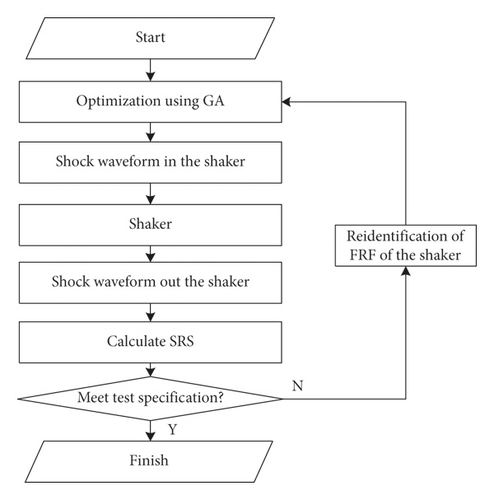
In the SRS test, the FRF between the input and output of the shaking system must be made clear to ensure that the waveform actually output to the DUT meets the test specifications. In application, it is difficult to model the shaking system in theory, and thus an identified model is applied. The optimization algorithm will optimize offline a group of parameters according to the SRS specification and identified FRF, then the TSW is synthesized to drive the shaker, an output TSW is measured from the shaker table, and then the measured TSW is transformed into SRS to see if it is in agreement with the SRS specification. If YES, the test is finished. If NO, identify the FRF again and optimize another group of parameters, as shown in Figure 9.
5.3. Case Study
According to the characteristics of the shaker, the target SRS specification for the test is defined as fmin = 100 Hz, fc = 500 Hz, fmax = 3000 Hz, Φ1 = 6 dB/Oct, and Φ1 = 25 g (250 m/s2). The upper and lower tolerance envelop is with ±3 dB deviation of the specification line, the maximum TSW duration Tmax = 20 ms, frequency interval is 1/6 dB/Oct, damping ratio ζ = 0.05, and maximum acceleration of the shaker gmax = 10 g(100 m/s2). Before the test, the TSW conforming to the SRS test specification was simulated and calculated considering the FRF of the shaker based on GA. Three cases are investigated, which are no load, light load, and heavy load.
In Case A, there is no DUT, but an accelerometer is placed on the table, as shown in Figure 10(a). The mass of movable parts of the shaker is 0.254 kg, including the weight of the accelerometer 0.004 kg. The output force under the acceleration of 10 g (100 m/s2) is 21.5 N. The measured FRF is shown in Figure 10(b), and it can be seen that there is a first-order natural frequency about 46 Hz. The actual output TSW and its SRS of the shaking table are shown in Figures 10(c) and 10(d). It can be seen that the TSW meets the requirement of duration and maximum values. The SRS meets the requirement of test specification, i.e., the error at every analysis frequency is within the tolerance envelope.
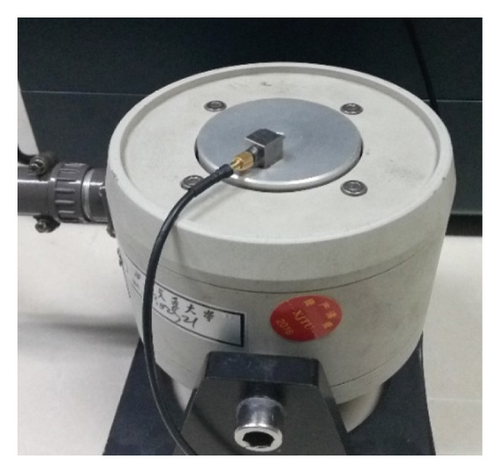
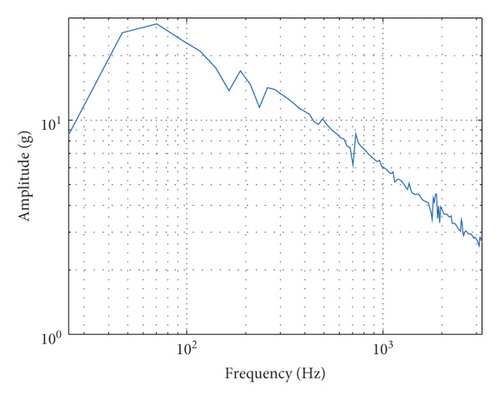
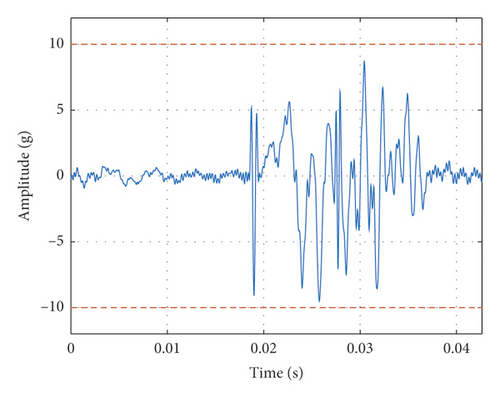
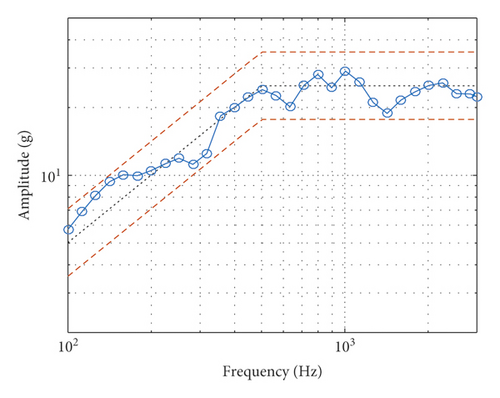
In Case B, the shaking table is fixedly connected with a light load (0.057 kg) and an accelerator (0.004 kg), as shown in Figure 11(a). The mass of movable parts of the shaker is 0.311 kg, including the weight of DUT and accelerometer. The output force of the shaking table under the acceleration of 10 g is 30.1 N. It can be seen that since the movable part is heavier, the output force must be larger to generate same acceleration. The measured FRF is shown in Figure 11(b), and it can be seen that there is a first-order natural frequency still around 46 Hz, which means that the light load will not strongly affect the natural frequency of the shaking system. The actual output TSW and its SRS of the shaking table are shown in Figures 11(c) and 11(d). It can be seen that the TSW meets the requirement of duration and maximum values. The SRS meets the requirement of test specification.
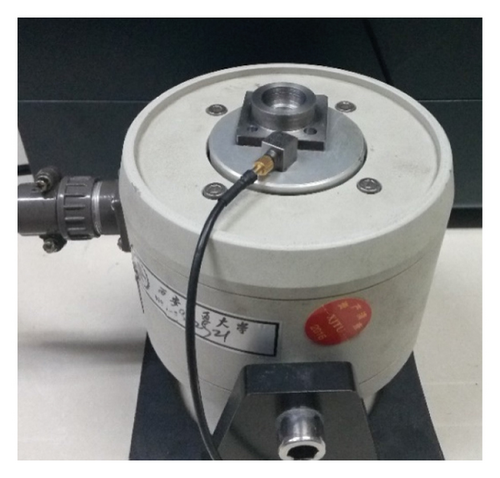
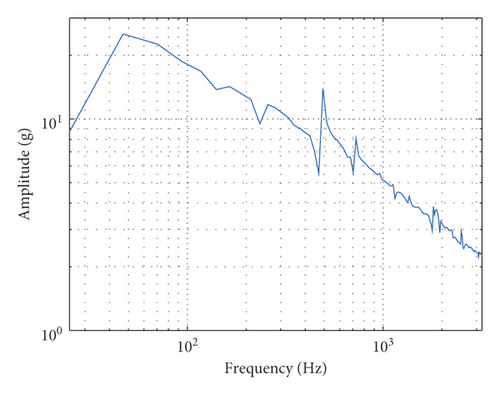
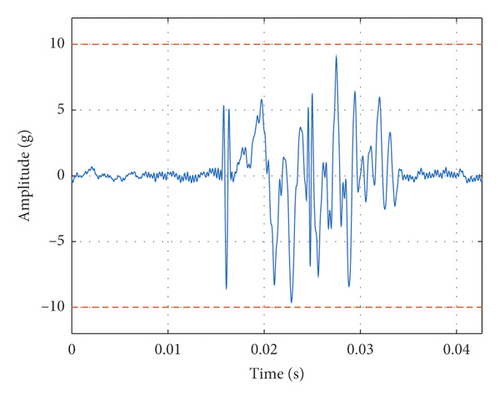
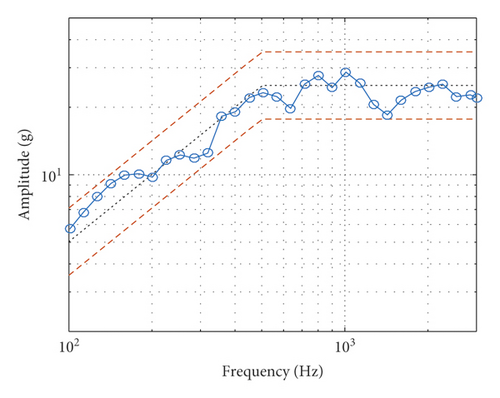
In Case C, the shaking table is connected with a heavy load (0.211 kg) and an accelerometer (0.004 kg), as shown in Figure 12(a). The mass of movable parts of the shaker is 0.465 kg, including the weight of the DUT and accelerometer. The output force of the shaking table under the acceleration of 10 g is 45.2 N. The measured FRF is shown in Figure 12(b), it can be seen that there is a first-order natural frequency about 45 Hz, which means that the heavy load will have a little bit influence on the natural frequency of the shaking system. The actual output TSW and its SRS of the shaking table are shown in Figures 12(c) and 12(d). It can be seen that the TSW meets the requirement of duration and maximum values. The SRS meets the requirement of test specification.
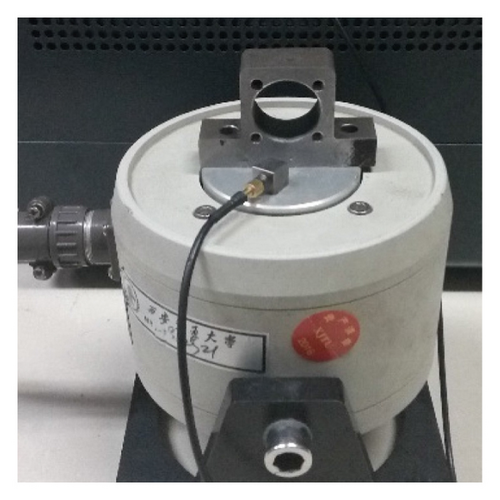
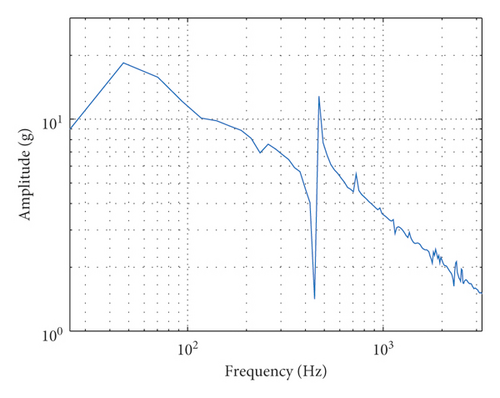
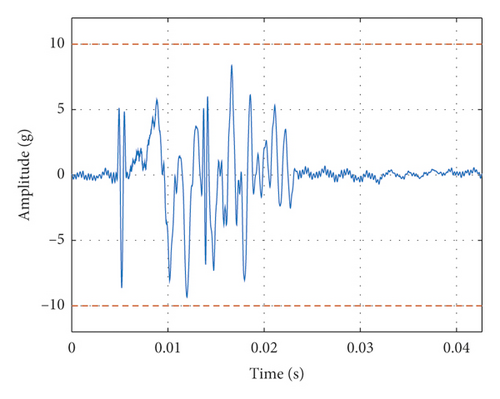
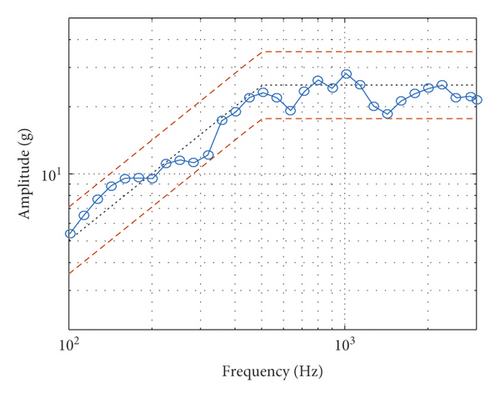
Furthermore, the shaking table will not work due to overcurrent protection if continues adding the load. It can be seen that under the allowable load of the shaking table, the time-domain matching result of the SRS perfectly agrees with the expected requirements. It also verifies that the time-domain matching strategy for the SRS proposed in this paper is effective.
6. Experimental Validation Using 1-Ton Shaking Table
6.1. System Description
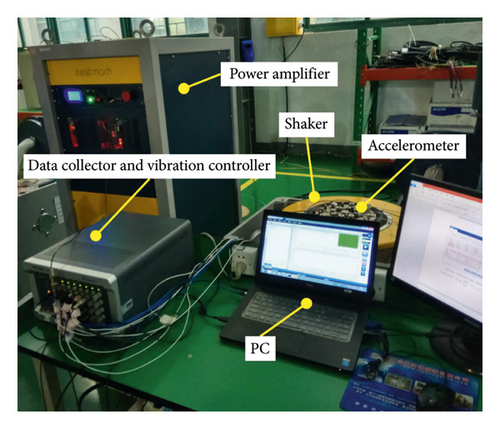
In this section, a 1-ton shaking table is used to further verify the effectiveness of the proposed method. The AVC system consists of the 1-ton electrodynamic shaking table (EDM-1000, 10 kN, ±51 mm, ±1000 m/s2, 5∼3000 Hz), power amplifier (VSA-H123A, 12 kVA), vibration controller (Econ VT-9008, DAC 24 bit, 0∼18750 Hz, ADC 24 bit, 204800 Hz), accelerometer (Kistler 8702B100M1, 51.5 mV/g, ±100 g, 0∼54 kHz, IEPE), PC, etc. The experimental equipment is shown in Figure 13.
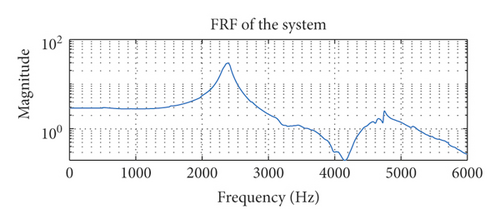
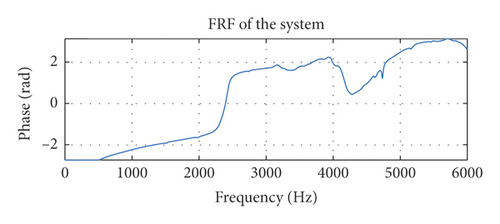
Similar to Section 5, the frequency response function of the system needs to be determined before the SRS validation. The FRF of the system in this experiment is identified by the frequency sweep technique, and the result is shown in Figure 14. We can see that there is a resonance point at about 2400 Hz, and an antiresonance point at about 4100 Hz. The vibration controller plays the role of making the actual output of the shaker consistent with the target waveform according to the FRF. Thus, the vibration controller will exert larger input to the shaker at its antiresonance point. This process is similar to Figure 9. Due to the limitation of the thrust and frequency range, the shaker cannot bear the SRS test with too high frequency or too large acceleration. Next, an experiment is carried out within the range of the shaker capacity.
6.2. Experimental Results
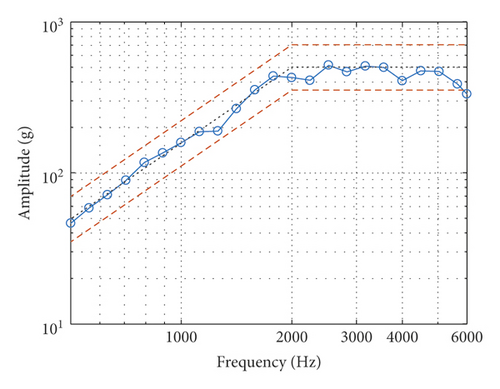
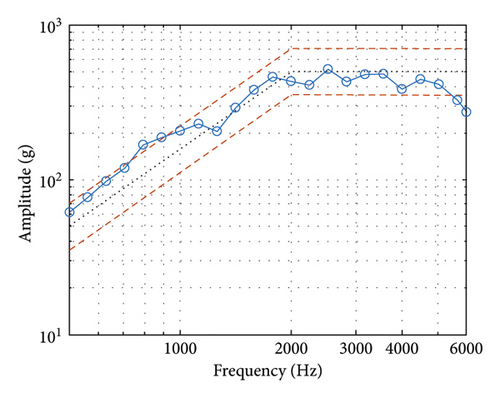
According to the characteristics of the shaker, the target SRS specification for the test is defined as fmin = 500 Hz, fc = 2000 Hz, fmax = 6000 Hz, Φ1 = 10 dB/Oct, and Φ1 = 500 g (5000 m/s2). The upper and lower tolerance envelop is with ±3 dB deviation of the specification line, the maximum TSW duration Tmax = 20 ms, frequency interval is 1/6 dB/Oct, damping ratio ζ = 0.05, and maximum acceleration of the shaker gmax = 100 g (1000 m/s2).
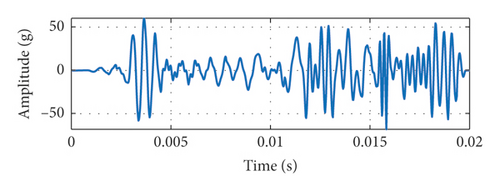
Before the test, the TSW conforming to the SRS specification was simulated and calculated based on GA. The parameters of GA are as follows. Population size is 500. Control population size is 30. Initial crossing probability is 0.7. Initial variation probability is 0.3. The maximum number of generation is 150. The simulated TSW and its SRS are shown in Figure 15. We can see that, in Figure 15(a), the maximum value of the simulated TSW is within the capacity of the shaker, and in Figure 15(b), the corresponding SRS is also within the tolerance of the standard SRS.
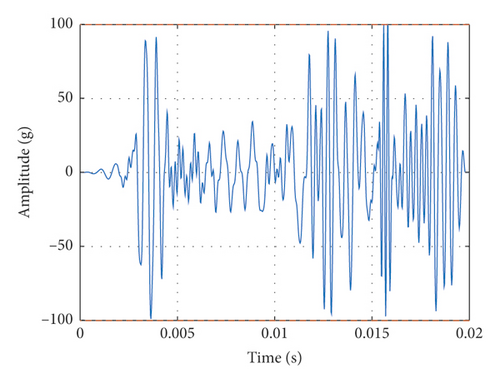
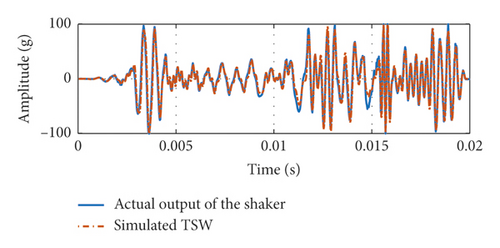
Next, the vibration controller to drive the shaker is used so that the actual output of the shaker confirms with the simulated TSW. Figure 16 shows the input and the actual output of the shaker. Due to the capacity limitation, there exists some error between the desired simulated TSW and the actual output of the shaker.
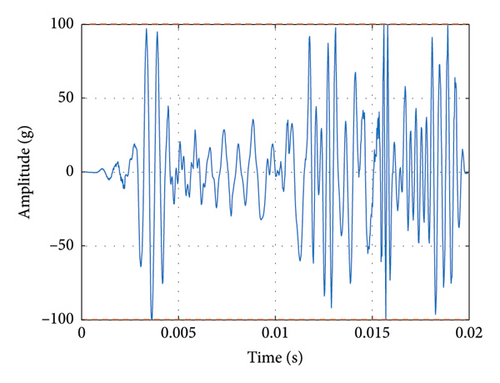
The final results are shown in Figure 17, where Figure 17(a) shows the actual output of the shaker and Figure 17(b) shows the corresponding SRS. We can find that there are some deviations between the actual SRS and the standard spectrum, especially at high frequencies. We guess that this may be due to the poor performance at high frequencies of the shaker.
7. Conclusion
In this paper, we proposed a novel intelligent time-domain shock waveform (TSW) parameters matching method for the shock response spectrum (SRS) test. The basic idea is to synthesis a TSW using a group of wavelets with different frequencies, amplitudes, and phases. However, it is challenging to find an optimal group of wavelets since there are hundreds of optimization variables and objective functions. We introduce a variable-weight method to the wavelet synthesis to combine the effects of hundreds of objective functions so that the optimization problem can be solved by using the genetic algorithm. We also take carefully the consideration of the frequency response function of the shaking system into the calculation of the objective function, making the synthesized TSW being able to be applied to the SRS test directly. To accelerate the convergence of the optimization, we introduce normalized control factors to the optimization variables so that they can be tuned in a reasonable small range. Finally, we carry out experimental validation of the proposed algorithm in two active vibration control systems, i.e., system with 500 N minishaker and system with 1-ton shaking table. It can be seen from the experimental results that, under the allowable load of the shaking system, the proposed method can accurately synthesize the input TSW, where the output TSW and SRS of the shaker can accurately meet the predefined time- and frequency-domain specification.
Conflicts of Interest
The authors declare that they have no conflicts of interest.
Acknowledgments
This work was supported by the National Natural Science Foundation of China (nos. 51705396 and 51775408) and China Postdoctoral Science Foundation (nos. 2018T111047 and 2017M610635).
Open Research
Data Availability
The data used to support the findings of this study are available from the corresponding author upon request.


