Mechanism Study and Reduction of Minivan Interior Booming Noise during Acceleration
Abstract
Interior booming noise during acceleration has been one of the most significant NVH problems for minivans. However, the generation mechanism of the interior booming noise remains unclear, so the access to reduce the booming noise is blocked. To solve the booming noise problem, a Source-Path-Receiver-Model-based approach is established to study the generation mechanism of the booming noise. Based on the generation mechanism, several modifications are proposed to reduce the minivan booming noise. In the established approach, the transfer path of the booming noise energy is figured out by the vehicle body and cavity experimental TPA, rear suspension dynamic analysis, and drivetrain torsional vibration analysis. Meanwhile, the vibroacoustic energy in the transfer processes is analyzed quantitatively. The identified generation mechanism is validated by the comparison of the test results of minivan interior noise and the simulation results from the established approach. During the minivan acceleration, the 5th torsional vibration mode (50.5 Hz) of the driveline is excited by the engine torsional vibration around 1500 r/min. Then, the driveline torsional resonance energy is transferred to the body and cavity through the rear suspension and finally leads to the interior booming noise. Based on the validated mechanism, several modifications are proposed to reduce the frequency response function of the driveline, the rear suspension, and the vehicle body around 50 Hz. With these modifications applied to the minivan, it is shown in the experimental results that the interior booming noise is reduced around 1500 r/min engine speed during acceleration. The mechanism study provides effective assistance with minivan interior booming noise reduction and the study approach also could be extended to explore the mechanism of other complex interior noise problems in automobiles.
1. Introduction
Automotive ownership in Asia has been continuously and rapidly rising during recent years [1, 2], but what followed are some serious problems of urban space and energy resources, so a kind of small and low-energy consumption automobile is strongly demanded; therefore, minivan is becoming more and more popular due to its advantages in small size, good fuel efficiency, and multipurpose [3, 4]. As minivans are more and more frequently used in carrying passengers, customers are paying more attention on the NVH performance and some NVH problems come out in minivans. One of the most significant is the interior booming noise during acceleration. This issue even turns to be more acute in East Asia, because booming noise is more annoying for the East Asians [5–7].
Over the past 35 years, many researchers have attempted to control the automotive internal booming noise. Much of this work has been focused on vehicle body. The internal sound field in the enclosed cavity is shown to be significantly affected by the acoustic characteristics of the cavity, the structural vibration of the compartment wall panels and the coupling of these two dynamic systems [8–17]. Since the amount of absorptive material required to control low-frequency noise can be prohibitively large, the most practical solution to the problem would seem to be modification of the vehicle structure. However, with the increase of engine power and the lightweight of vehicle body, the potential of structural modification to control the internal booming noise is becoming smaller. Especially in the real industrial world, only small changes on the vehicle body panels are allowed due to the mass production, so it is not enough to restrain the internal booming noise. Therefore, other possible effective methods in internal booming noise reduction have been sought. People start to turn to the vibration sources and the paths through which vibration energy can penetrate the cavity. But the automobile chassis is a very complex system as it contains a variety of mechanical components and excitations [18–24], and what’s more, early in the minivan development process, manufacturers did not pay enough attention on this problem, so the generation mechanism of interior booming noise remains unclear. This is also the reason why various methods have been tried in solving the booming noise problem by minivan manufacturers, but no satisfactory effect is reached.
In this study, the common phenomenon of the interior booming noise in minivans during acceleration is introduced based on experimental results. An approach based on the “Source-Path-Receiver” model [25, 26] is established to study the interior booming noise. The generation mechanism of the booming noise is identified by the proposed approach and validated by the comparison of interior noise test and quantitative simulation results. Based on the validated mechanism, several noise reduction modifications are proposed and applied to the minivan subsystems.
2. Problem Description
The interior booming noise problem occurred while minivans were accelerating on a straight flat road. When the engine was working in the range of low rotational speed (under 2000 r/min), the internal noise and vibration of minivan markedly increased and it came out a booming noise which oppressed the human occupants’ eardrums. The booming noise could make significant contribution to the human occupants’ discomfort and fatigue [6]. This problem became more serious when the minivan transmission was at the 3th, 4th, or 5th gear. Moreover, this phenomenon was found to be not associated with the vehicle driving speed; there was also no such noise when the vehicle engine reversed through the same speed range during deceleration or when the transmission is in neutral.
Front-engine-rear-wheel-drive (FR) is the most common layout of minivans. It is found that almost all the manual-transmission FR minivans in Asia have the problem of internal booming noise during acceleration. Figure 1 shows the interior noise test results of some Asian mainstream brands minivans driving at the 4th speed.
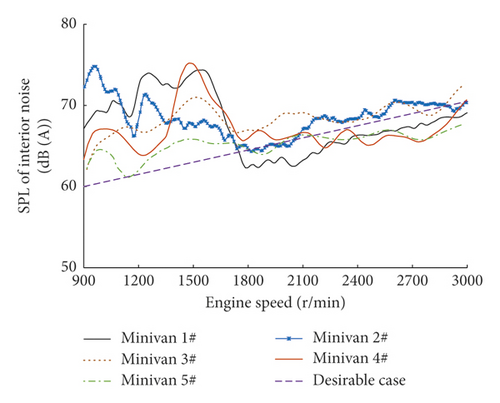
It is illustrated in Figure 1 that, for the desirable case, the interior noise sound pressure level (SPL) rises linearly as the engine speed increases and human occupants do not feel any discomfort or something abnormal, but for Minivans 1# to 5#, the interior noise SPL are quite high during the engine speed range from 900 r/min to 2000 r/min. Also, it can be seen in Figure 2 that the 2nd order component contributes the most to the internal noise, the peak of 2nd order noise SPL appears during the engine speed range from 900 r/min to 2000 r/min, and the frequency is around 50 Hz. This large-amplitude and low-frequency noise gives the occupants a strong feeling of booming.
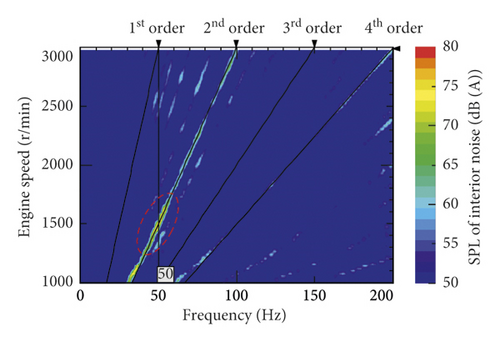
Minivan 4# is one of the most popular minivans in China, due to its large amount of productions and customers, the noise issue is fully exposed and shown to be a common problem. It is a typical case of minivans: manual transmission (five forward gears and one reverse gear), 1.5 L displacement engine, and FR layout. In addition, the internal booming noise of Minivan 4# is very significant which is shown in Figure 1. So, in this study, Minivan 4# is set as the main research object to explore the generation mechanism and efficient approach to solve this problem.
3. Interior Booming Noise Generation Analyses
3.1. Analysis Method
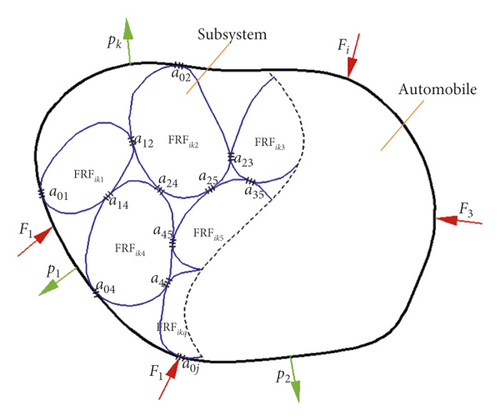
As the interaction in the multiple-subsystem collection is very complex, a Source-Path-Receiver-model-based approach is proposed to seek the main transfer paths and generation mechanism of minivan interior booming noise.
3.2. Experimental Transfer Path Analysis of Interior Booming Noise
To analyze the generation mechanism of minivan interior booming noise, the transfer paths by which the vibration energy enters vehicle cavity should firstly be identified. Experimental Transfer Path Analysis (TPA) provides an effective way to figure out this problem. Experimental TPA is a well-established technique for the estimation and ranking of individual low-frequency noise or vibration contributions via the different structural transmission paths from powertrain or wheel suspensions to the vehicle body [27–32].
When the sound pressure component on each transfer path is obtained, the contribution of each path to the interior noise can be calculated and the main transfer paths by which the vibration energy enters vehicle cavity can be identified.
For the FR minivan in this study, the scheme of the minivan internal booming noise TPA test is shown in Figure 4. The total number of the main attachment points is 20, including the engine mountings, the prop-shaft center support, front suspension, and rear suspension.
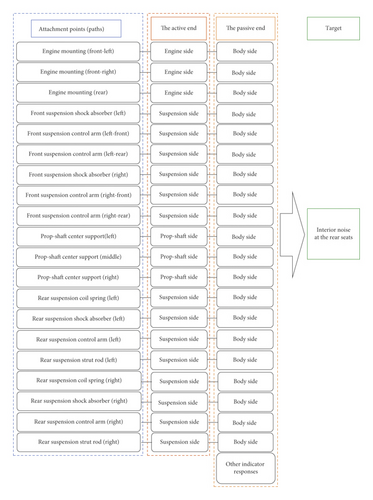
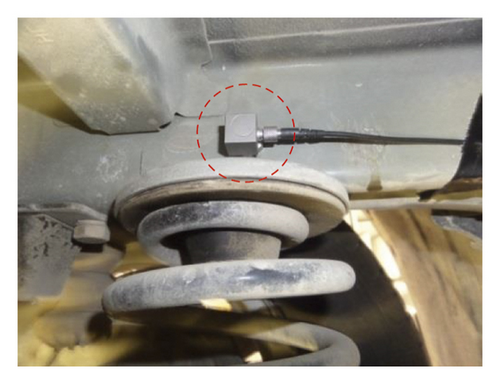
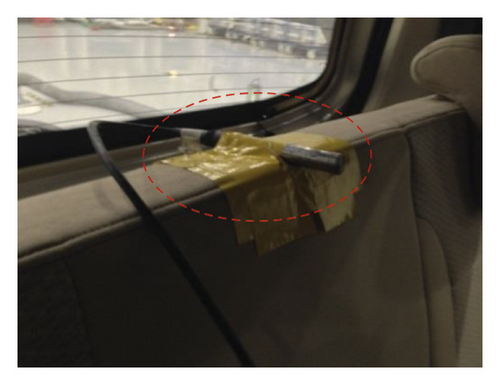
The test data acquisition hardware is Simcenter SCADAS Mobile, and the parameters of the sensors used in the TPA test are shown in Table 1. Matrix inversion method was used in the experimental TPA, and the acceleration sensors were installed at the active and passive ends of around attachment points, as shown in Figure 5(a), and the internal noise was collected by the sound pressure sensor in the middle of the rear seats (Figure 5(b)). The sampling frequency of microphone is 10240 Hz, and the sampling frequency of accelerometers is 1024 Hz. The acquisition time is 15 s, and the number of averages is 5.
| Sensor type | Microphone | Accelerometer |
|---|---|---|
| Model | PCB 378B02 | PCB 356A02 |
| Sensitivity | 50 mV/Pa | 10 mV/g |
| Frequency range | 3.75 to 20000 Hz | 1 to 5000 Hz |
| Mass loading | 45.8 g | 10.5 g |
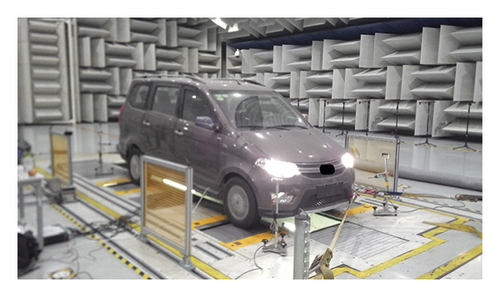
The minivan internal noise TPA test was conducted on a four-wheel low-noise chassis dynamometer in semianechoic chamber, as shown in Figure 6. Figure 7 shows the results of minivan internal noise TPA results at 1500 r/min engine speed at the 4th gear (when the booming noise occurred).
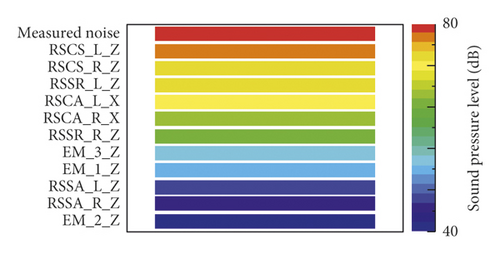
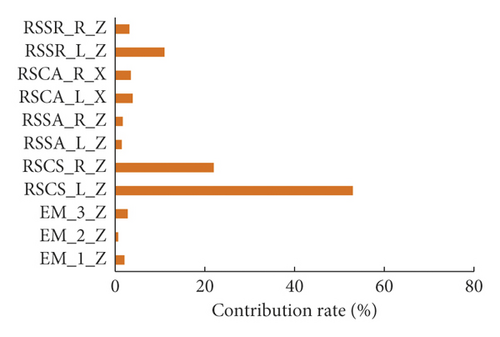
Eleven paths which make the largest contribution to the internal noise SPL are listed in Figure 7, and their locations and directions are displayed in Table 2. Figure 7(b) indicates that RSCS_L_Z and RSCS_R_Z in total contribute more than 70% to the minivan internal booming noise, so the rear suspension coil spring is identified as the main path to the internal booming noise.
| Abbreviation | Paths | Directions |
|---|---|---|
| EM_1_Z | Engine mounting (front-left) | z-axis |
| EM_2_Z | Engine mounting (front-right) | z-axis |
| EM_3_Z | Engine mounting (rear) | z-axis |
| RSCS_L_Z | Rear suspension coil spring (left) | z-axis |
| RSCS_R_Z | Rear suspension coil spring (right) | z-axis |
| RSSA_L_Z | Rear suspension shock absorber (left) | z-axis |
| RSSA_R_Z | Rear suspension shock absorber (right) | z-axis |
| RSCA_L_X | Rear suspension control arm (left) | x-axis |
| RSCA_R_X | Rear suspension control arm (right) | x-axis |
| RSSR_L_Z | Rear suspension strut rod (left) | z-axis |
| RSSR_R_Z | Rear suspension strut rod (right) | z-axis |
3.3. Rear Suspension Dynamic Analysis
The rear suspension coil springs are the main transfer paths for the energy of interior booming noise, so the rear suspension dynamics is analyzed to explain how the vibration energy transfers in the rear suspension.
3.3.1. Operating Deflection Shapes of Rear Axle
Operational deflection shapes (ODSs) analysis provides an efficient way to obtain the forced motion of a structure and can be measured directly by relatively simple means. They provide useful information for understanding and evaluating the absolute dynamic behavior of a machine, component, or an entire structure. So, the rear axle dynamic was investigated based on ODS analysis to explore how the excitation energy generated as shown in Figure 8. The test was conducted in a semianechoic chamber shown in Figure 6.
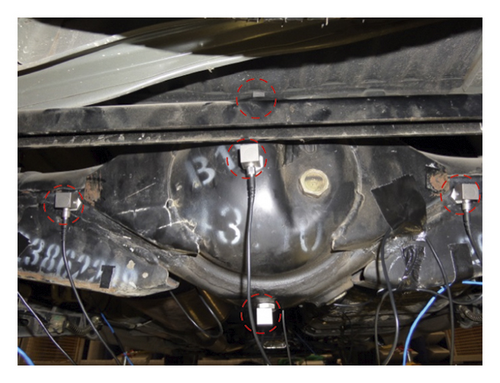
In the ODS test, the parameters of the accelerometers are shown in Table 3, and their locations are shown in Figure 9. The sampling frequency of accelerometers is 1024 Hz. The acquisition time is 15 s and the number of averages is 3.
| Sensor type | Accelerometer |
|---|---|
| Model | PCB 356A02 |
| Sensitivity | 10 mV/g |
| Frequency range | 1 to 5000 Hz |
| Mass loading | 10.5 g |
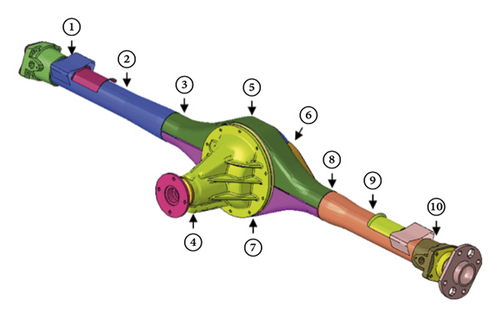
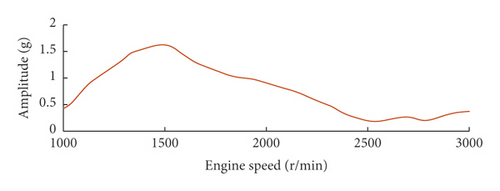
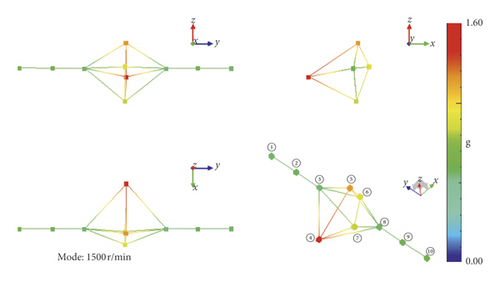
Figure 10 shows the deflection amplitude changes over different engine speeds at the input shaft of the rear axle. The largest deflection shape appeared at the engine speed around 1500 r/min engine speed. At the engine speed around 1500 r/min, the deflection shape of rear axle is shown in Figure 11. It is illustrated that the largest deflection appears at the input shaft of the rear axle, the deflections near the drive shaft are very small, and the deflection shape is the rear axle pitching around the drive shaft (around the y axis of the vehicle).
3.3.2. Multibody Dynamics Analysis of Rear Suspension
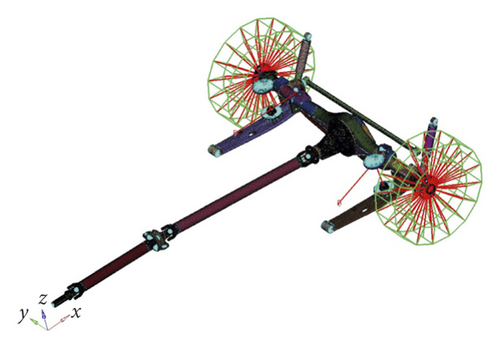
To explore the cause of the rear suspension pitching, a multibody dynamics model of a combined system with propeller shaft, rear axle, and rear suspension is built as shown in Figure 12. The vehicle body is simplified as mass attached to the rear suspension.
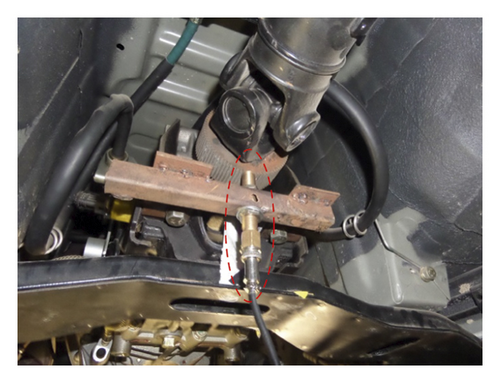
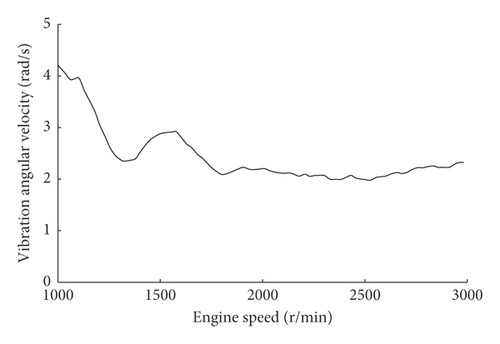
The multibody dynamics model is driven by the rotational velocity at the in-put shaft of propeller shaft. The rotational velocity of the in-put shaft of propeller shaft is acquired in the torsional vibration test as shown in Figure 13. The parameters of the sensor used in the torsional vibration test are shown in Table 4. The sampling frequency of magnetoelectric sensor is 20000 Hz, the acquisition time is 15 s, and the number of averages is 5. Shown in Figure 14 is the rotational velocity fluctuation of propeller shaft input end.
| Sensor type | Magnetoelectric rotational velocity sensor |
|---|---|
| Model | KJT-CSHJ12 |
| Frequency range | 5∼100000 Hz |
| Mass loading | 52 g |
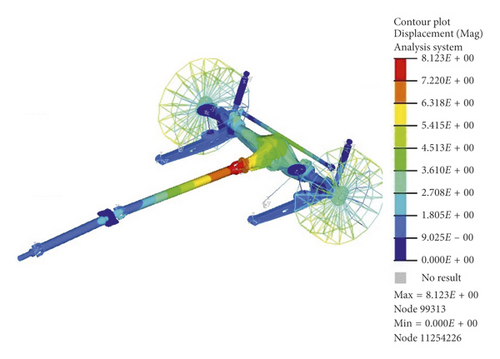
When the engine speed is around 1500 r/min, the deflection of the rear axle is shown in Figure 15. The deflection amplitude is determined with the colors on the rear axle, the color scale of the deflection amplitude is on the left side of the picture, and the unit is millimeter. It is illustrated that the maximum displacement is concentrated in the input shaft of the rear axle, the displacements close to the drive shaft are small, and the rear axle is pitching around the drive shaft. In the results of the ODS analysis and multibody dynamics analysis, the deflection shapes of rear axle are the same, also the maximum displacements are all concentrated in the same location, so the multibody dynamics analysis result is consistent with the ODS test. It shows the drivetrain torsional vibration induces the rear axle pitching and finally causes the interior booming.
3.4. Drivetrain Torsional Vibration Analysis
To analyze the torsional vibration characteristic of minivan drivetrain, a lumped-parameter model is built. Lumped-parameter model is proved to be very efficient and reliable in driveline torsional vibration analysis [33–36].
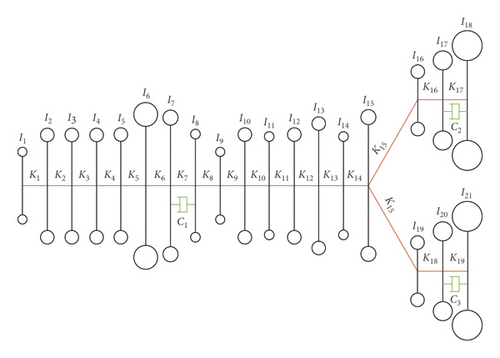
The minivan driveline torsional vibration lumped-parameter model consists of a V4 engine, flywheel, clutch, transmission, propeller shaft, rear axle, rear wheel, and vehicle body. Details are shown in Figure 16, and the parameters are given in Table 5.
| No. | Component name | Inertia (kg·mm2) | No. | Component name | Stiffness (Nm/rad) |
|---|---|---|---|---|---|
| J1 | Engine free end | 141 | K1 | Engine free end | 20883 |
| J2 | Crankshaft first quarter | 5386 | K2 | Crankshaft first quarter | 99891 |
| J3 | Crankshaft second quarter | 5512 | K3 | Crankshaft second quarter | 99891 |
| J4 | Crankshaft third quarter | 5512 | K4 | Crankshaft third quarter | 99891 |
| J5 | Crankshaft fourth quarter | 5421 | K5 | Crankshaft fourth quarter | 45363 |
| J6 | Flywheel | 70800 | K6 | — | Rigid |
| J7 | Clutch drive end | 20400 | K7 | Clutch | 344/2092 |
| J8 | Clutch driven end | 1130 | K8 | — | Rigid |
| J9 | Gearbox input shaft | 199 | K9 | Gearbox input shaft | 3155 |
| J10 | Gearbox other | 5076 | K10 | Gearbox other | 8574 |
| J11 | Prop-shaft input part | 966 | K11 | Prop-shaft input part | 32137 |
| J12 | Prop-shaft first shaft | 4334 | K12 | Prop-shaft first shaft | 58609 |
| J13 | Prop-shaft second shaft | 5632 | K13 | Prop-shaft second shaft | 27125 |
| J14 | Rear axle input shaft | 501 | K14 | Rear axle input shaft | 564 |
| J15 | Differential | 580 | K15 | — | Rigid |
| J16 | Right axle shaft | 3610 | K16 | Right axle shaft | 12992 |
| J17 | Right wheel | 430006 | K17 | Right wheel | 12447 |
| J18 | 1/2 vehicle body | 58334153 | — | ||
| J19 | Left axle shaft | 3654 | K18 | Left axle shaft | 11827 |
| J20 | Left wheel | 430006 | K19 | Left wheel | 12447 |
| J21 | 1/2 vehicle body | 58334153 | — | ||
| No. | Component name | Damping (Nm s/rad) | |||
| C1 | Clutch damping | 200 | |||
| C2 | Right wheel damping | 200000 | |||
| C3 | Left wheel damping | 200000 | |||
Setting [C] and [T] in (5) to be zero, the modal frequency and mode shape of each order can be obtained from (4). Table 6 illustrates torsional vibration inherent characteristic of the minivan drivetrain. It shows that one of the drivetrain torsional modal frequencies is near 50 Hz.
| Mode | Frequency (Hz) | Damping ratio |
|---|---|---|
| 1 | 1.6 | 0.0205 |
| 2 | 6.9 | 0.0067 |
| 3 | 29.6 | 0.0002 |
| 4 | 37.7 | 0.0416 |
| 5 | 50.5 | 0.0114 |
| 6 | 209.5 | 0.0434 |
| 7 | 215.8 | 0.0980 |
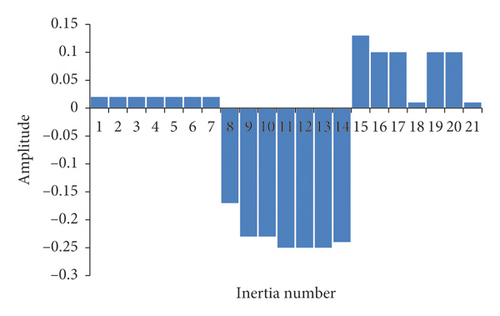
Figure 17 shows the 5th torsional vibration modal shape. In this mode, the largest vibration amplitudes are concentrated at the gearbox shafts, the propeller shafts and the rear axle shafts. The frequency of the 5th torsional vibration mode is 50.5 Hz.
At 1500 r/min engine speed, according to equation (7), the frequency of the engine’s 2nd order torsional vibration is 50 Hz. So, the 5th torsional vibration mode (50.5 Hz) could be excited by the 2nd order torsional vibration of the V4 engine at 1500 r/min engine speed (50 Hz); in other words, the drivetrain resonates at 1500 r/min engine speed.
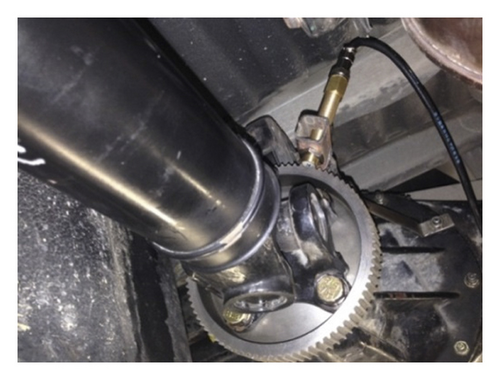
To validate the delivery of vibration energy in the driveline, the torsional vibration load in Figure 14 is used to drive the drivetrain lumped-parameter torsional vibration analysis model, and the torsional vibration of the rear axle input shaft is acquired by drivetrain torsional vibration test. In the drivetrain torsional vibration test, the data acquisition hardware is Simcenter SCADAS Mobile, the parameters of the sensor are shown in Table 7, and Figure 18 shows the location of the rotational velocity sensor. The sampling frequency is 20000 Hz, the acquisition time is 15 s, and the number of averages is 5.
| Sensor type | Magnetoelectric rotational velocity sensor |
|---|---|
| Model | KJT-CSHJ12 |
| Frequency range | 5∼100000 Hz |
| Mass loading | 52 g |
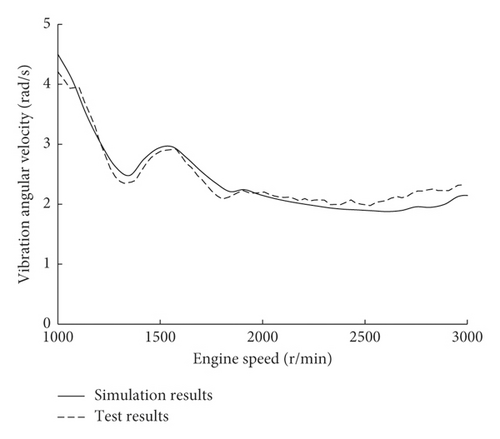
The lumped-parameter model simulation results and the torsional vibration test results are shown in Figure 19, and the simulation results are consistent with the test results. The drivetrain torsional vibration amplitude does not vary linearly with the engine speed, and it reaches a peak at the 1500 r/min engine speed, so a large amount of vibration energy is transferred to the rear suspension and finally leads to the interior booming noise.
4. Results and Discussion
4.1. Generation Mechanism Summary
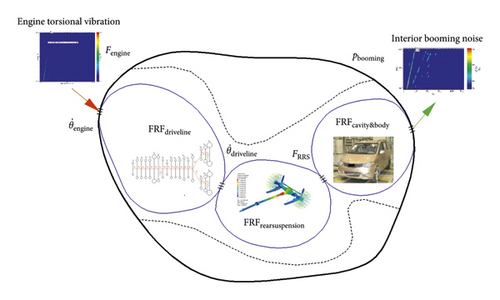
With the Source-Path-Receiver model-based approach in Section 3, the flow of vibroacoustic energy from the engine to interior cavity is identified as shown in Figure 20. During the minivan acceleration, the 5th driveline torsional vibration mode is excited by the engine vibration at low speed around 1500 r/min. Then, the driveline torsional resonance carries a large amount of vibration energy to the rear suspension and causes a violent pitching vibration of the rear axle. The vibration energy of the rear axle pitching is transferred to the body and cavity and finally leads to the interior booming noise.
4.2. Quantitative Validation
4.2.1. Engine Torsional Vibration Load
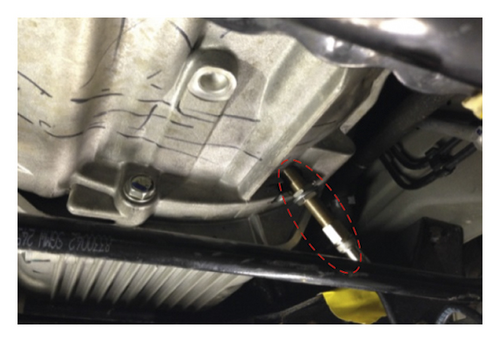
To quantify the engine torsional vibration load acting on the driveline, the flywheel angular velocity fluctuation is acquired during acceleration as shown in Figure 21, and the test results are shown in Figure 22.
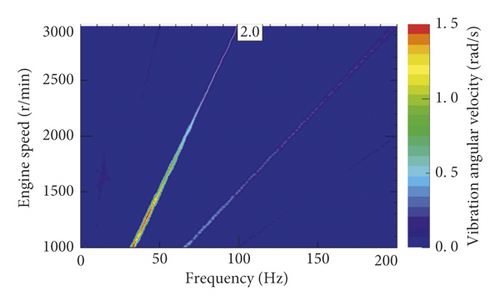
It is illustrated in Figure 22 that the 2nd order vibration energy is the main component in the flywheel torsional vibration, and the fluctuation amplitude in the 2nd order is larger in low-frequency range and at low engine speed.
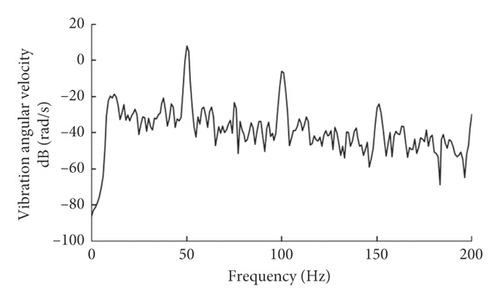
To obtain the input engine torsional vibration load at 1500 r/min engine speed, the angular velocity fluctuation is taken from Figure 22 and it is shown as Figure 23.
4.2.2. Frequency Response Function of Driveline
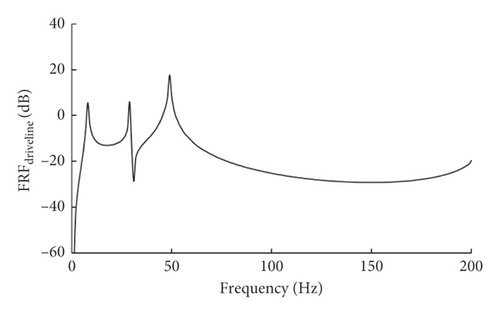
With the lumped parameters in Table 5, the frequency response function of the driveline can be calculated from (9) and (10), and FRFdriveline(ω) of the minivan is shown in Figure 24.
4.2.3. Frequency Response Function of Rear Suspension
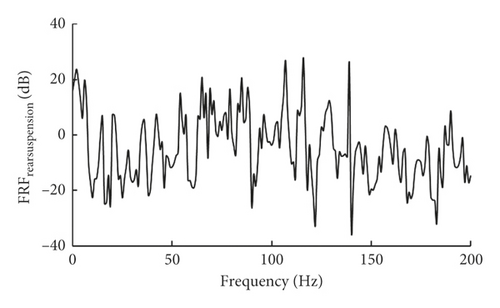
The frequency response function of the rear suspension is the FRF from rear axle input shaft to the passive side of rear suspension. The FRFrearsuspension(ω) can be calculated by the simulation of the minivan rear suspension multibody model in Figure 12, and the results are shown as Figure 25.
4.2.4. Frequency Response Function of Cavity and Body
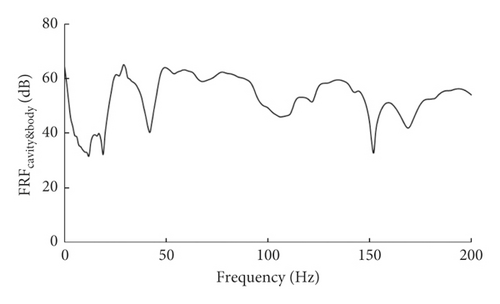
With the experimental TPA in Section 3.2, the frequency response function from the passive side of the rear suspension to the interior noise can be taken out, and the FRFcavity&body(ω) is shown as Figure 26.
4.2.5. Comparison of Simulation and Test Results
Bringing the quantified Fengine(ω), FRFdriveline(ω), FRFrearsuspension(ω), and FRFcavity&body(ω) into (8), the interior noise at 1500 r/min engine speed can be calculated, and the comparison of simulation results and test results is shown in Figure 27.
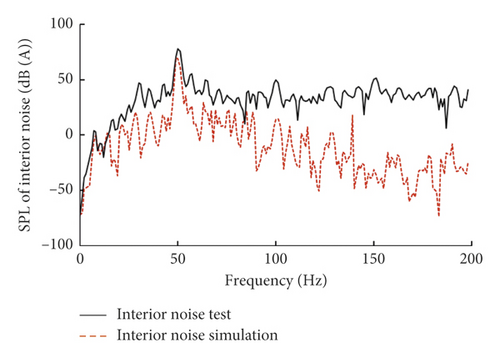
It is illustrated in Figure 27 that the simulation-based interior noise SPL agrees with the test-based results in the low-frequency range. Especially at 50 Hz, the frequency and amplitude of the simulation-based interior noise SPL are very close to the test results. The energy through the identified path is the main contribution to interior booming noise of the minivan at 1500 r/min engine speed. The generation mechanism in 4.1 is validated. However, in the frequency range 100∼200 Hz, the generation mechanism of the interior noise is different, and the noise energy is transferred into the cavity through other paths. Equation (6) is not applicative for the internal noise calculating in this frequency range, so the significant discrepancy appears between the interior noise test and simulation results in the frequency range 100∼200 Hz.
4.3. Minivan Interior Booming Noise Reduction
According to the generation mechanism and (6), it is effective to reduce the interior booming noise pbooming(ω) by decreasing Fengine(ω), FRFdriveline(ω), FRFrearsuspension(ω), or FRFcavity&body(ω) around 50 Hz. Since in real-world engineering, when the car has already been put into production, it is very difficult to modify the engine, the optimizations focus on the frequency response function of the driveline, the rear suspension, and the vehicle body.
4.3.1. Driveline Modifications
- (a)
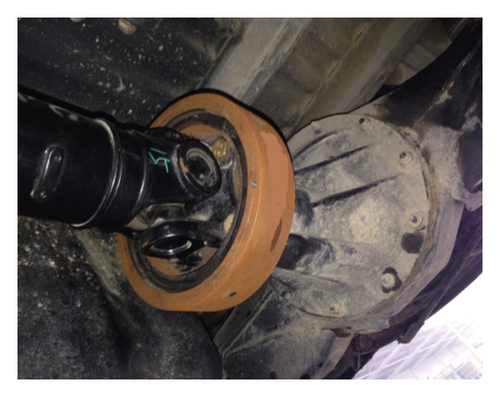
Add an inertia disc at the propeller shaft
- (b)
Add a torsional vibration damper (TVD) at the propeller shaft
- (c)
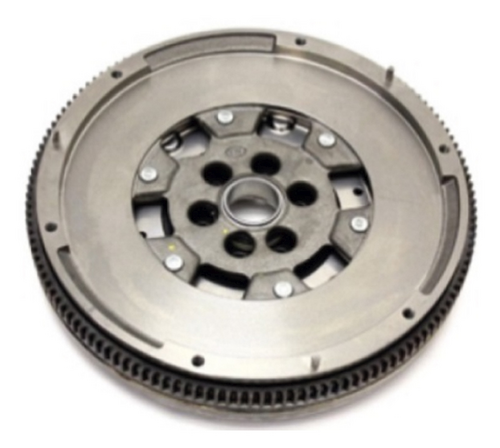
Replace the single mass flywheel with dual mass flywheel (DMF)
- (d)
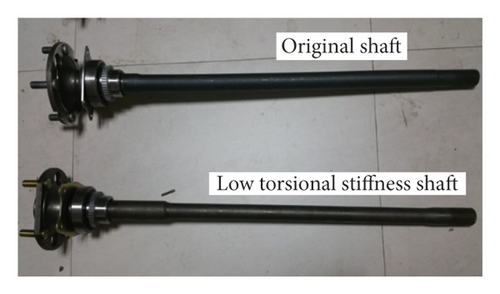
Reduce the torsional stiffness of the drive shafts
Bring the parameters of each modification to the model shown in Figure 16, respectively, and the simulation results of the driveline torsional vibration is shown in Figure 28.
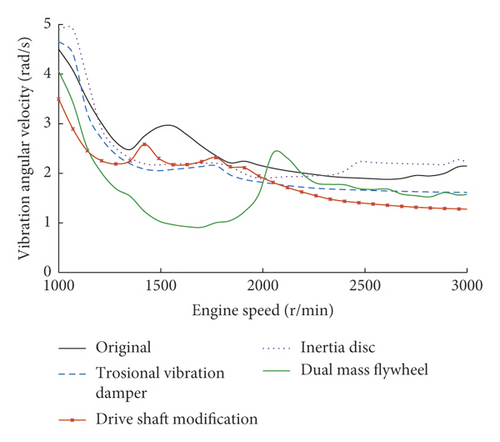
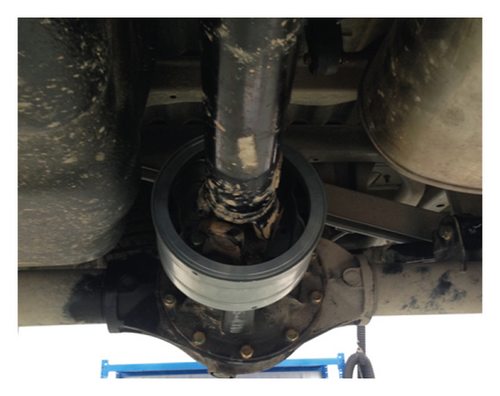
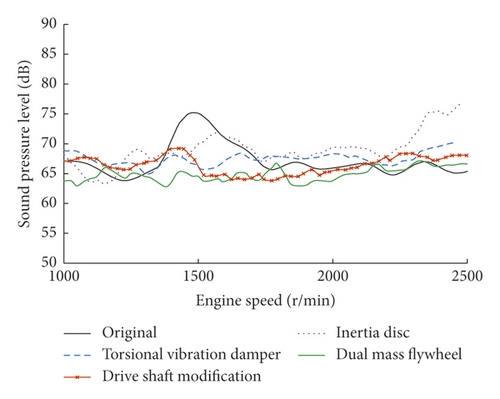
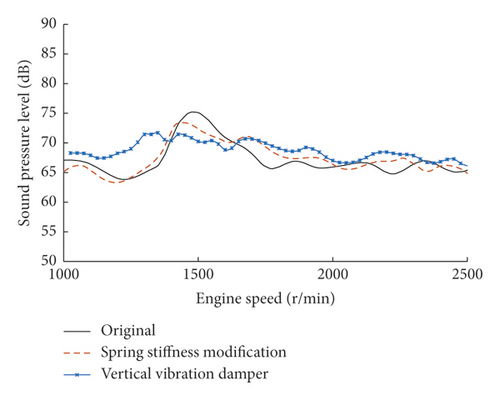
It is illustrated in Figure 28 that the torsional vibration amplitude around 1500 r/min engine speed is reduced obviously with the driveline modifications proposed above. The applications of the driveline modifications are shown in Figure 29, and the experimental results of the minivan interior noise during acceleration are shown in Figure 30.
4.3.2. Rear Suspension Modifications
- (a)
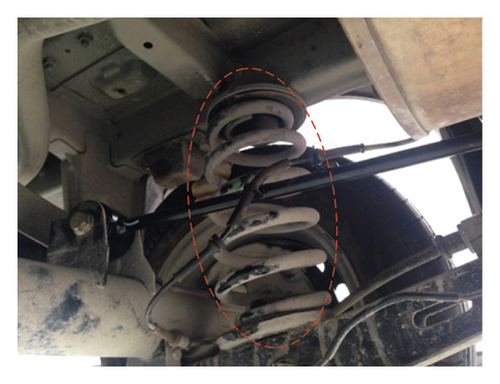
Reduce the suspension spring stiffness to improve the rear suspension vibration isolation around 50 Hz. To keep the handling stability performance, the maximum decrease is 10%. Shown in Figure 31 is the modified rear suspension spring.
- (b)
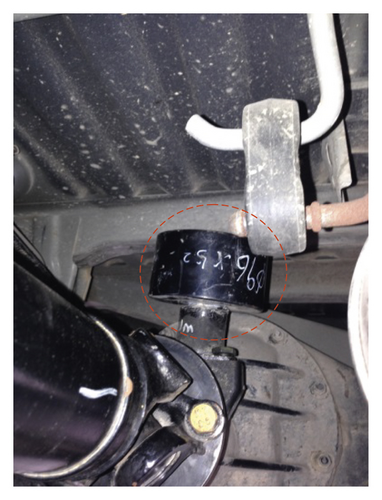
Add a vertical vibration damper to restrain the rear suspension pitching. The design frequency of the damper in the vertical direction is 50 Hz and the application of the damper is shown in Figure 32.
4.3.3. Vehicle Body Modifications
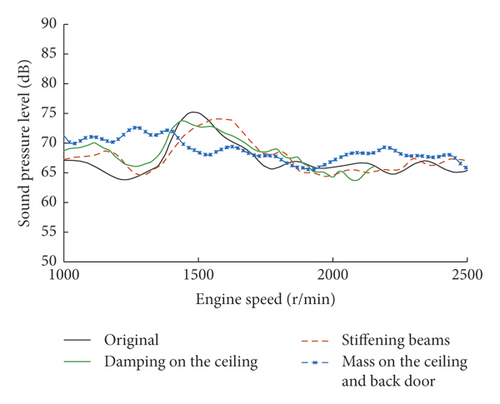
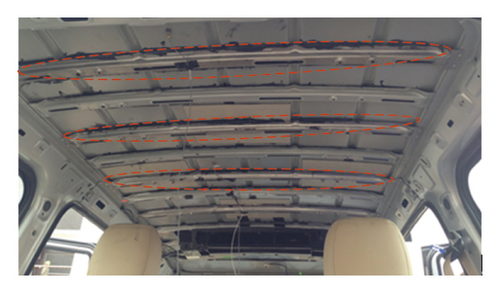
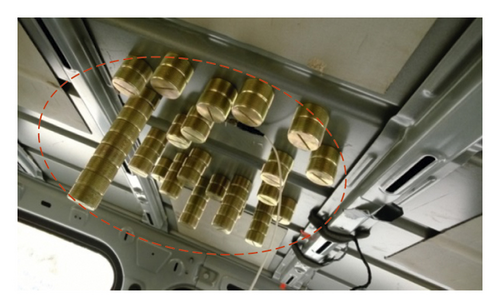
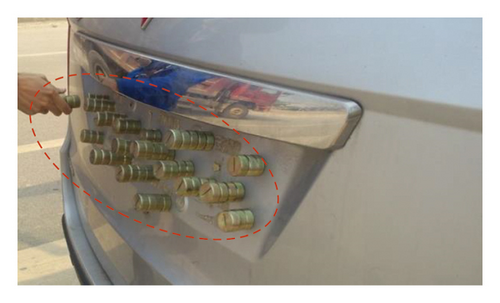
The FRF of vehicle body around 50 Hz is mainly influenced by large sheet metal parts; therefore, the ceiling and the back door is modified to reduce the minivan interior booming noise during acceleration. Shown in Figure 33 are the vehicle body modifications and the experimental results of the minivan interior noise during acceleration are shown in Figure 30

4.3.4. Experimental Validation of the Noise Reduction Measures
The minivan interior noise during acceleration is recorded for each modification proposed in Sections 4.3.1–4.3.3. The experimental analysis results are shown as Figure 30
With the modifications to decrease the FRFdriveline(ω), the FRFrearsuspension(ω), and the FRFcavity&body(ω), the interior booming noise is reduced around 1500 r/min engine speed during minivan acceleration. Among all the measures, DMF can observably reduce the interior noise around 1500 r/min engine speed without increasing the interior noise in other engine speed range. TVD at the propeller shaft, drive shaft stiffness modification, vertical vibration damper on rear axle, and mass on the ceiling and back door also make a good performance in interior booming noise reduction.
5. Conclusion
- (a)
The generation mechanism of minivan interior booming noise during acceleration is identified. During the minivan acceleration, the 5th driveline torsional vibration mode (50.5 Hz) is excited by the engine vibration at low speed around 1500 r/min. Then, the driveline torsional resonance carries a large amount of vibration energy to the rear suspension and causes a violent pitching vibration of the rear axle. The vibration energy of the rear axle pitching is transferred to the body and cavity and finally leads to the interior booming noise.
- (b)
The vibroacoustic energy in the transfer processes is quantitatively analyzed by the Source-Path-Receiver-Model-based approach. The identified generation mechanism is validated by the comparison of interior noise test results and quantitative simulation results. This approach also could be applied to study other similar complex automobile interior noise problems.
- (c)
Based on the generation mechanism, several modifications are proposed and applied to the interior booming noise reduction. With these modifications, the interior booming noise is reduced around 1500 r/min engine speed during minivan acceleration. The generation mechanism study and the proposed approach provide effective assistance with minivan interior booming noise reduction in engineering.
Conflicts of Interest
The authors declare that there are no conflicts of interest regarding the publication of this paper.
Acknowledgments
This study was supported by the National Natural Science Foundation of China (grant number 51775451). The authors thank SGMW Automobile Co. Ltd and the China Automotive Technology & Research Center for supporting the completion of this work.
Open Research
Data Availability
The data used to support the findings of this study are available from the corresponding author upon request.


