Simulation and Analysis of Land-Surface Processes in the Taklimakan Desert Based on Noah LSM
Abstract
This study evaluated the Noah land-surface model performance to simulate the land-surface process during different weather conditions in the hinterland of the Taklimakan Desert. This study is based on observation data from the Taklimakan Desert Meteorology Field Experiment Station in 2014. The results illustrated that the energy-exchange process between the land surface and the atmosphere in the drifting desert can be simulated by Noah effectively. However, the effects of soil moisture and latent heat flux were very poor. For sunny days, the soil temperature and heat flux were underestimated significantly in the nighttime and overestimated in the daytime. The simulation results are very good in sand-dust weather. The simulation of heat flux and net radiation is very consistent with the observation during cloudy days. For rainy days, the model can successfully model the diurnal variation of soil moisture, but it has obvious deviations in the net radiation, heat flux, and soil heat flux.
1. Introduction
Land-atmosphere interactions consider the process of exchanging matter and energy between the land surface and the atmosphere on earth, which is influenced by the weather and climate change on different spatial and temporal scales [1]. A land surface provides the necessary underlying surface conditions for the weather and climate model [2]. There are significant different land-surface processes in each underlying surface because of respective land-surface parameters [3].
A desert is a special underlying surface that has a high surface albedo, low water content, extremely low amount of precipitation, and sparse vegetation. Generally, its latent heat can be ignored [4]. Instead, sensible heat transportation is the main form of exchanging energy between the land and the atmosphere in desert areas [5–8]. Due to their special land-surface features, the performance of current land-surface models to simulate the land-surface processes in deserts was not ideal [9]. Therefore, to address this deficiency in the simulations, researchers obtain field data of deserts to understand their land-surface parameters and their land-atmosphere interactions; by combining observations with simulations, the land-surface parameters and parameterization scheme were modified, and the performance of the model of the energy and material exchange process in the desert area was improved [10].
Recently, several observational experiments on land-atmosphere interactions have been carried out in the drifting desert of Taklimakan Desert’s hinterland. By combining field data with a common land-surface model, Liu et al. [11] and Mamtimin et al. [12] revealed the basic features of land-atmosphere interaction in the Taklimakan Desert. Meanwhile, the observed data were also used to improve the parameterization scheme of land-surface models. Using the observed radiation data obtained at the Tazhong station, according to its time variation characteristics, Liu et al. [13] proposed a one-factor parameterization scheme to determine the albedo, thereby replacing the albedo scheme in the CoLM (Common Land Model), and improved the simulation’s ability to model energy flux. Based on the observed data of gradient velocity, emissivity, and soil thermal conductivity, Li [14] optimized the default parameters in CoLM2014 and achieved improved performance.
Researchers have also simulated land-surface processes in the other deserts of northwest China. In virtue of the observation data obtained of the Badain Jaran Desert, Zheng and Liu [9] calculated some key parameters of the relevant land-surface process such as the surface albedo, emissivity, roughness, soil heat capacity, and thermal conductivity and established a desert land-surface model. Other researchers have also improved the parameters and parameterization schemes of land-surface models and achieved some improvements [15–17]. However, some researchers have shown that there are differences in the radiation budget and moisture exchange under different weather conditions [14, 17], and the simulations of the land-surface process under different weather conditions have not yet been considered in detail. Thus, it is essential to simulate land-surface processes comprehensively in different weather conditions.
In this paper, we used data observed by the Taklimakan Desert Meteorological Field Experiment Station (hereafter called the Tazhong station) in 2014; the albedo and emissivity were corrected based on observation data at first, and then the land-surface processes in the drifting desert were analyzed and simulated by Noah; the simulation of soil temperatures, humidity, energy fluxes, and the land-surface processes in four typical weather conditions were analyzed against observation. Causes of the similarities and deviations of the simulation with the observed data are discussed.
2. Data and Model
2.1. Observation Station and Data
The Taklimakan Desert Meteorological Field Experiment Station (38°58′N, 83°39′E, 1099.3 m, the Tazhong station for short) is located in the hinterland of the Taklimakan Desert. The land surface primarily contains moving dunes. There is no vegetation cover, and the climate is extremely dry. The mean annual air humidity, temperature, and precipitation are 0.0035 kg·m−3, 12.4°C, and 29.4 mm, respectively. The prevailing wind has been easterly for years. The average wind speed is 2.5 m·s−1, and the maximum and minimum air temperatures are 45.6°C and −32.7°C, respectively. Sand-dust storms occur 59 days a year [18]. At the station, an observation tower was built to monitor land-atmosphere interactions in the drifting desert. The station is configured with a gradient-detection system, and an eddy covariance system and an observation system to determine the surface radiation budget. The data items used in this study are shown in Table 1. The automatic sensors provided average values (30 min intervals) f; the hourly observation atmospheric forcing data included the air temperature, precipitation, eastern (u) and northern (v) wind speed, atmospheric longwave radiation, solar shortwave radiation, pressure, specific humidity, multilayer soil temperature and soil moisture, soil heat flux, sensible heat, and latent heat flux. The specific information on the observation instruments and equipment at the Tazhong station that were used in 2014 is provided in Table 1.
| Item | Height or depth (m) | Sensor type | Main parameters of the instrument or equipment |
|---|---|---|---|
| Wind speed | 0.5, 1, 2, 4, 10 | Met One 010C | Measurement range: 0–60 m·s−1, start-up wind speed: 0.22 m·s−1, accuracy: ±1% (0.3 m·s−1), operating temperature: −50 to 65°C |
| Wind direction | 2, 10 | Met One 020C | Measurement range: 0–360°, start-up wind speed: 0.22 m·s−1, accuracy: ±1%, operating temperature: −50 to 65°C |
| Air temperature and humidity | 0.5, 1, 2, 4, 10 | Vaisala HMP45D | Measurement range: −40 to 60°C, accuracy: ±0.2°C (20°C), RH: 0–100% |
| Soil temperature | −0.05, −0.1, −0.15, −0.2, −0.4 | Campbell 109L | Measurement range: −40 to 100°C, accuracy: ±0.2°C (0–70°C), ±0.5°C (−50°C) |
| Soil humidity | −0.025, −0.1, −0.2, −0.4 | Campbell CS616 | Measurement range: 0.05% VWC, resolution: 0.1% VWC |
| Soil heat flux | −0.025, −0.5, −0.8 | Hukseflux HFP01 | Sensitivity: 50 µV·W−1·m−2, accuracy: ≤3%, temperature range: −30 to 70°C |
| Wind fluctuation | 3 | Campbell CSAT3 | Wind speed range: 0–30 m·s−1, accuracy: Ux, Uy <±4.0 cm·s−1 and Uz <±2.0 cm·s−1, resolution: Ux and Uy is 0.01 m·s−1 and Uz is 0.005 m·s−1, sound speed: 0.01 m·s−1 |
| CO2/H2O fluctuation | 3 | LI-COR 7500 | Sampling frequency: 20 Hz, measuring range: CO2 is 0∼5000 mg·m−3, H2O is 0–42 g·m−3 |
| Shortwave and longwave radiation | 1.5 | Kipp & Zonen CNR-1 | CM3: response time: 18 s, linear error: <25 W·m−2, spectral range: 305–2800 nm, accuracy of daily exposure: ±10%, CG3: response time: 18 s, linear error: <25 W·m−2, spectral range: 50–500 nm, accuracy: ±10%, operating temperature: −40 to 70°C |
2.2. Model Introduction
We used version 3.4 of the Noah model in this study. Noah was developed based on the Oregon State University (OSU) land model, and it followed the force-restore principle [19]. In the initial version of Noah, the soil was divided into two layers, and the soil temperatures and soil water content were calculated by the thermal diffusion and Richardson’s equations, respectively [20]. The latent heat flux was calculated via the Penman formula [21]. Land-surface static data are essential for Noah, the vegetation types were taken from the U.S. Geological Survey (USGS) classification scheme, and the global soil dataset was obtained from the World Food and Agriculture Organization database (http://www.fao.org). The calculation module incorporated the bioclimate, energy, canopy radiation transfer, momentum/sensible heat/latent heat flux exchange, soil and snow temperatures, hydrology, and dynamic vegetation. Within Noah, the effects of local factors such as the atmosphere, vegetation, and snow cover on the land-surface processes are considered comprehensively. Noah is able to simulate soil temperatures, soil water content, canopy water content, snow depth, energy flux, and the upward longwave and shortwave radiation intensities [19]. The model has been widely used in the weather/climate model by the National Centers for Environmental Prediction, and it has been coupled with WRF (Weather Research and Forecasting) models and RegCMs (regional climate models). Through applications and validations, Noah has been developed continuously. The main improvements include the soil layer being divided into four layers (0.1, 0.3, 0.6, and 1.0 m from top to bottom), modification to the canopy conductance formulation [22], evapotranspiration on bare land and vegetation phenology [23], and a new run-off model [24]. Additionally, the parameterization scheme of thermodynamic roughness and coefficient of sensible heat exchange on the surface layer have been improved [25].
3. Research Methods
3.1. Modification of Surface Parameters
| Month | 1 | 2 | 3 | 4 | 5 | 6 | 7 | 8 | 9 | 10 | 11 | 12 |
|---|---|---|---|---|---|---|---|---|---|---|---|---|
| Albedo | 0.32 | 0.31 | 0.29 | 0.28 | 0.26 | 0.25 | 0.25 | 0.27 | 0.28 | 0.30 | 0.31 | 0.32 |
In addition, the surface broadband emissivity was defined as 0.905 in the Taklimakan Desert using FTIR and MODIS according to the method of Li et al. [28]. We modified the monthly average albedo and surface broadband emissivity of the 19th vegetation type of Noah.
3.2. Simulation and Analysis Method
4. Simulation Results and Analysis
4.1. Soil Temperature
The soil temperature (ST) is very important in land-surface processes. Figure 1 shows a contrast curve (Figure 1(a)) and scatter plot (Figure 1(b)) of the simulated and observed values of the soil temperature at a depth of 10 cm. The model could simulate the variations of soil temperature at the Tazhong station effectively, and the correlation coefficient is 0.994. Overall, the simulation errors are minimum in winter and summer and maximum in spring. The main reason of the large errors is that there are frequent sand-dust storms in spring in the Taklimakan Desert, where wind speed and direction were varied and a big temperature difference was seen between the day and the night of autumn. The performance of modelling soil temperature was very good in the range from −10 to 15°C, while soil temperature was underestimated in the range from 16 to 45°C, especially in spring.
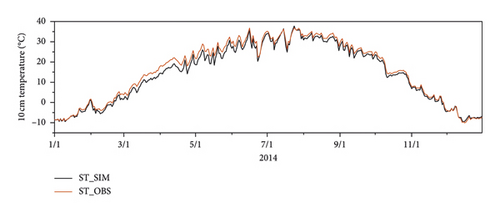
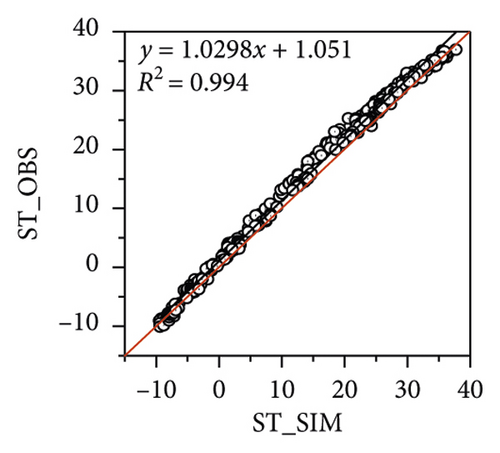
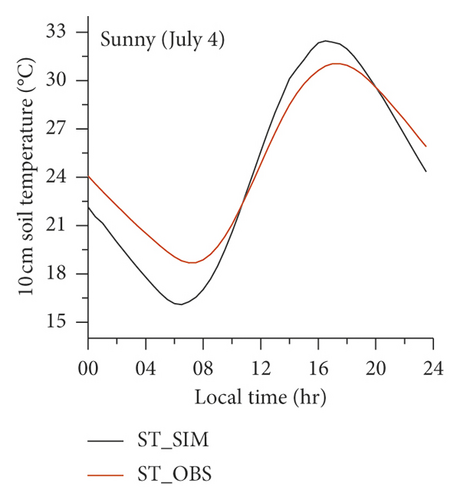
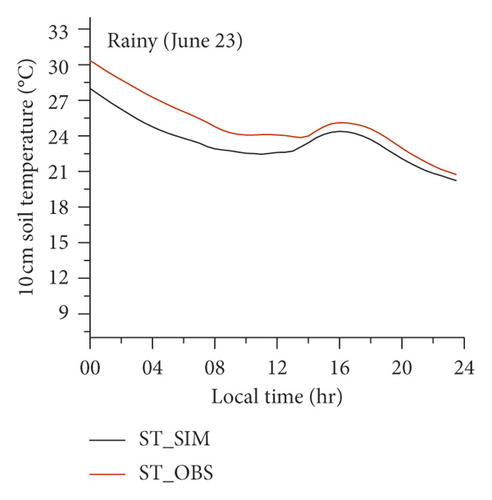
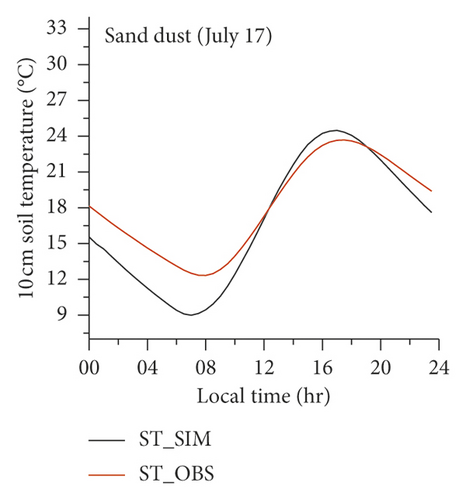
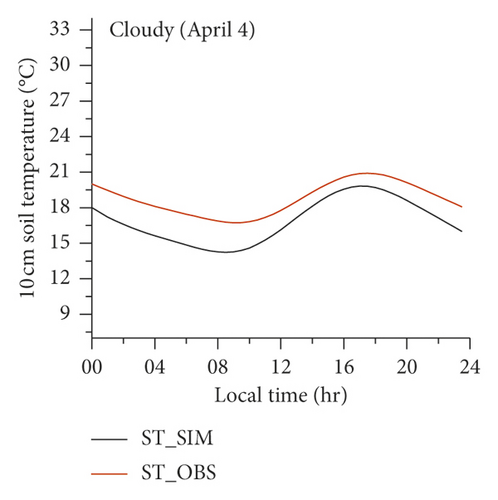
Figure 2 shows a contrast curve of simulated and observed values of the soil temperature at a depth of 10 cm in the four weather processes. The ST declines after rainfall, and its variation trend was simulated well. For cloudy days, the simulation of ST was not good. During sand-dust weather, the simulated ST was underestimated at night. During sunny days, the lowest temperature was at about 6 AM in the morning. For rainy days, low temperatures manifest as a smooth transition. For cloudy and sand-dust weather, the lowest temperatures were between 7 and 8 AM.
4.2. Soil Moisture
The simulation of soil moisture (SM) is displayed in Figure 3; it indicates that Noah could simulate the variation of soil moisture well, but with a very low correlation coefficient, where R2 is 0.341. In nonprecipitation periods, the soil moisture ranges from 0.015 to 0.030 kg·kg−1. After the rainfall on June 23, the SM was overestimated obviously, and the variation of SM was very sensitive to rainfall.
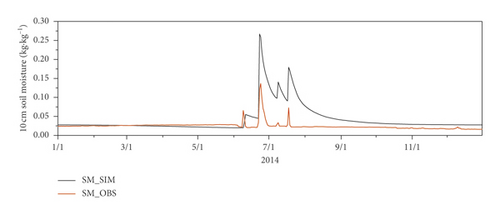
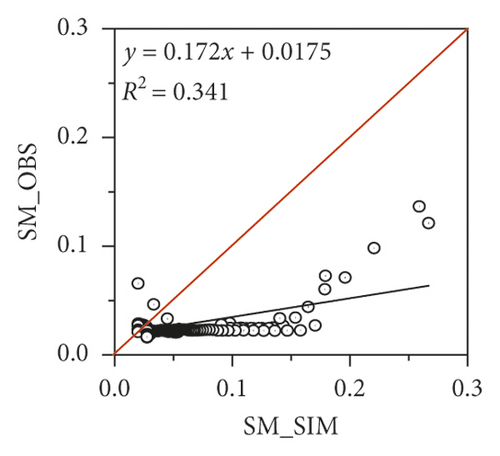
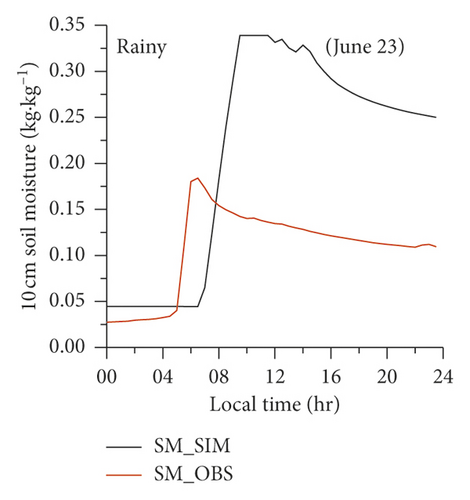
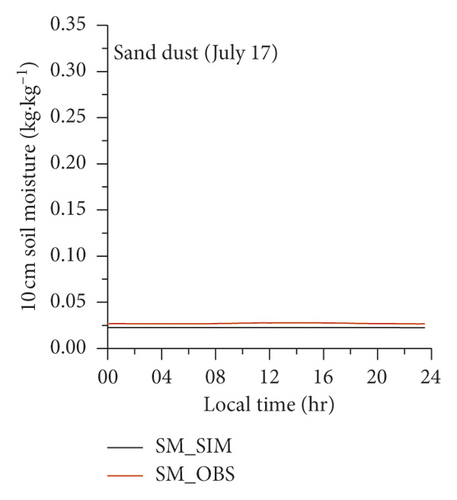
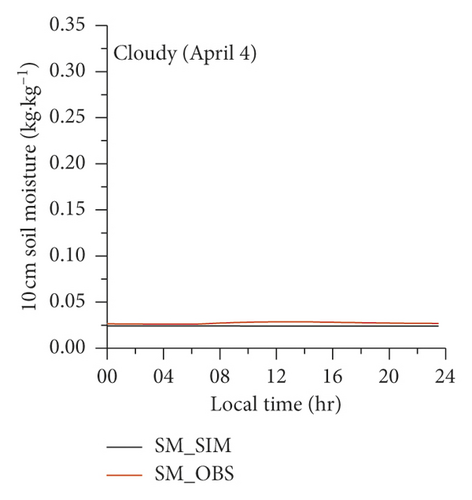
Figure 4 shows a contrast curve between the simulated and observed soil moisture (at a soil depth of 10 cm) for the four types of weather. It is illustrated that the simulation of soil moisture in the sunny, cloudy, and sand-dust days was close to the observation. For rainy days, the soil moisture increases rapidly and has a lag of about half an hour. Furthermore, the peak value is over two times higher than the actual value. In consideration of the extreme dry climate in the Taklimakan Desert, the air humidity is very low and the air is dry and hot during summer. When rainwater enters the ground, its evaporation is rapid and only a portion of the moisture permeates into sublayer soil due to the soil porosity of the desert. As a result, the SM is overestimated after rainfall.

4.3. Sensible Heat Flux
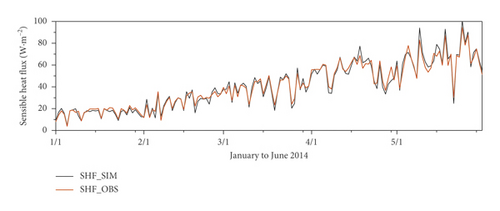
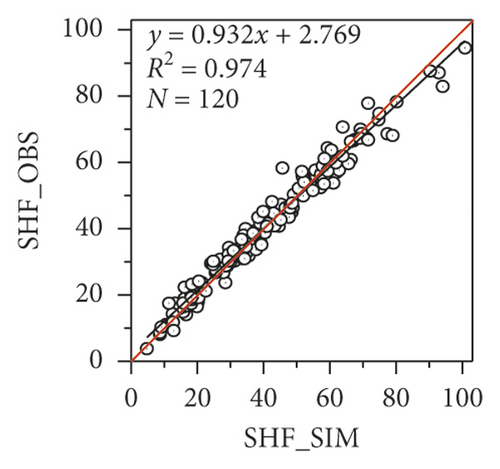
The sensible heat flux (H) is a main component of energy transfer on the land surface, and it reflects the heat exchange strength between the ground and the atmosphere. It is a key physical quantity that can be used to evaluate the simulation’s ability to effectively model land-surface processes. From Figure 5, it can be seen that the model effectively reproduces the trend of the measured sensible heat flux, with a correlation coefficient of 0.974. From January to February, the fluctuation range is narrow, and it becomes wider in March and thereafter. According to equation (3), the primary cause of the fluctuations is the greater change in wind speed and direction during spring, resulting in the violent change in the sensible heat flux. During winter, the amount of received solar radiation energy is relatively small, and the ground temperature and air temperature are underestimated. Moreover, the atmospheric stratification is stable; thus, the variation range of the sensible heat flux is small. A sand-dust storm from May 17 to 18 in the Tazhong station resulted in a sudden reduction in the sensible heat flux because the solar radiation was blocked by the sand dust. When the actual sensible heat flux is larger than 75 W·m−2, the simulation was greater than the observation.
The sensible heat flux diurnal variation of the simulations in the four types of weather condition was obviously different (Figure 6), and the model can simulate the change in sensible heat flux well during sunny days. From 8 AM to 8 PM, the sensible heat flux is positive, and the solar radiation was absorbed by the ground. Thereafter, the heat is radiated back to the air. For rainy days, H declines remarkably. During the afternoon, with the gradual decrease in solar radiation and soil moisture evaporation, the sensible heat flux declines rapidly. In cloudy weather, the simulation had a good agreement with the observation. Because the longwave inverse radiation to the sky was radiated from the land surface rapidly at night, the air temperature is a little higher than the surface temperature [11]. Thus, the sensible heat flux is in the range of 0 to −50 W·m−2 in the nighttime. During sand dust, the amount of received solar radiation is obviously reduced, so H was underestimated during sunny and cloudy days.

4.4. Latent Heat Flux
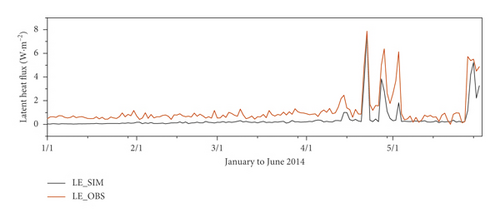
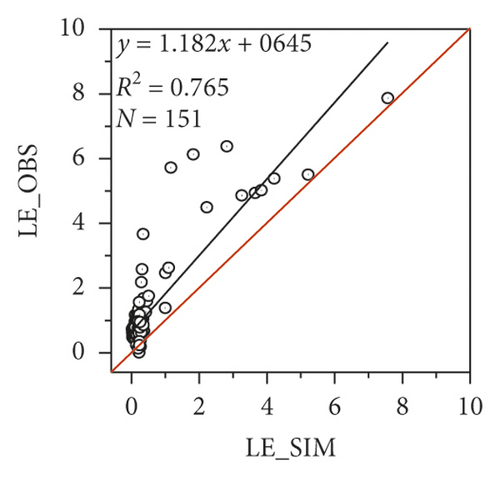
The latent heat flux LE mainly manifests as a water phase transformation and the amount of heat absorbed and released via water evaporation from the land surface/vegetation. In the Taklimakan Desert, the climate is extremely dry and there is no vegetation covered. During nonrainfall periods, the latent heat flux is very small. Figure 7 indicates that the simulation of latent heat fluxes was underestimated generally. The simulation reflected the fluctuation in LE after rainfall, where the correlation coefficient is 0.765. Figure 8 shows that LE is very stable and remains constant near 0 W·m−2 during sunny, sand-dust, and cloudy days. After the precipitation process on June 23, the soil moisture evaporated rapidly after sunrise, which resulted in a large fluctuation of LE. The maximum latent heat flux was 365 W·m−2. To some extent, Noah could describe the process of increase and decline, but the overall effect was very poor, and it fails to reflect the recorded fluctuations of LE.

4.5. Soil Heat Flux
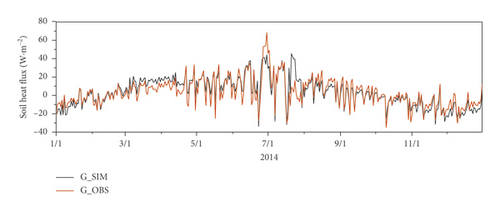
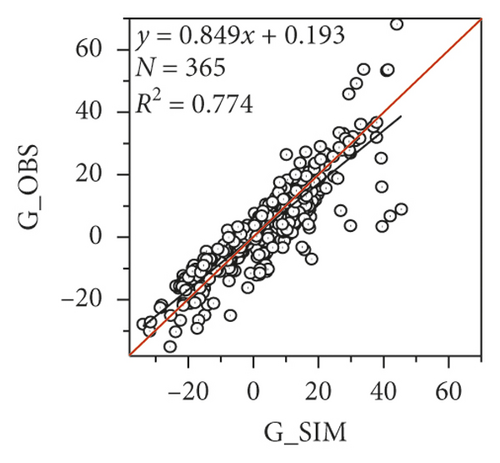
The soil heat flux G0 represents the solar radiation heat received by the land surface that is transferred to the subsoil. According to equation (4), the calculation of soil heat flux mainly depends on the surface temperature, the soil’s thermodynamic parameters, and the soil water content. Noah could simulate the interannual variation of the soil heat flux effectively (Figure 9), where the correlation is 0.774. Due to the several precipitation processes that occurred during summer, the fluctuation of G0 was violent. In the other seasons, the soil water content is stable relatively. The weather record illustrated there were gales, blowing sands, showers, and floating dust weather process in the Tazhong area during July 16 to 21; hence, the soil moisture in the surface layer evaporates rapidly after rainfall, and thus, heat was provided for evaporation, which leads to the decrease of ST which in turn also decreases G0 (e.g., equation (4)). From Figure 10, it can be seen that the model can effectively simulate the change of soil heat flux for sunny days, which is high in the nighttime and low in the afternoon. This is similar to the simulation of soil temperature. For sunny days, G0 mainly depends on the surface temperature. From 7 AM to 4 PM, the heat is conducted downward from the land surface to subsoil. Thus, G0 is positive. When it rains, the simulation effect is relatively poor, and the deviations from the observations are in the range of ±50 W·m−2. Here, the soil temperature is higher than the surface temperature, and the heat is conducted upward. Therefore, many negative values are produced. In sand-dust weather, the amount of received solar radiation is reduced due to dust, and as a result, the peak value of G0 is relatively low. In the afternoon, it is only 80 W·m−2. In cloudy weather, there is only a small increase in the simulated values of G0, and the overall simulation effect is the best.

4.6. Net Radiation
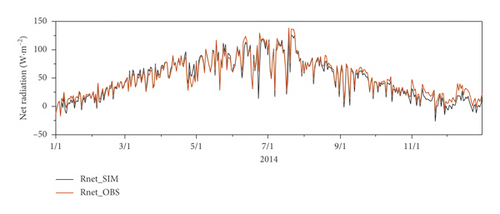
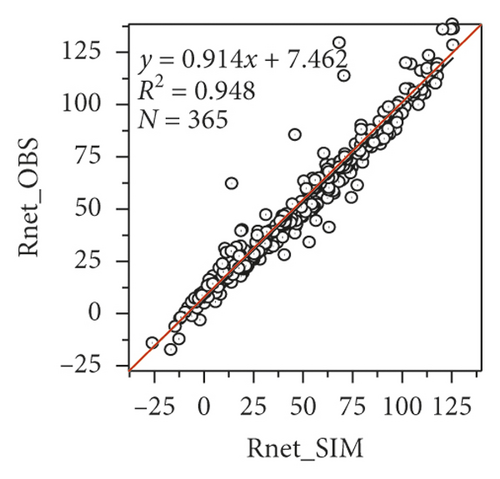
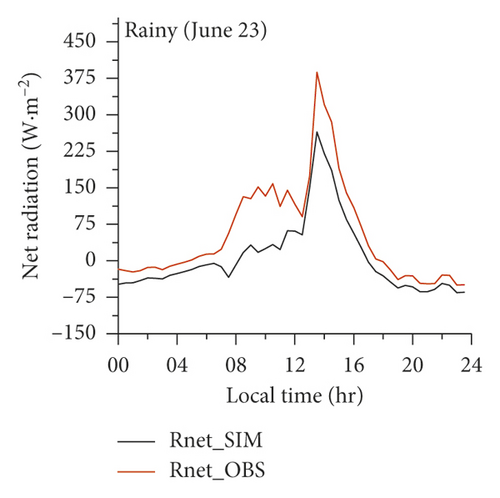
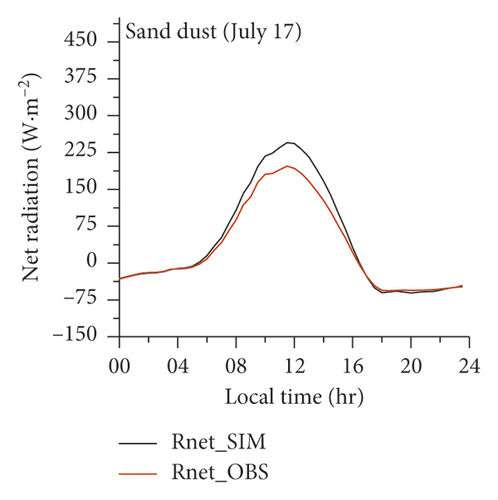
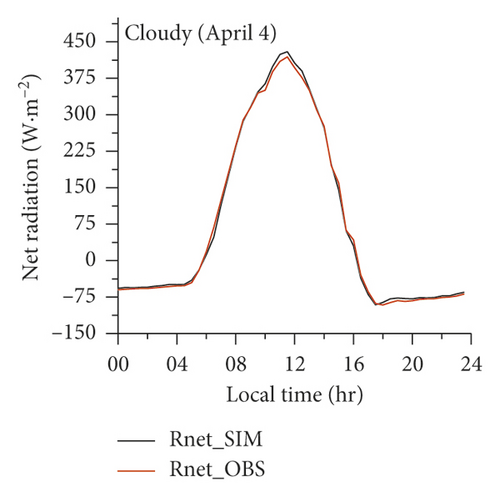
The surface net radiation Rnet is the total solar and atmosphere downward radiation absorbed by the surface. It plays an important role in weather/climate predictions, is an important index used to evaluate solar energy resources, and is mainly determined by the emissivity and albedo in the land model. From Figure 11, it can be seen that Noah can well simulate the measured change in Rnet for the entire year, where the correlation coefficient is 0.948. In summer, the land surface absorbs the most solar radiation energy, and it has the maximum amount of fluctuations of all seasons. The model has overestimated the amount of effective precipitation on June 23. Figure 12 shows that the simulation of Rnet is better in sunny days, albeit slightly high in the afternoon. During rainy days, from 1 PM to 5 PM, Rnet rises and declines rapidly, and the simulation was with corresponding reduction. During sand-dust weather, Rnet decreases generally. The simulation was in good agreement with the observation at nighttime but overestimated during the daytime. In the afternoon, it was about 55 W·m−2 higher. In cloudy weather, the simulation effect of Rnet is the best, and it was generally consistent with the observation.

4.7. Error Analysis
In order to evaluate the overall performance of Noah objectively, the simulations of RMSE, AMBE, R2, and NS in four types of weather processes were analyzed (Table 3); the simulation of soil temperature agreed with the observation during sunny days, where R2 is 0.973 and NS is 0.917. For sand-dust weather, the simulation of sensible heat fluxes was the best, where AMBE and RMSE were very small and R2 and NS were high. In cloudy weather, the soil heat flux and net radiation were simulated the best. For all four weather conditions, the simulations of soil moisture and latent heat flux were not a good fit, where their NS values were negative, which was unacceptable.
| Index | AMBE | RMSE | R2 | NS |
|---|---|---|---|---|
| Weather | Su, Ra, Cl, Sa | Su, Ra, Cl, Sa | Su, Ra, Cl, Sa | Su, Ra, Cl, Sa |
| ST | 1.462, 1.433, 1.712, 1.831 | 0.251, 0.228, 0.218, 0.313 | 0.973, 0.942, 0.970, 0.95 | 0.917, 0.717, 0.899, 0.859 |
| SM | 0.005, 0.122, 0.003, 0.004 | 0.008, 0.023, 0.004, 0.006 | 0.136, 0.335, 0.286, 0.10 | −0.455, –0.38, −0.62, –0.21 |
| H | 14.14, 17.22, 11.29, 12.87 | 2.989, 2.301, 2.152, 2.27 | 0.963, 0.761, 0.975, 0.946 | 0.952, 0.878, 0.936, 0.965 |
| LE | 1.334, 48.03, 0.964, 0.781 | 0.272, 11.53, 0.189, 0.16 | 0.071, 0.273, 0.028, 0.036 | −1.24, –0.036, −0.25, –1.56 |
| G0 | 17.55, 17.46, 10.06, 13.35 | 2.974, 3.042, 1.892, 2.135 | 0.995, 0.767, 0.991, 0.98 | 0.935, 0.895, 0.966, 0.975 |
| Rnet | 8.237, 45.36, 5.314, 14.22 | 1.734, 8.522, 0.974, 3.232 | 0.996, 0.916, 0.998, 0.99 | 0.935, 0.927, 0.968, 0.957 |
- Su: sunny day; Ra: rainy day; Cl: cloudy day; Sa: sandy day.
5. Discussion and Conclusions
- (1)
Noah could simulate the land-surface process in the Tazhong station well overall, and it could reflect the energy-exchange processes between the land surface and the atmosphere effectively. However, the simulations of moisture exchange and latent heat absorption and release were relatively poor; thus, Noah may not be able to properly simulate the water exchange process in the desert with extremely dry climate.
- (2)
For sunny days, the simulations of soil temperatures and sensible heat flux were underestimated at night but overestimated in the daytime.
- (3)
During cloudy weather, the simulations of soil heat flux and net radiation were the best. The solar radiation was mainly shortwave scattered radiation; it is indicated that when Noah calculates four-component radiation, the consideration of the weight matching of shortwave scattered radiation to different weather conditions was not perfect enough for deserts.
- (4)
For rainy days, the simulations of soil temperature, net radiation, sensible heat, and soil heat flux decreased significantly, but that of the latent heat flux increased. Additionally, the variation trend of soil moisture could be properly reproduced by the simulation. However, deviations in the simulated net radiation, sensible heat, and soil heat flux were large. The performance of Noah in simulating rainfall processes should be improved.
- (5)
In sand-dust weather, the energy of received solar radiation was obviously reduced, and the energy flux was reduced. However, Noah still produces good agreement with the observation.
Conflicts of Interest
The authors declare that they have no conflicts of interest.
Acknowledgments
This study was supported by the National Natural Science Foundation of China (Grant nos. 41801019 and 41875023) and Central Asia Atmospheric Science Research Fund of Xinjiang Meteorological Bureau (Grant nos. CAAS201811 and CASS201711).
Open Research
Data Availability
The simulation and observation data are available from the corresponding author upon request by e-mail.


