Entire Process Simulation of Corrosion due to the Ingress of Chloride Ions and CO2 in Concrete
Abstract
A comprehensive mathematical model which can simulate the entire corrosion process of reinforcement in concrete is proposed in this paper. The combined effect of carbonation and chloride ingress is also discussed in the mass transport module. Nonuniform corrosion distribution is employed for the study of mechanical damage in concrete. The link of ABAQUS with MATLAB is adopted for the numerical implementation of the developed model. The numerical results of an illustrative example indicate that the depassivation time of reinforcement, corrosion rate and expansion displacement, and cracking pattern of concrete all can be accurately predicted.
1. Introduction
Reinforced concrete (RC) structure is widely applied in the modern building construction area because of its advantages in structural stability. With the promotion of sustainable development strategy, great concern has been attached to the durability and longevity of reinforced concrete. Due to the alkaline environment of concrete, a spontaneous process called passivation can initiate. When the pH value ranges from 12 to 13 [1, 2], a protection oxide layer on the surface of steel reinforcement is gradually formed. This oxide layer can prevent the RC structure from corrosion. However, because concrete is a porous material, the protective layer can be damaged by the penetration of aggressive agents. In addition, through the air in pores, carbon dioxide can also diffuse in concrete. They both can reduce the service life and cause deterioration of the RC structure severely.
The main factors causing chloride-induced corrosion are the prevalent usage of deicing salt and marine moisture containing aggressive agents. And the carbonation process also appears in concrete because of the diffusion of carbon dioxide. In most cases, carbonation occurs with the chloride transfer process. According to experimental data, it was found that carbonation has obvious influence on chloride diffusion [3, 4]. Hence, the study on this combined durability is of great significance.
After the depassivation of steel reinforcement, a macrocell corrosion with a larger cathode area and smaller anode area is formed [5, 6]. The corrosion product of steel reinforcement will expand 3 to 6 times in volume [7, 8], which generates tensile stress on the inner surface of concrete. As a brittle material, the compressive stress of concrete is greater than that of tensile strength [9]. If the tensile stress of concrete is greater than the tensile strength, cracks are propagated and developed. When the cracks reach the concrete cover, more aggressive agents including oxygen, carbon dioxide, and moisture will penetrate into the RC structure, which accelerates the corrosion process [9–11].
Spalling and deterioration caused by the expansive cracks have significant damage on the mechanical performance of the RC structure. Because cracks can reduce the confinement between concrete and rebars the bond behavior of the RC structure declines drastically [12]. The carrying capacity of the RC structure is also impaired by the corrosion-induced reduction of cross-sectional area of the steel reinforcement [9, 12–15]. Therefore, the research studies on the corrosion rate, corrosion product distribution, and cracks pattern are attached to the utmost importance. An accurate model is needed to predict the service life and durability.
Many scholars studied the corrosion process and mechanical damage in the RC structure. For simplicity, these works all assume that the corrosion products are uniformly distributed [1, 16, 17]. However, that case is only suitable for the laboratory condition, in which the external current is attached to accelerate the corrosion process [9, 13, 18, 19]. According to actual observations, it was found that most of the corrosion distribution patterns are nonuniform [15, 20]. In terms of calculation results, recent studies have verified that errors of uniform distribution cannot be neglected [21]. The service life and bearing capacity are overestimated in evenly distributed models [14, 22]. Hence, those uniform distribution models are very limited.
Additionally, numerous scholars regarded the corrosion-induced expansive displacement as the swelling displacement of the concrete layer [1, 22–27], which is applied to the mechanical part directly. However, this method is incompatible with the actual cases. Note that Young’s modulus of concrete is approximately 30 GPa, while Young’s modulus of rust merely varies from 60 MPa to 100 MPa which is far smaller than that of concrete. Therefore, the deformation of rust layers increases dramatically with the rise of compression stress of the concrete cover. As a consequence, the expansive displacement and displacement of concrete should be considered independently [21]. Furthermore, there are few comprehensive models depicting the whole process from corrosion initiation to cracks reaching the concrete cover. Establishing a simplified full-scale model is attached to great importance.
In this paper, a comprehensive model for the entire process of corrosion-induced concrete deterioration is proposed. After this introduction, the transport of various harmful masses and the determination of depassivation time are described in Section 2. Then, Section 3 presents the process of the electrochemical reaction and mechanical damage. Experimental verification is presented in Section 4. Numerical implementation and an illustrative example are provided in Section 5. The conclusion is given in Section 6.
2. Transport of Various Harmful Masses
2. 1. Process of Carbon Dioxide Diffusion and Carbonation
2.2. Chloride Penetration considering the Effect of Carbonation
2.3. Transport of Moisture
2.4. Corrosion Initiation
3. Mechanical Damage Process
3.1. Formula of Corrosion Rate on Steel Reinforcement
There are various models of the steel corrosion rate, most of which do not consider the change of the corrosion rate after the concrete cover is cracked. In this article, a comprehensive forecast model mentioned in literature [37] is employed. It proposes methods to determine the parameters and simplify equations. It also takes full account of the change of the corrosion rate before and after cracking of the concrete surface.
Literature [40] shows that the corrosion rate of steel reinforcement first decreases. Then, the corrosion rate reaches a steady state before cracking of the concrete surface. After the cracking of the concrete cover, the corrosion rate first increases rapidly and then reaches a stationary state.
In order to simplify the formula, based on the experimental results, the corrosion rate when the crack width is 0.2 mm is adopted. It is regarded as the average corrosion rate after the cracking of the concrete surface. In the analysis of rust swelling and cracking, we assume that when the crack width reaches 0.2 mm, the crack will completely penetrate through the concrete cover. When the crack width reaches 0.8 mm, the concrete cover will be completely destroyed [40].
In real cases, the temperature Tc and humidity Hw vary with time, so the current density I0 is related to the time t. In order to simplify the calculation, the mean value of temperature and humidity is taken in this paper, and the change of time is not considered. So the current density is independent of time.
3.2. Formula of Corrosion Expanding Displacement
Currently, there are mainly three models depicting corrosion distribution on the cross-sectional area, namely, the linearly decreased model [43], ellipse model [44, 45], and Gaussian model [22, 46], respectively. According to experimental data, the ellipse model and Gaussian model have relatively higher correspondence with the corrosion distribution pattern in real cases.
Exponential formula and elliptical formula depicting the corrosion distribution pattern are given in literature [47, 48]. By comparison, there are no distinct differences between experimental results and these two models. Here, given difficulties in determining variables and integral calculation of the exponential formula, the ellipse model is employed in this article.
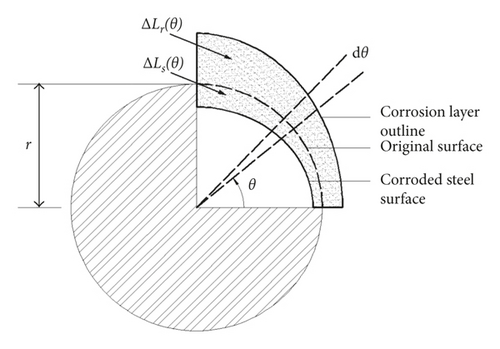
As for the corner rebars, Zhao et al. presumed that it can be derived by deflecting the corrosion displacement model of central rebars. By experimental results comparison, when there is little difference between concrete cover thicknesses of the two directions, this model can simulate the corrosion distribution pattern of corner rebars with little errors. When the cover of the side direction is far thicker than that of the forward direction, this model tends to be irrational with lots of errors, which cannot be applied. Therefore, when corrosion occurs on the side near the concrete cover, the corrosion expansive displacement can be calculated by superimposing displacements at different angles. Then, the corrosion expansive displacement is obtained.
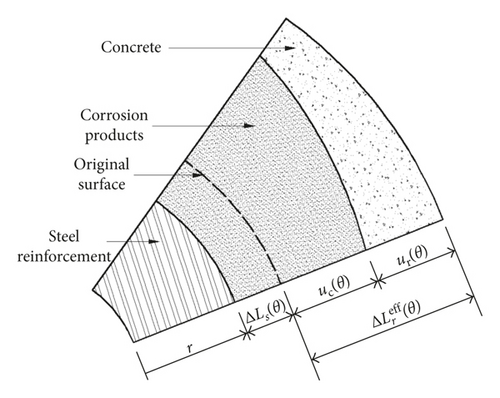
According to previous studies, corrosion products can diffuse in concrete internal void and the interface between reinforcement and concrete. Hence, when corrosion thickness is less than a certain constant δ0, there is no expansive pressure on the concrete cover. In the calculation, we adopt δ0 as 20 μm [50], and equals 0 when ΔLr(θ) is less than δ0.
3.3. Definition of Concrete Cracking and Initial Cracks Setting
After obtaining the radial displacement of the concrete layer, the development of cracks in concrete can be predicted by the fictitious crack model in expanding finite element method (XFEM). Here, the material is supposed to be linear elastic. Once the maximum tensile stress reaches the tensile strength of concrete, ft, cracks initiate and develop. The crack expansion is always perpendicular to the maximum tensile stress direction.
Note that there is a virtual fracture area behind the tip of the crack. In this area, the stress of the surface area is not 0, whereas the stress is a function monotonically decreasing with the crack opening displacement. This is called material softening. The softening curve of the concrete material is controlled by its fracture energy Gf. When the crack opening displacement reaches a threshold, the stress of the surface area decreases to 0. Therefore, this point is the tip of the crack in real cases, so the crack surface behind this point is called free surface.
In the XFEM model, initial cracks need to be set in advance. Then, the development of cracks can be simulated more accurately. In our model, 8 initial cracks are set uniformly along the interaction surface between the steel reinforcement and the concrete. After the beginning of calculation, 2 or 3 fastest-developed main cracks are selected, and they can develop freely. Then, under the element birth and death control, the initial cracks are closed when the changes are not obvious, for the sake of simplicity.
4. Experimental Verification
4.1. Verification of the Influence of Carbonation on the Chloride Penetration
Based on the numerical model established by the theoretical model mentioned above, the transfer process of chloride in fully carbonized concrete can be stimulated. In most cases, the chloride transfer process and carbonation alternate. This more complicated situation can also be stimulated precisely. In the alternate experiment of carbonation and chloride penetration, concrete specimens are placed in an accelerated carbonation tank and the chloride tank alternately. Hence, the transfer process of chloride ions with carbonation can be determined. Because the alternate experiment is very close to the actual use of the RC structure, we employ alternate experiment testing data for the verification.
In literature [28], the influence of carbonation on the chloride transport properties in ordinary Portland concrete and fly ash concrete was tested, respectively. Concrete specimens were immersed in 5% NaCl solution for one week at the temperature of 25°C. In the next week, they are placed in an accelerated carbonation tank. In the carbonation tank, the temperature is 25°C, and humidity is 60%, and carbon dioxide content is 10%. A 56-week circulation is adopted.
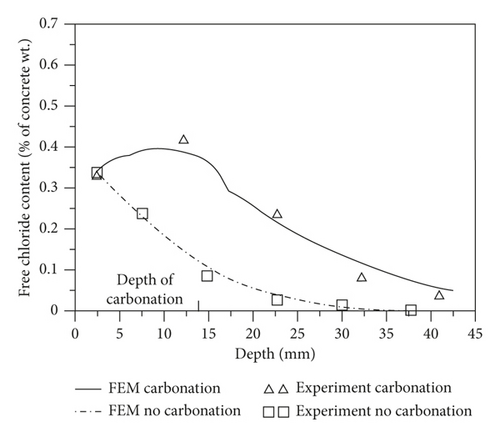
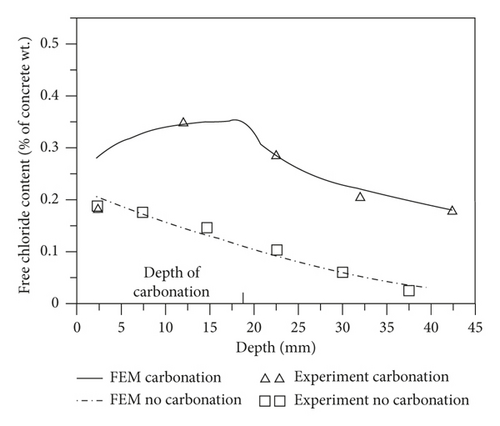
As for the coupled effect of carbonation and chloride ions, the comparison of results obtained by the experiment and numerical model is shown in Figure 3. It is obvious that carbonation accelerates the chloride ions transfer rate significantly, and the chloride ions content is increased. Besides, the reaction between carbon dioxide and Friedel salt can cause the free chloride ions release effect. It can lead to an obvious jump of free chloride ions content at the edge of carbonation front (the interface between carbonized area and noncarbonized area). Because there is no enough time for the released free chloride ions to spread to two sides increasingly more free chloride ions accumulate at the reaction area. This phenomenon was precisely depicted by our numerical model. The numerical results agree well with the test results. Consequently, it shows good accuracy of the coupled mathematical model of carbonation and chloride ion penetration possesses.
4.2. Verification of the Mechanical Damage Model
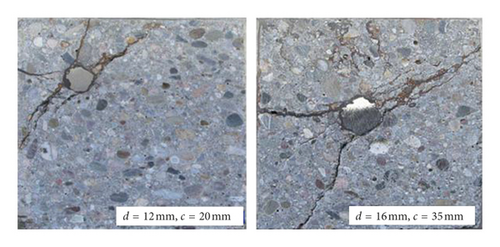
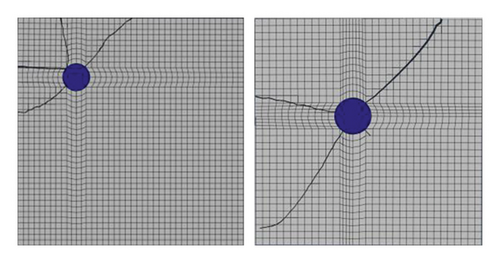
Here, to determine the accuracy of the mechanical damage model, we compare the results of the numerical model and the experiment conducted in literature [51]. In the experiment, the cross section of specimens is 200 × 200 mm2. In the first case, there is a steel reinforcement of 12 mm diameter with a 20 mm concrete cover; in the second case, there is a steel reinforcement of 16 mm with a 35 mm concrete cover. The embedment length of rebars is 180 mm, while the rest part is protected by a plastic sleeve. In two cases, each longitudinal side is saturated by 1% chloride solution for 1 minute and 3 minutes, respectively. Additionally, there is a potential of +500 mV NHE to accelerate the corrosion process. As shown in Figure 4, it can be found that results derived from our proposed model agree extremely well with the experiment results.
5. Illustrative Example
5.1. Problem Description and Procedure of Numerical Implementation
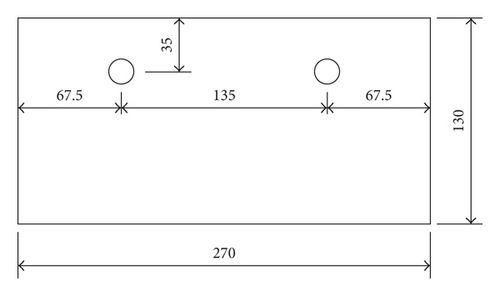
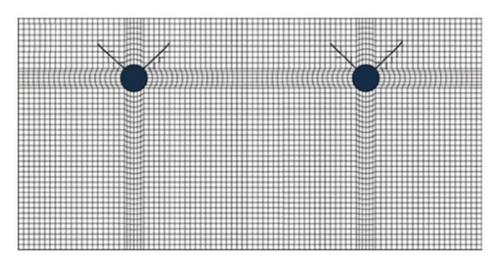
Here, a steel-reinforced concrete beam is used for the parametric study. The thickness of the concrete cover is 27 mm, the diameter of rebars is 16 mm, and the space between each steel reinforcement is 135 mm. Its cross section is shown in Figure 5. There is confinement on the Y direction on the lower boundary of the beam. The left and right sides are confined on the X direction. Parameters used in the numerical example are listed in Table 1.
| Parameter | Value |
|---|---|
| Elastic modulus of concrete, Ec (Pa) | 3.25 × 10¹⁰ |
| Poisson’s ratio of concrete, vc | 0.20 |
| Elastic modulus of corrosion products, Er (Pa) | 100 × 106 |
| Poisson’s ratio of corrosion products, vr | 0.49 |
| Density of steel, ρs (kg·m−3) | 7800 |
| Water-cement ratio, W/C | 0.35 |
| Environment temperature, Tc (°C) | 5 |
| Environment humidity, Hw | 0.9 (0.75) |
| Water content of concrete, PS (%) | 35 |
| Chloride content, Cfc (%) | 0.2 |
| Fracture energy, (G/J·m−2) | 140 |
| Concrete tensile strength, ft (N·m−2) | 1.71 × 10⁶ |
- (1)
If we assume a time period t, based on the MATLAB and theoretical formulae, we can calculate the corrosion expansive displacement distribution at t moment. Then, the rust expansion displacement is discretized into 24 points along the circumferential direction of the steel bar. Each point is applied on the surface of rebars.
- (2)
With the application of XFEM of ABAQUS, we simulate the crack development under corrosion expansive displacement. In addition, the calculation of the crack width can be achieved. Therefore, we can determine time steps when the crack width reaches 0.2 mm and 0.8 mm, respectively.
- (3)
According to the linear relationship between corrosion amount and time, we can determine the corrosion expansive displacement at each time step.
- (4)
Based on MATLAB, the corresponding time of rust expansion displacement distribution can be deduced by the theoretical formula, which is the approximant value of t1 (t2).
- (5)
Repeating step (1)–step (4), we can get the more accurate value of t1 and t2.
5.2. Radial Displacement Curve of Concrete under Corrosion Expansion Pressure
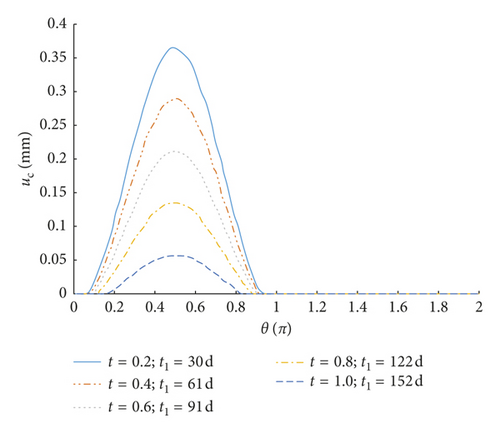
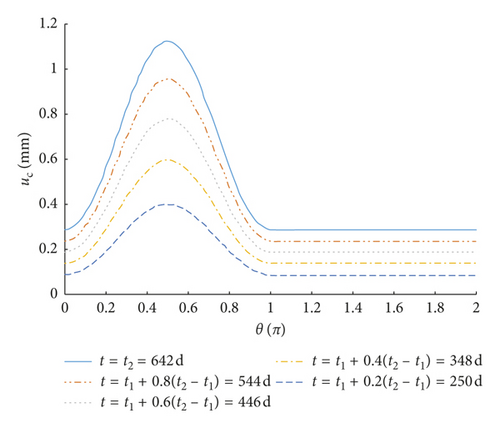
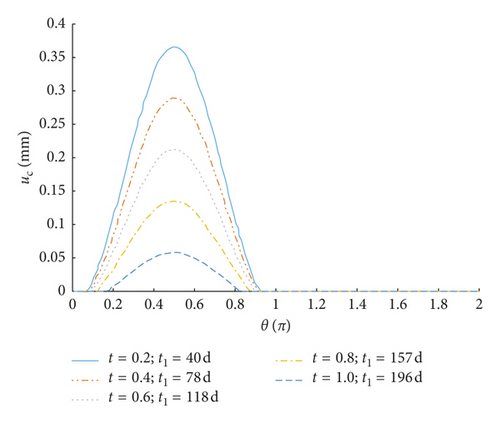
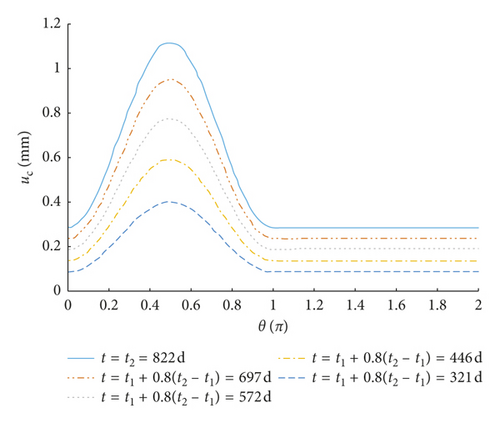
Figures 6 and 7 show the radial displacement of concrete uc(θ) under corrosion expansive pressure at different time periods, when the environmental relative humidity is 90% and 75%, respectively. According to Figures 6(a) and 6(b), the corrosion before the cracking of the concrete surface mainly distributes on the half surface facing the side of the protective layer. The thickness of the corrosion layer turns smaller when it is farther from the concrete surface. Note that there is no corrosion on the half cross section which is far away from the protective layer. On the contrary, situation after cracks penetrating the concrete cover is completely different. Although less than the corrosion product on the surface close to the protective layer, corrosion appears on the surface far away from the protective layer. Additionally, under the same corrosion expansive pressure, when the structure is in high humidity, it takes less time to reach the same radial displacement of concrete. It suggests that high humidity environment contributes a lot to the corrosion process.
5.3. Crack Development under Nonuniform Corrosion Expanding Pressure
Having determined the distribution curve of radial displacement of concrete uc(θ) along the circumferential direction of steel reinforcement, we input them as displacement load into the XFEM model of ABAQUS. Then, crack development of the concrete cover is obtained. It is more explicit and intuitional for researchers to study and analyze crack development.
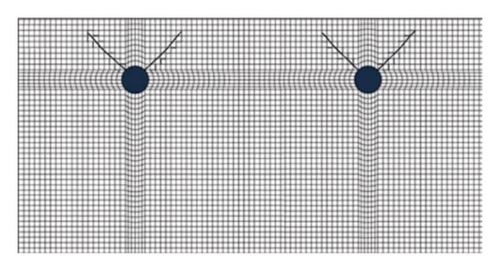
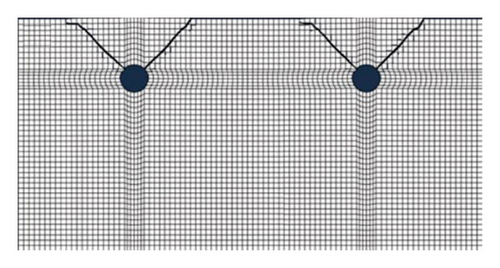
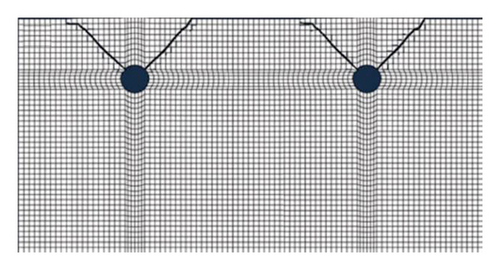
Under the assumption that the environmental relative humidity is 90%, we analyze the crack development changing with time, as shown in Figure 5. Through calculation, when the corrosion expansive displacement of rebars uc(θ) reaches what is shown in Figure 6(a) (the maximum of displacement is 0.365 mm), the surface of concrete is cracked (the crack width reaches 0.2 mm), and t1 is 152 d. When the corrosion expansive displacement of rebars reaches Figure 6(b) (the maximum of displacement is 1.130 mm), the concrete cover is completely deteriorated (the crack width reaches 0.8 mm), and t2 is 642 d. Development of corrosion-induced cracks is shown in Figure 8. It demonstrates that the concrete cover is cracked by corrosion-induced cracks after 5 months since the depassivation process. With the development of cracks, the concrete cover will be completely destroyed 16 months later. Consequently, as for the structure mentioned in this paper, anticorrosion methods and strengthening measures are required within 16 months when the cracks are discovered on the concrete cover.
5.4. Comparison of Crack Development under Uniform and Nonuniform Corrosion Process
Numerous studies have verified that the corrosion product distribution is nonuniform in actual cases. As mentioned previously, most researches focusing on crack development of concrete are based on the uniform pattern. Therefore, it has been attached to the utmost significance to compare differences in crack pattern, initiation process, and cracking time. We analyze the structure shown in Figure 5 on the basis of the uniform distribution model, and the crack expanding process is shown in Figure 9.
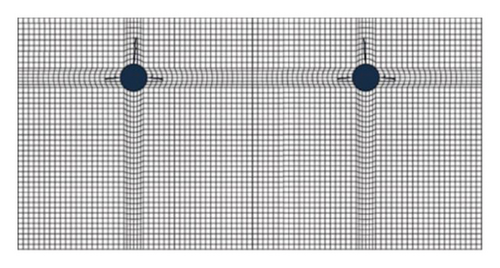
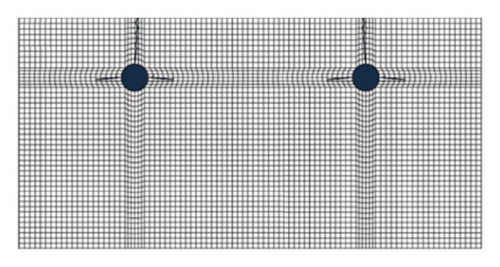
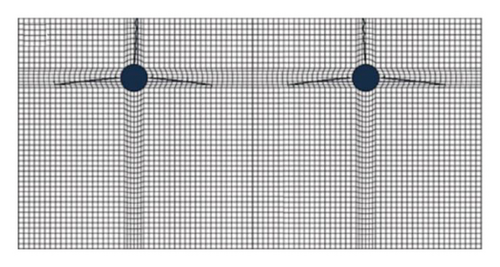
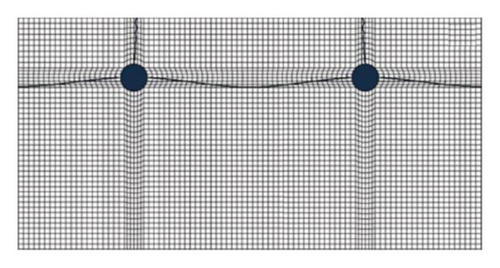
Comparing the crack development figures of uniform corrosion distribution and nonuniform corrosion distribution, respectively, we can find distinct differences in terms of the crack pattern. The cracking process of the uniform corrosion pattern is obviously slower than that of nonuniform corrosion pattern. Under uniform distribution, it takes 19 months for cracks to penetrate the concrete cover under the uniform corrosion pattern. Then, it takes 46 months to entirely destroy the concrete layer. Therefore, if employing uniform distribution pattern in the actual cases, the load capacity and service-life of structures will be severely overestimated, which can lead to undesirable consequences.
6. Conclusion
- (1)
The transport of various harmful masses is described by a series of mathematical formulae, including chloride ions, carbon dioxide, and moisture. The combined effect of carbonation and chloride ingress is also studied.
- (2)
The expansive displacement of concrete at different time periods of corrosion can be obtained directly by our proposed mathematical model.
- (3)
By linking ABAQUS with MATLAB, the prediction for the evolution of corrosion-induced cracking damage for the concrete cover can be numerically implemented.
- (4)
Various experimental data were compared with the results obtained by our model and verified its accuracy.
- (5)
The numerical results of an illustrative example show that there are significant differences in the crack pattern and crack development between the uniform and nonuniform corrosion. If the uniform distribution theory is used to guide actual projects, the carrying capacity of the structure will be seriously overestimated.
Conflicts of Interest
The authors declare that they have no conflicts of interest.
Acknowledgments
This work was financially supported by the Natural Science Foundation of Shandong Province (no. ZR2018BEE044) and the National Natural Science Foundation of China (nos. 51678208 and 51678199). The authors also appreciate the support of the Major Training Program of Natural Science Research Innovation Foundation of Harbin Institute of Technology (HIT.NSRIF.201709) and the Major Program of Mutual Foundation of Weihai City with Harbin Institute of Technology (Weihai).
Open Research
Data Availability
The datasets generated during and/or analyzed during the current study are available from the corresponding author on reasonable request.


