A Novel Technique for Predicting the Thermal Behavior of Stratospheric Balloon
Abstract
This paper is devoted to introduce a novel method of the operational matrix of integration for Legendre wavelets in order to predict the thermal behavior of stratospheric balloons on float at high altitude in the stratosphere. Radiative and convective heat transfer models are also developed to calculate absorption and emission heat of the balloon film and lifting gas within the balloon. Thermal equilibrium equations (TEE) for the balloon system at daytime and nighttime are shown to predict the thermal behavior of stratospheric balloons. The properties of Legendre wavelets are used to reduce the TEE to a nonlinear system of algebraic equations which is solved by using a suitable numerical method. The approximations of the thermal behavior of the balloon film and lifting gas within the balloon are derived. The diurnal variations of the film and lifting gas temperature at float conditions are investigated, and the efficiency of the proposed method is also confirmed.
1. Introduction
Stratospheric balloons or airships have been paid attention since they can provide persistent observation platforms by keeping on station at an altitude about 20~30 km for a long time. They have some potential advantages, such as station keeping, long endurance, low cost, broadcasting, and telecommunication relay [1–3]. When the balloons stay at an altitude about 20~30 km, they should be filled with a huge gas volume of several hundred thousand cubic meters. Even a small temperature variation between the inner gas and the outer environment can lead to a huge buoyancy difference. So the thermal behavior of the stratospheric balloon should have attracted some interest from all over the world [4, 5].
It is important to predict the thermal behavior of the stratospheric balloon before it launches. Understanding the temperature variation of the stratospheric balloon will be helpful for balloon design and flight prediction. During the research of the thermal behavior of the stratospheric balloon, the average film and lifting gas temperature are the main focus. Carlson et al. [6] studied the trajectory and thermal behavior of the high-altitude balloons. Stefan [5] used a two-node model to solve the day-night airship temperature numerically. Farley [7] established a code to calculate the ascent and float thermal behavior of the stratospheric balloon. Dai et al. [8] developed a simulation program to investigate the thermal performance of a super pressure balloon by using the thermal models and dynamic models. Yao et al. [9] proposed a multinode heat transient model for stratospheric airships to predict the thermal behaviors of the ascent and descent processes. In these articles, the thermal models are established for different conditions. The thermal performance of the film and lifting gas can be obtained by solving TEE. The main method to solve these equations is discrete collocation method. The computation efficiency is low when the number of surface elements of film are very large.
In this paper, we adopt the thermal models given by Xia et al. [10] and present a novel technique to solve the TEE. The thermal performance of the film and lifting gas will be got by applying the method to solve the TEE. The method is based on Legendre wavelet integration operational matrix method. In the proposed method, the TEE is reduced to a system of nonlinear algebraic equations, which can be solved easily. The proposed method is of high computing efficiency and simple operation.
2. Thermal Model
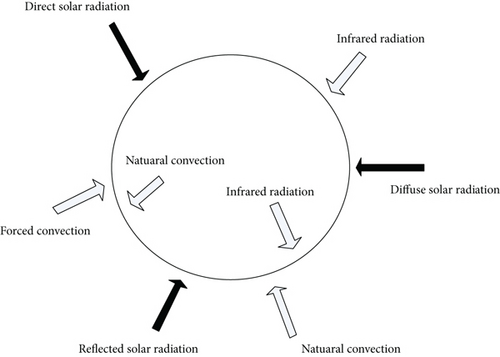
In this section, the same thermal environment and assumptions of the stratospheric balloon shown in [11, 12] will be considered. The thermal environment (shown in Figure 1) of the high-altitude stratospheric balloon includes infrared radiation, solar radiation, and convection. The balloon film is so thin that the conductive resistance can be neglected.
2.1. Atmosphere Model
2.2. Solar Position and Solar Radiation Models
Before we introduce the solar radiation models, the computational method of solar position should be given as follows.
2.3. Convective Heat Transfer Coefficient Models
3. Legendre Wavelets and Their Properties
To illustrate the effectiveness of (23), we have shown the theorem as follows.
Theorem 1. Suppose that the function obtained by using Legendre wavelets is the approximation of T(t) and T(t) is with bounded second derivative, say ; then the series converges uniformly to the function T(t); that is,
Proof. See [20].
The integrations of the function et and sint are selected to verify the effectiveness of matrix P. The integrations of et and sint are obtained as follows and . Take , the results are shown in Figure 2 and Figure 3, respectively.
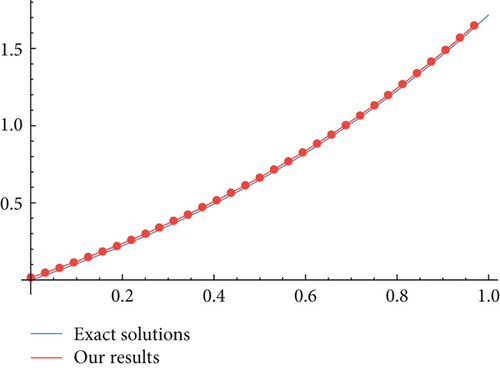
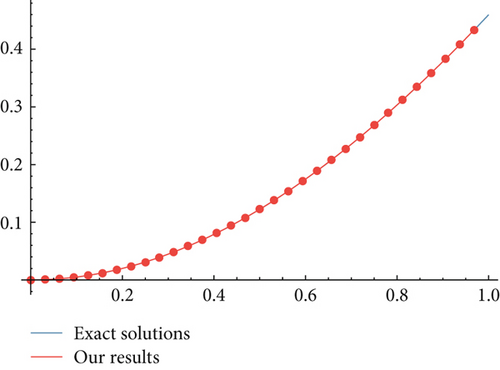
From Figure 2 and Figure 3, we can find that the matrix P is very credible to calculate the integration of any functions.
4. Solution Procedure for TEE (1) and (4)
- (1)
Let , then , .
- (2)
Express on and in the following form:
(34)(35)where and are unknown vector and is the vector which is defined in (25). By using initial conditions and integrating (34) and (35), we have(36) - (3)
Expand the initial T(0) and Tg(0) by wavelets as follows:
(37) -
Since , from (36) to (37) we have
(38)(39)which can be written as(40)(41) - (4)
Let and ; then we have
(42)(43) -
By using the disjointness of Block pulse functions, we get [21]
(44) - (5)
Substituting (34), (38), (40), and (44) into (1), we obtain
(45)where . -
Using and (42), we have
(46)
The nonlinear system (47) can be solved by applying the Newton iteration method. Therefore, T(t) as the solution of (1) is given by .
Solving this system, we can obtain the approximation of (4).
5. Error Analysis
To show the effectiveness of ∂T/∂t ≈ CTΨ(t), we discuss error analysis of Legendre wavelets. Let ∂Tk,M(t)/∂t be the approximation of ∂T(t)/∂t, . Then, .
Theorem 2. Suppose that the function ∂Tk,M(t)/∂t obtained by using Legendre wavelets are the approximation of ∂T(t)/∂t, and ∂T(t)/∂t is with bounded second derivative; then one has the following estimation.
Proof. Let ∂T(t)/∂t be a function in the interval [0, 1] such that
where K is a positive constant.
From Theorem 2, we can find that when M is fixed and k → +∞.
6. Numerical Implementation of Legendre Wavelet Method for Solving TEE
In order to show the validation of the proposed method, the same stratospheric balloon model [10] at float condition is selected. A spherical balloon with radius R = 20 m is shown in Figure 4. The film of the balloon is divided into 3018 elements by the software ANSYS 14.0. Other parameters in this part are for εex = εin = αex = αin = 0.53, αs = 0.12, and ρe = 0.35. The surface density is 150 g/m2, and the specific heat is 1500 J/(kg·K). The lifting gas is helium and the wind speed is 10 m/s. The floating altitude is 20 km. The floating latitude and longitude are 40 degrees and 120 degrees, respectively. The balloon was launched during daytime on Spring Equinox 2010.
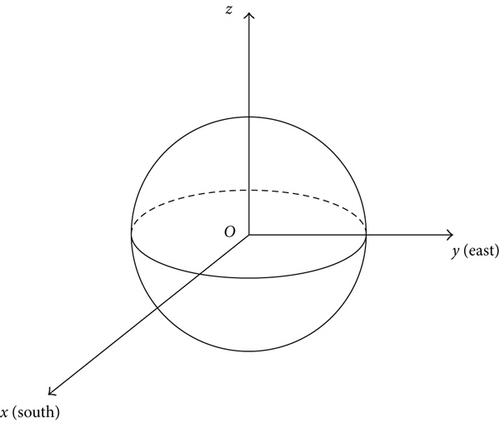
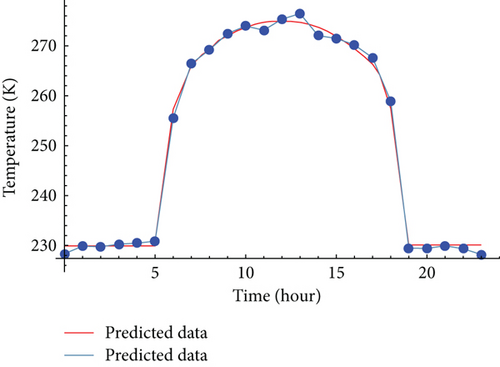
Figure 5 shows the day-night variation of the film element temperature for and compares it with the measured data. The degree of the Legendre polynomials is 3. From Figure 5, we can see that the predicted data obtained by our method are in good agreement with measured data [23], which indicates the validation to simulate thermal behavior of the balloon. Due to the solar irradiation, the actual balloon temperature begins to increase before sunrise and after sunset it continues to decrease. The maximum and minimum temperatures are 274 K and 229 K. The variation of the actual balloon temperature is as high as 45 K.
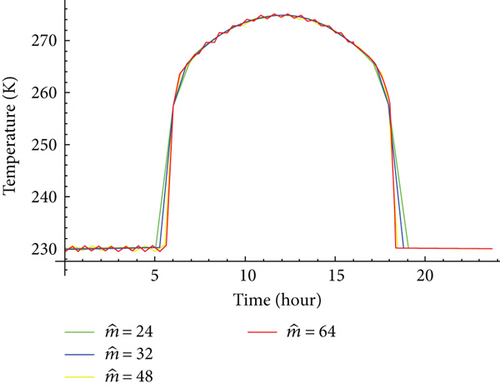
The predicted data of the temperature day-night variation for are shown in Figure 6. From Figure 6, we can conclude that the temperature of the film varies nonlinearly with time. The reason for this variation is that the solar irradiation appeared at 6 o’clock and vanished at 18 o’clock.
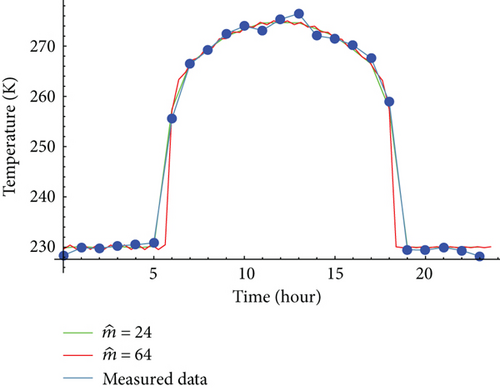
The comparison between the predicted data for and the measured data is displayed in Figure 7. Table 1 reveals the CPU time on examples 1–4 for different . From Table 1, it is seen that the CPU time on examples 1–4 are less than 1 minute, which implies high efficiency for the method. It can be seen from Figure 7 that the proposed method can predict the thermal behavior of stratospheric balloon effectively, and the simulated results are more credible with increasing. Table 1 reveals the CPU time on simulation for different . From Table 1, it is seen that the CPU time are less than 20 seconds, which implies high efficiency for the method.
| CPU time | |
|---|---|
|
|
15.881 |
|
|
18.254 |
Figure 8 shows the comparison of day-night variation of helium temperature obtained by our proposed method and Xia et al.’s [10] method, respectively. From Figure 8, we may find that the maximum and minimum helium temperatures are 262.2 K and 229.1 K, respectively. We can also see that the calculated results are close to Xia et al.’s results by taking a closer look at Figure 8. The effectiveness of the proposed method is demonstrated by the coincidence.
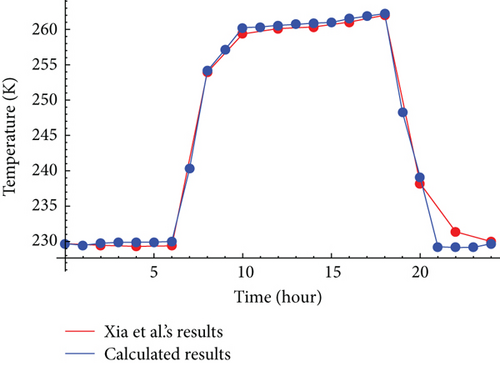
Comparing Xia et al.’s results with ours, there exist some divergences in Figure 8. These are mainly due to the influence of computational errors by using (51). The errors consist of two parts: one is the approximation of the film’s area and the other is the inverse of matrices product. The difference, on the other hand, comes from the number of comparisons.
In summary, the main characteristics of the wavelet-based approach which leads to a sparse matrix are (1) the vanishing moments property and (2) having a small interval of support. In fact, the sparseness of the system coefficient and good adaptation in dealing with continuous functions are good advantages of using Legendre wavelets, as shown by numerical example. What is more, the approximate explicit expressions of the temperatures of lifting gas and balloon film are obtained generally, which can calculate the temperatures at any time.
7. Conclusion
In the proposed method, we used the properties of the Legendre wavelets to reduce TEE to solve a system of algebraic equations. The temperatures of lifting gas and balloon film will be got by solving the linear and nonlinear system of algebraic equations. The solution is expressed as a truncated Legendre wavelet series and so it can be easily evaluated for arbitrary values of time using any computer program. From the illustrative example, we can conclude that using this approach obtains very satisfactory results. To illustrate the validity and the great potential of the technique, comparisons are made between the predictions obtained by ours and results obtained in previous literature. The proposed method is not only simple but also practical.
Conflicts of Interest
The authors declare that they have no conflict of interest.


