Evaluation of Residual Stress on Steel Parts Welded and Milled
Abstract
Welded parts are common in mechanical engineering. As all manufactured parts, they also present residual stresses introduced by the corresponding manufacturing process. Residual stresses can be beneficial or not because they can increase or reduce the useful life of the mechanical components, particularly when they are subjected to a cyclic stress in which they can fail by fatigue. In this study, SAE 1045 steel samples were welded by metal inert gas process, varying the speed and welding current. The welded samples were thereafter milled, including the welded region. Residual stresses on material as received, welded, and welded and subsequently milled were evaluated through the microhardness method. A factorial statistical design was used, and the results were studied by analysis of variance. It can be concluded that, in general, welding introduces compressive residual stresses which are improved by posterior milling operation, and there is an optimal set of operating parameters for this condition.
1. Introduction
Currently, it is necessary to understand and control the manufacturing processes and manufactured products to achieve higher efficiency and production quality as well as low-cost operations. The gas metal arc welding (GMAW) is a procedure considered as advantageous when compared to other welding processes due to production capacity, applicability, and the automation possibilities. Several parameters can influence a weld, which make adjustment procedure difficult [1, 2]. Among them, welding electric current, the polarity of the arc, the composition and the diameter of the electrode, shielding gas, and welding speed are the main parameters [3].
Welding current is very important in the process and must be adequate to the wire speed feed [4]. Welding current is set up from information about the material to be welded, the electrode type and its diameter, and the protection gas. Another important parameter is welding speed. A common strategy is to increase welding current as welding speed is increased, normally in a proportional way. If the welding current or welding speed is above a critical value, a defect named humping occurs. In this case, the welding current combined with welding speed represents the upper limit to design, that is, the upper limit of welding current and welding speed combination in parameter optimization design [5]. When mechanical and thermal processes are realized, residual stresses can be generated. In welding, tensile residual stresses occur as result of the high heat input, which reduce fatigue strength [6]. Residual stress is induced by machining processes and, depending on its magnitude and sign, can be very detrimental to mechanical parts when they are in service [7]. Several studies are being realized to diagnose the type and nature of these stresses originated from machining [8–10].
Residual stress can be evaluated using indentation tests. This method compares the surface hardness of a material before and after manufacturing process. If the hardness is higher than the hardness of the material after processing, it indicates that a compressive residual stress is present on its surface. If lesser, then tensile residual stresses are present [11–13]. In this study, a milled operation is done after a gas metal arc welded, to increase the surface finishing of the welded part. Then, residual stress is evaluated before and after processes to recommend or not these combined operations.
2. Materials and Methods
The experiment was done using a randomized factorial design. The influence variables were welding current, welding speed, the regions of the part, and two process conditions: parts only welded and parts welded and subsequently milled. The response variable was the microhardness, associated with residual stress. Welding was done in plates of 100 × 100 × 3.2 mm of SAE 1045 steel.
The plates were wet grinded and cut into two parts with a closed joint. An AWS ER-70S-6 electrode with a diameter of 0.8 mm was used. Protection gas used was constituted of 80% of argon and 20% of CO2. This gas mixture was used as recommended by Moyer [14] and Suban and Tusek [15] to increase productivity and hardness of the bead weld.
After tests, three levels were chosen for welding current: I1 = 140 A, I2 = 160 A, and I3 = 176 A.
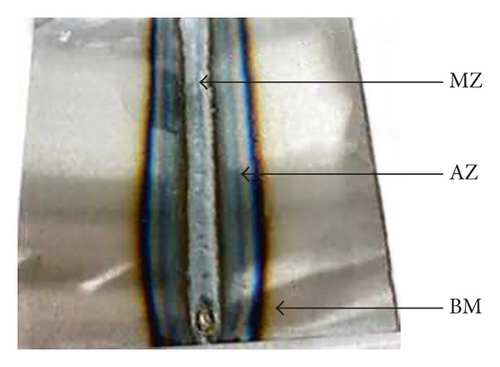
Three weld speeds were adopted: V1 = 4.5, V2 = 5.4, and V3 = 6.4 (mm/s). Three regions were observed in the welded part, as can be seen in Figure 1: (MZ) metal zone, (AZ) affected zone, and (BM) base material.
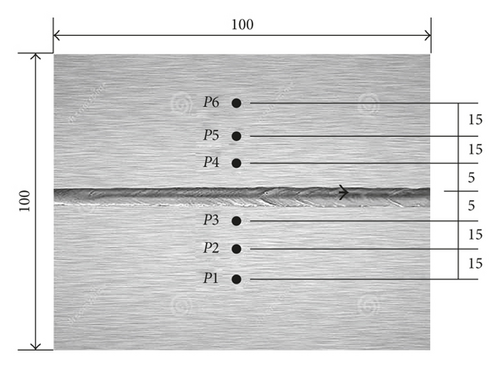
A group of welded parts were milled to evaluate the residual stress in this condition to be compared with simple welded part. The parameters used in milling were depth of cut (d) = 0.3 mm, cutting speed (Sc) = 250 m/min, and feed rate (f) = 100 mm/min. The mill used was a tool with 2 teeth. Microhardness Vickers test was done using a load of 5 N in 20 s. Six points (P1, P2, P3, P4, P5, and P6), three in each side of the bead weld, were fixed to measure the microhardness, as shown in Figure 2.
3. Results and Discussion
An indentation test was done in the material as received to be compared with the parts welded and parts welded and milled. The results are shown in Table 1.
| P1 | P2 | P3 | P4 | P5 | P6 | |
|---|---|---|---|---|---|---|
| Replica 1 | 238 | 242 | 240 | 240 | 242 | 238 |
| Replica 2 | 239 | 243 | 241 | 240 | 242 | 239 |
| Replica 3 | 240 | 242 | 240 | 241 | 243 | 240 |
In Table 2, the results of Microhardness Vickers obtained from parts welded and from parts welded and milled are shown. In Table 2, V1 = 4.5 m/min, V2 = 5.4 m/min, V3 = 6.4 m/min, I1 = 140 A, I2 = 160 A, and I3 = 176 A.
| Parts welded | ||||||||||||||||||
|---|---|---|---|---|---|---|---|---|---|---|---|---|---|---|---|---|---|---|
| I1 | I2 | I3 | ||||||||||||||||
| P1 | P2 | P3 | P4 | P5 | P6 | P1 | P2 | P3 | P4 | P5 | P6 | P1 | P2 | P3 | P4 | P5 | P6 | |
| V1 | 245 | 250 | 255 | 256 | 250 | 246 | 250 | 252 | 253 | 252 | 250 | 256 | 254 | 254 | 257 | 255 | 256 | 254 |
| 248 | 253 | 255 | 255 | 249 | 248 | 247 | 253 | 255 | 249 | 248 | 248 | 252 | 253 | 256 | 260 | 259 | 258 | |
| 247 | 253 | 256 | 256 | 250 | 249 | 250 | 252 | 254 | 255 | 250 | 248 | 251 | 253 | 258 | 258 | 256 | 253 | |
| V2 | 248 | 251 | 254 | 254 | 249 | 247 | 249 | 249 | 254 | 253 | 251 | 250 | 259 | 261 | 260 | 257 | 252 | 250 |
| 251 | 253 | 257 | 257 | 248 | 252 | 250 | 249 | 252 | 254 | 254 | 253 | 253 | 260 | 255 | 254 | 250 | 252 | |
| 248 | 254 | 257 | 257 | 254 | 245 | 252 | 253 | 255 | 256 | 255 | 254 | 252 | 255 | 256 | 254 | 253 | 251 | |
| V3 | 250 | 252 | 254 | 254 | 250 | 250 | 252 | 250 | 254 | 253 | 251 | 251 | 253 | 252 | 258 | 259 | 258 | 251 |
| 252 | 253 | 254 | 254 | 249 | 249 | 249 | 249 | 252 | 255 | 253 | 255 | 252 | 255 | 256 | 257 | 258 | 252 | |
| 249 | 250 | 252 | 252 | 250 | 248 | 253 | 255 | 257 | 254 | 255 | 250 | 255 | 258 | 260 | 259 | 258 | 255 | |
| Parts welded and milled | ||||||||||||||||||
| V1 | 276 | 280 | 286 | 286 | 270 | 260 | 270 | 273 | 279 | 282 | 280 | 269 | 268 | 290 | 284 | 270 | 268 | 270 |
| 278 | 272 | 275 | 276 | 258 | 268 | 269 | 270 | 270 | 279 | 270 | 269 | 260 | 269 | 274 | 290 | 286 | 279 | |
| 261 | 269 | 270 | 280 | 271 | 266 | 262 | 270 | 275 | 277 | 269 | 263 | 267 | 271 | 280 | 274 | 270 | 273 | |
| V2 | 255 | 264 | 268 | 271 | 277 | 275 | 275 | 276 | 280 | 282 | 281 | 271 | 273 | 279 | 273 | 275 | 268 | 270 |
| 254 | 257 | 264 | 270 | 269 | 269 | 272 | 272 | 275 | 280 | 278 | 270 | 276 | 280 | 274 | 285 | 280 | 280 | |
| 279 | 271 | 280 | 263 | 270 | 267 | 275 | 276 | 280 | 280 | 278 | 271 | 292 | 282 | 280 | 290 | 280 | 276 | |
| V3 | 270 | 274 | 279 | 280 | 270 | 270 | 266 | 286 | 283 | 269 | 265 | 272 | 290 | 290 | 294 | 300 | 293 | 280 |
| 278 | 270 | 267 | 275 | 270 | 269 | 256 | 249 | 268 | 271 | 258 | 270 | 298 | 295 | 299 | 295 | 293 | 275 | |
| 270 | 271 | 273 | 275 | 274 | 270 | 246 | 270 | 278 | 265 | 260 | 270 | 290 | 284 | 295 | 299 | 293 | 280 | |
An analysis of variance (ANOVA) with 95% of confidence was used. First, the results were analyzed for the parts only welded. Table 3 shows the results of the ANOVA, where SS = square sum, DF = degrees of freedom, MSS = mean square sum, and P value is the significance. When P value is lesser than 0.05, the result is significant, and the variable has influence in the process. In this table, the principal effects are V (welding speed), I (welding current), and P (position of the measure). VI, VP, and IP are the double interactions between the principal effects, and VIP is the triple interaction of the principal effects.
| SS | DF | MSS | P value | |||
|---|---|---|---|---|---|---|
| Total | 1824.698 | 161 | — | — | — | — |
| V | 12.308 | 2 | 6.15 | 1.503 | 0.227 | — |
| I | 461.086 | 2 | 230.543 | 56.331 | 0.001 | Significant |
| P | 538.623 | 5 | 107.725 | 26.321 | 0.001 | Significant |
| VI | 30.246 | 4 | 7.561 | 1.847 | 0.125 | — |
| VP | 46.876 | 10 | 4.687 | 1.145 | 0.336 | — |
| IP | 106.765 | 10 | 10.67 | 2.608 | 0.007 | Significant |
| VIP | 186.791 | 20 | 9.339 | 2.282 | 0.004 | Significant |
| ERR | 442.000 | 108 | 4.092 | — | — | — |
From the ANOVA, it can be concluded that welding current and the measurement position are significant and influence the microhardness. The welding speed, however, proved to be not significant and does not influence the hardness of the parts.
The analysis of variance also showed an interaction between the welding current and the measurement position, and there was also interaction between the three variables. An orthogonal contrast test revealed that there is no difference between the results obtained with the welding current I1 and I2. But, the hardness increases when the welding current I3 is used. As the increasing of hardness is associated with the introduction of compressive residual stress, we can conclude that welding current at more high level is beneficial to fatigue strength in welded parts.
The measurement position also showed to be different. The position P1 is symmetric to position P6, as well as position P2 and P5, and position P3 is symmetric to P4. An orthogonal contrast test revealed that there is no difference between the symmetric positions, as we expected. But there is a difference between the hardness measured in the position in a same side. The hardness in the positions P3 and P4 are higher than hardness in the positions P2 and P5, and these are higher than measurements at positions P1 and P6. So, we can conclude that hardness decreases from the region near the bead weld toward the edge of the part.
The analysis of variance to the welded and milled condition is presented in Table 4.
| SS | DF | MSS | P value | |||
|---|---|---|---|---|---|---|
| Total | 15,222.94 | 161 | — | — | — | — |
| V | 421.800 | 2 | 210.907 | 5.394 | 0.006 | Significant |
| I | 3735.800 | 2 | 1867.910 | 47.774 | 0.001 | Significant |
| P | 1479.900 | 5 | 295.981 | 7.570 | 0.001 | Significant |
| VI | 3361.200 | 4 | 840.315 | 21.492 | 0.001 | Significant |
| VP | 291.666 | 10 | 29.166 | 0.745 | 0.680 | — |
| IP | 210.555 | 10 | 21.055 | 0.538 | 0.859 | — |
| VIP | 1499.259 | 20 | 74.963 | 1.917 | 0.018 | Significant |
| ERR | 4222.667 | 108 | 39.098 | — | — | — |
After milled, the three variables are influents. There is interaction between the welding current and welding speed, and there is interaction between the three variables. An orthogonal contrast test revealed that there is no difference between the results obtained with the welding speeds V1 and V2. But, the hardness increases when the welding speed V3 is used. In the same way, the welding current presents no difference between I1 and I2, but the welding current I3 influences the microhardness on welding part. As it can be seen in the welded part, there is no difference between the symmetric positions. But there is difference between the hardness measured at positions in the same side. The hardness in the positions P3 and P4 is higher than hardness at positions P2 and P5, and these are higher than measurements at positions P1 and P6.
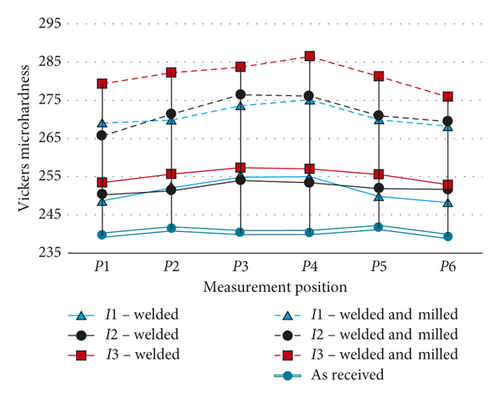
Figure 3 presents the curves of microhardness measured to the welded and welded and milled and as-received parts as a function of measurement position and welding current, when the welding speed is the intermediated speed V2 = 5.4 mm/s. The same behavior is verified with the other two welding speeds. In Figure 3, it can be noted that the welding increases the microhardness compared to that measured in the part as received. Similarly, milling also increases the microhardness over only the part welded. Also, the behavior of the microhardness is symmetrical in relation to the weld bead and shows greater from central positions (P3 and P4) toward the edge of the piece (P1 and P6), regardless of processing (welded or welded and milled) and the welding current. It is important to pay attention to the fact that the effect of welding current be more pronounced in the welded and milled part.
In Figure 4, the curves of microhardness to the welded and welded and milled are presented and as received parts as a function of the measurement positions to welding speed. In this case, the values are those obtained when the welding current is the intermediated current I2 = 160 A. The same behavior is verified with the other two welding currents, as shown in Figure 3. As it was seen from welding current, welding speed also increased the microhardness of the part compared with the part as received. And by milling the welded part, the microhardness increased more. But, in a different way, the effect of welding speed V3 was not so pronounced in the microhardness as the effect of welding current I3, as seen in Figure 3.
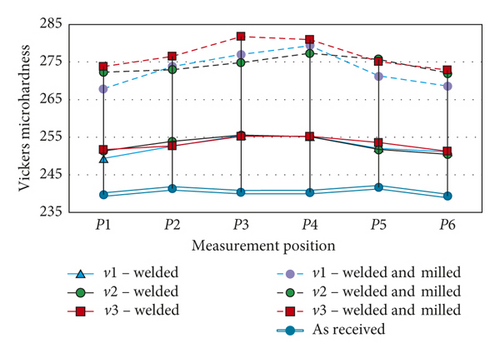
Here, the distribution of microhardness in surface of the parts of the welding speed variable, verified in the points P1 to P6, is equal to that of welding current variable.
4. Conclusions
As demonstrated by other authors, the hardness can be associated with residual stress. If it increases, the presence of compressive stress is noted. Other way, if it decreases, there is the presence of tensile stresses. In the case of welding of a SAE 1045 steel, it can be observed that compressive residual stresses are introduced. The intensities of these residual stresses are greater near the bead weld and decrease toward the edge of the part. Welding current increases still more the intensity of the residual stresses as detected in the welding current of 176 A. The effect of welding speed on residual stresses is lesser than the effect of welding current. The milling operation in a part after welding proved to increase the compressive residual stresses. In this case, the effect of the welding current of 176 A was very important. So, as a general conclusion, considering that a presence of a compressive residual stress is beneficial to fatigue strength and that the milling improves the surface quality of the product in relation to the welded surface, this work recommends the milling operation after welding of this kind of parts.
Conflicts of Interest
The authors declare that they have no conflicts of interest regarding the publication of this paper.
Acknowledgments
The authors want to thank FAPEMIG–Fundação de Amparo a Pesquisa do Estado de Minas Gerais for the financial support to this research.


