UBE2D1 RNA Expression Was an Independent Unfavorable Prognostic Indicator in Lung Adenocarcinoma, but Not in Lung Squamous Cell Carcinoma
Abstract
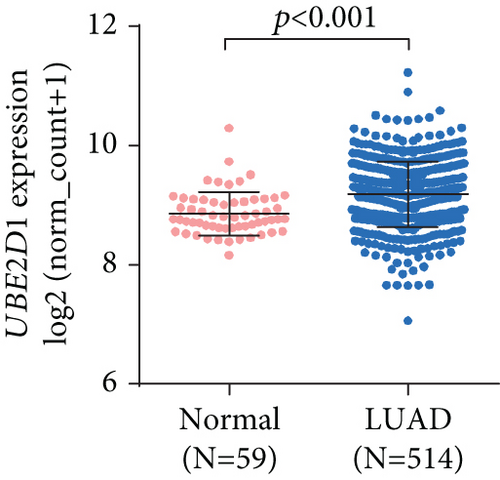
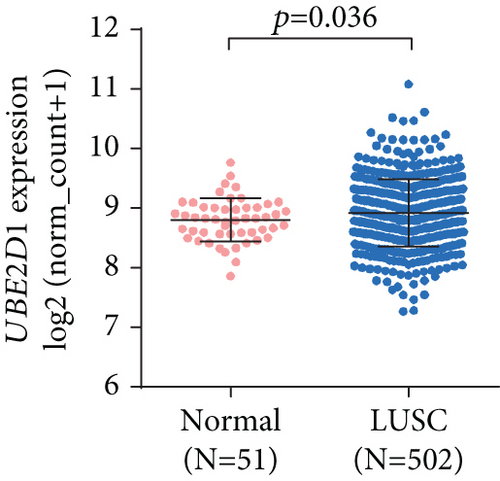
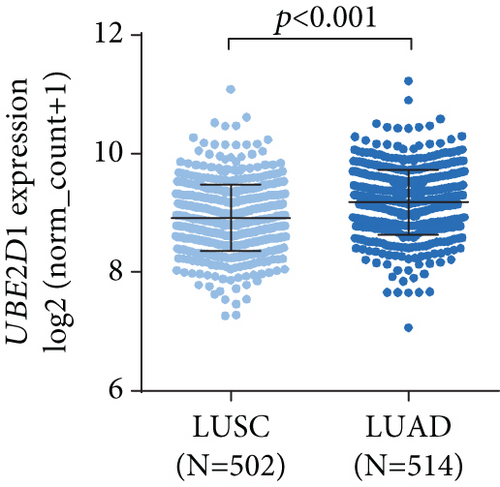
In this study, we investigated the potential prognostic value of ubiquitin-conjugating enzyme E2D1 (UBE2D1) RNA expression in different histological subtypes of non-small-cell lung cancer (NSCLC). A retrospective study was performed by using molecular, clinicopathological, and survival data in the Cancer Genome Atlas (TCGA)—Lung Cancer. Results showed that both lung adenocarcinoma (LUAD) (N = 514) and lung squamous cell carcinoma (LUSC) (N = 502) tissues had significantly elevated UBE2D1 RNA expression compared to the normal tissues (p < 0.001 and p = 0.036, respectively). UBE2D1 RNA expression was significantly higher in LUAD than in LUSC tissues. Increased UBE2D1 RNA expression was independently associated with shorter OS (HR: 1.359, 95% CI: 1.031–1.791, p = 0.029) and RFS (HR: 1.842, 95% CI: 1.353–2.508, p < 0.001) in LUAD patients, but not in LUSC patients. DNA amplification was common in LUAD patients (88/551, 16.0%) and was associated with significantly upregulated UBE2D1 RNA expression. Based on these findings, we infer that UBE2D1 RNA expression might only serve as an independent prognostic indicator of unfavorable OS and RFS in LUAD, but not in LUSC.
1. Introduction
Ubiquitination is a biological process, in which the targeting proteins were modified with ubiquitin for degradation [1]. This process is critical for cellular homeostasis, DNA repair, and proteasomal degradation [1]. Ubiquitination involves at least three classes of enzymes, including ubiquitin-activating enzymes (E1s), ubiquitin-conjugating enzymes (E2s), and ubiquitin-protein ligases (E3s) [1, 2]. E2s mediate ubiquitination by selective interactions with E1s and E3s and are responsible for the E3 selection and substrate modification, thus playing a critical role in ubiquitin transfer [3, 4]. They dictate the synthesis of a mono- or polyubiquitinated chain of a specific lysine linkage, which subsequently determines the fate of the substrate: proteasomal degradation or signaling [3, 4].
The ubiquitin-conjugating enzyme E2D family constitutes three members, including UBE2D1, UBE2D2, and UBE2D3, which all belong to the E2s. These family members share over 88% sequence identity and thus have similar enzymic activity [5, 6]. Previous studies found that UBE2D dysregulation is involved in some important pathways in carcinogenesis. They mediate the ubiquitination of the tumor-suppressor protein p53 [7–9]. Suppression of UBE2Ds can stabilize p53, leading to enhanced apoptosis and markedly inhibited proliferation of human lung cancer cells in a p53-dependent manner [10]. Among the three members, UBE2D1 can collaborate with cellular inhibitor of apoptosis protein 1 (c-IAP1) and mediate tumor necrosis factor α- (TNFα-) stimulated receptor-interacting protein 1 (RIP1) ubiquitination and NF-kappaB activation [11]. One recent study found that Smad ubiquitination regulatory factor 2 (SMURF2) and UBE2D1 form a critical E3 : E2 complex, which maintains Kirsten Ras (KRAS) protein stability [12]. Interruption of this complex by siRNA reduces the clonogenic survival in vitro and increases tumor latency in vivo in cancer cells including mutant KRAS-driven tumors [12]. These findings suggest that UBE2D1 might regulate some critical cancer-related signaling pathways.
In this study, by using the data from the Cancer Genome Atlas (TCGA)—Lung Cancer, we examined the expression profile of UBE2D1 in the two major subtypes of non-small-cell lung cancer (NSCLC) lung adenocarcinoma (LUAD) and lung squamous cell carcinoma (LUSC) and its prognostic value in these subtypes.
2. Materials and Methods
2.1. Retrospective Analysis Using the Data from the Cancer Genome Atlas (TCGA)
This study is a retrospective study using the data from TCGA, with access provided by the UCSC Xena browser (https://xenabrowser.net/). In TCGA, molecular, clinicopathological, and over 10-year survival data of more than 500 LUAD or LUSC patients were recorded. Generally, in TCGA-LUAD, tumor tissues from 514 patients with primary tumors were collected for the RNA-seq study. 502 out of the 514 patients had intact OS data recorded. In TCGA-LUSC, tumor tissues from 501 patients with primary tumors were collected for the RNA-seq study. 494 out of the 501 patients had intact OS data recorded. Clinicopathological parameters of patients with primary LUAD, including age at diagnosis, gender, smoking history, clinical stage, nodal invasion, residual tumors, recurrence status, RFS in days, living status, and OS in days, were downloaded for survival-related analysis. Kaplan-Meier curves of OS and RFS were generated to examine the survival difference in patients with high/low UBE2D1 RNA expression.
The genomic data, including UBE2D1 DNA copy number alterations (CNAs), which were presented as gene-level thresholded GISTIC2-processed copy number data, were also downloaded to examine the association between UBE2D1 RNA expression and the CNAs in LUAD patients.
2.2. Immunohistochemistry (IHC) Examination of UBE2D1 Protein Expression
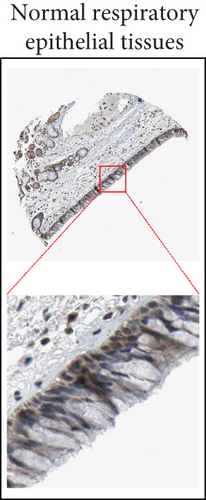
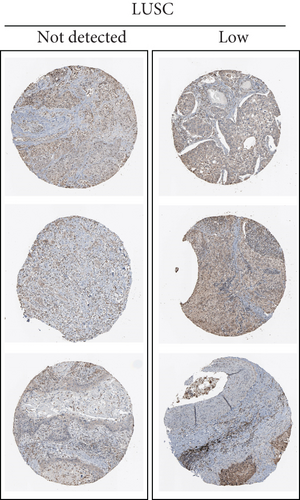
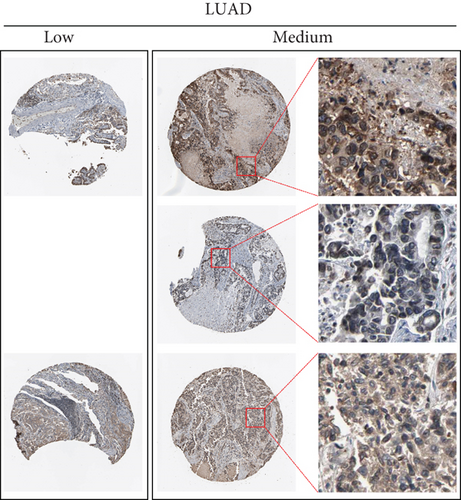
UBE2D1 expression at the protein level in normal respiratory epithelial tissues and LUAD and LUSC tissues was characterized by using IHC staining data in the Human Protein Atlas (HPA) (https://www.proteinatlas.org/) [13, 14]. IHC scoring in the database was performed by combining staining intensity (negative, low, moderate, or strong) and fraction of stained cells (<25%, 25–75%, or >75%) [15]. Each combination of intensity and fractions is automatically converted into a protein expression level score as follows: not detected: negative (−), weak: <25%, low: weak combined with either 25–75% or 75%, moderate: <25%, medium: moderate combined with either 25–75% or 75%, strong: <25%, and high: medium/strong combined with either 25–75% or 75% [15].
2.3. Statistical Analysis
Statistical analysis was conducted by using GraphPad Prism 6.0 (GraphPad Inc., La Jolla, CA, USA) or SPSS 19.0 software package (SPSS Inc., Chicago, IL, USA). Welch’s t-test was performed to examine the difference of UBE2D1 RNA expression. Receiver operating characteristic (ROC) analysis for death and recurrence detection was performed to identify the Youden index for UBE2D1 RNA expression (the cutoff to separate patients) in Kaplan-Meier curves of OS and RFS. The association between UBE2D1 RNA expression and the clinicopathological parameters in LUAD patients was assessed by using the chi-squared test by two-sided Fisher’s exact test. The log-rank test was conducted to examine the significance of the difference between the curves. Univariate and multivariate Cox regression models were used to evaluate the prognostic significance of UBE2D1 RNA expression. p < 0.05 was considered statistically significant.
3. Results
3.1. UBE2D1 RNA Expression Was Higher in LUAD and LUSC Tissues than in Normal Respiratory Tissues
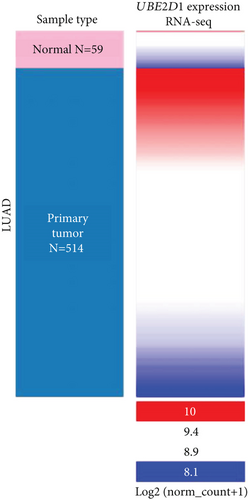
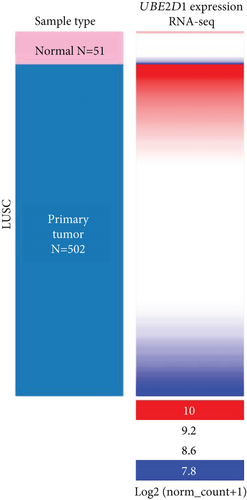
By data mining in TCGA, we obtained the RNA-seq data of UBE2D1 expression in NSCLC tissues and in normal lung tissues. The comparison showed that both LUAD (N = 514) and LUSC (N = 502) tissues had significantly elevated UBE2D1 RNA expression compared to the normal tissues (p < 0.001 and p = 0.036, Figures 1(a)–1(d)). However, LUAD tissues had substantially higher expression of UBE2D1 RNA expression compared to LUSC tissues (p < 0.001, Figure 1(e)). Using IHC staining data in the HPA, we also assessed UBE2D1 expression at the protein level in cancer tissues and normal lung tissues. Results showed that normal respiratory tissues usually had low UBE2D1 expression (Figure 2(a)). Among 6 cases of LUSC tissues examined, 3 cases had negative expression, while the rest 3 cases had low expression (Figure 2(b)). Among 5 cases of LUAD tissues examined, 2 cases had low expression and 3 cases had medium expression (Figure 2(c)). These findings suggest that UBE2D1 might also be upregulated at the protein level in LUAD tissues.
3.2. Increased UBE2D1 RNA Expression Was Associated with Poor Survival Outcomes in LUAD Patients, but Not in LUSC Patients
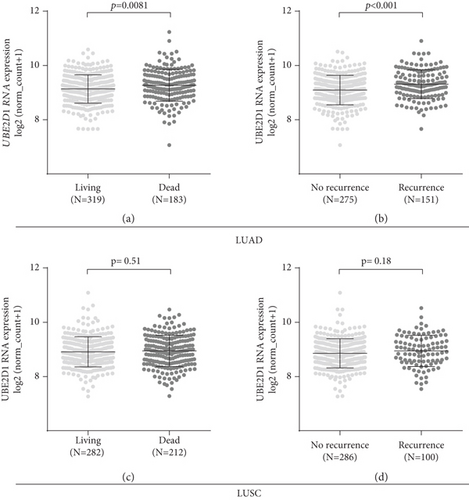
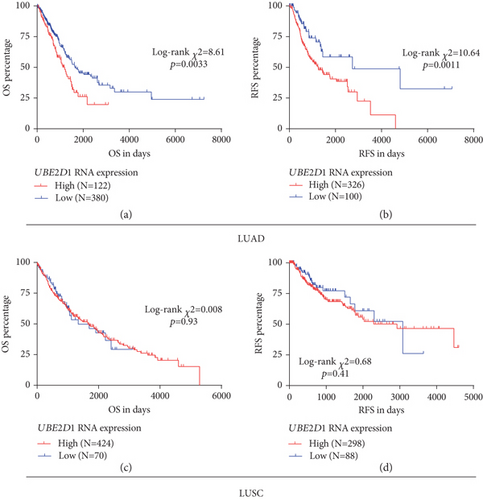
Then, we assessed the association between UBE2D1 RNA expression and survival outcomes in the major subtypes of NSCLC patients. The deceased LUAD cases (N = 183) had markedly higher UBE2D1 RNA expression compared to the living cases (N = 319) (Figure 3(a)). Besides, the LUAD patients with recurrence (N = 151) also had significantly increased UBE2D1 RNA expression compared to the patients without recurrence (N = 275) (Figure 3(b)). In comparison, we did not find any significant associations in LUSC (Figures 3(c) and 3(d)). Then, we generated Kaplan-Meier survival curves to examine the association between UBE2D1 RNA expression and the survival outcomes. Results showed that in LUAD patients, the group with high UBE2D1 RNA expression had inferior OS (p = 0.0033) and RFS (p = 0.0011) compared to the group with low expression (Figures 4(a) and 4(b)). In contrast, UBE2D1 RNA expression was not associated with OS or RFS in LUSC patients (p = 0.93 and 0.41, respectively, Figures 4(c) and 4(d)).
3.3. UBE2D1 RNA Expression Was Independently Associated with Shorter OS and RFS in LUAD Patients
The association between UBE2D1 RNA expression and the clinicopathological parameters in LUAD patients is summarized in Table 1. The comparison showed that the group with high UBE2D1 RNA expression had a significantly higher ratio of patients in advanced stages (III/IV) (34/119 vs. 72/375, p = 0.04), nodal positive cases (50/120 vs. 117/371, p = 0.046), cases with residual tumors (8/91 vs. 8/261, p = 0.037), recurrence (48/101 vs. 103/325, p = 0.0043), and death (59/122 vs. 124/380, p = 0.0024) compared to the group with low UBE2D1 RNA expression.
| Parameters | UBE2D1 RNA expression | p value | ||
|---|---|---|---|---|
| High (N = 122) | Low (N = 380) | |||
| Age (mean ± SD) | 64.54 ± 10.99 | 65.58 ± 9.59 | 0.91 | |
| Gender | Female | 65 | 206 | 0.92 |
| Male | 57 | 174 | ||
| Smoking history | 2/3/4/5 | 108 | 308 | 0.054 |
| 1 | 11 | 61 | ||
| No data | 3 | 11 | ||
| Clinical stage | III/IV | 34 | 72 | 0.040 |
| I/II | 85 | 303 | ||
| Discrepancy/no data | 3 | 5 | ||
| Nodal invasion | N0 | 70 | 254 | 0.046 |
| N1/2/3 | 50 | 117 | ||
| NX/no data | 2 | 9 | ||
| Residual tumors | R0 | 83 | 253 | 0.037 |
| R1/R2 | 8 | 8 | ||
| RX/no data | 31 | 119 | ||
| Recurrence status | No | 53 | 222 | 0.0043 |
| Yes | 48 | 103 | ||
| No data | 21 | 55 | ||
| Living status | Living | 63 | 256 | 0.0024 |
| Dead | 59 | 124 | ||
- Smoking history: 1—lifelong nonsmoker, 2—current smoker, 3—current reformed smoker (for >15 yrs), 4—current reformed smoker (for ≤15 yrs), and 5—current reformed smoker (duration not specified); NX: regional lymph nodes cannot be assessed; RX: the presence of residual tumor cannot be assessed.
In univariate analysis, we observed that advanced stages, positive nodal invasion with residual tumors, and increased UBE2D1 RNA expression were associated with unfavorable OS and RFS in LUAD (Tables 2 and 3). The following multivariate analysis confirmed that increased UBE2D1 RNA expression independently predicted poor OS (HR: 1.359, 95% CI: 1.031–1.791, p = 0.029) (Table 2) and RFS (HR: 1.842, 95% CI: 1.353–2.508, p < 0.001) (Table 3).
| Parameters | Univariate analysis | Multivariate analysis | ||||||
|---|---|---|---|---|---|---|---|---|
| p | HR | 95% CI (lower/upper) | p | HR | 95% CI (lower/upper) | |||
| Age (continuous) | 0.330 | 1.008 | 0.992 | 1.023 | ||||
| Gender (female vs. male) | 0.670 | 0.939 | 0.702 | 1.256 | ||||
| Smoking history (2/3/4/5 vs. 1) | 0.662 | 0.912 | 0.604 | 1.377 | ||||
| Clinical stage (III/IV vs. I/II) | <0.001 | 2.646 | 1.942 | 3.606 | 0.005 | 1.687 | 1.168 | 2.437 |
| Nodal status (positive vs. negative) | <0.001 | 2.569 | 1.912 | 3.452 | <0.001 | 1.906 | 1.346 | 2.700 |
| Residual tumors (yes vs. no) | <0.001 | 3.937 | 2.204 | 7.033 | 0.001 | 2.650 | 1.463 | 4.801 |
| UBE2D1 RNA expression (continuous) | 0.007 | 1.469 | 1.113 | 1.939 | 0.029 | 1.359 | 1.031 | 1.791 |
| Parameters | Univariate analysis | Multivariate analysis | ||||||
|---|---|---|---|---|---|---|---|---|
| p | HR | 95% CI (lower/upper) | p | HR | 95% CI (lower/upper) | |||
| Age (continuous) | 0.323 | 1.008 | 0.992 | 1.025 | ||||
| Gender (female vs. male) | 0.574 | 1.097 | 0.794 | 1.516 | ||||
| Smoking history (2/3/4/5 vs. 1) | 0.435 | 1.208 | 0.752 | 1.939 | ||||
| Clinical stage (III/IV vs. I/II) | 0.006 | 1.711 | 1.168 | 2.506 | 0.285 | 1.288 | 0.810 | 2.048 |
| Nodal status (positive vs. negative) | 0.003 | 1.633 | 1.178 | 2.264 | 0.183 | 1.308 | 0.881 | 1.942 |
| Residual tumors (yes vs. no) | <0.001 | 3.808 | 1.838 | 7.892 | 0.008 | 2.743 | 1.297 | 5.803 |
| UBE2D1 RNA expression (continuous) | <0.001 | 1.958 | 1.443 | 2.657 | <0.001 | 1.842 | 1.353 | 2.508 |
3.4. DNA CNAs Were Associated with Dysregulated UBE2D1 RNA Expression in LUAD Patients
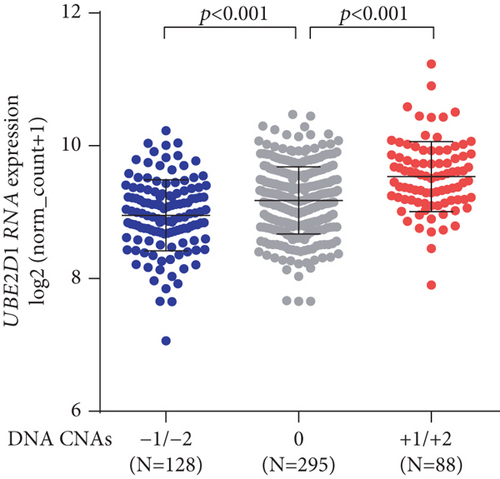
Then, we explored the potential mechanism of UBE2D1 dysregulation. Among 551 cases with both UBE2D1 CNAs and RNA-seq data, 88 cases had amplification (+1/+2) CNA, 295 had copy neutral (0) CNA, and 128 had deletion (−1/−2) CNA (Figure 5). DNA deletion was associated with decreased UBE2D1 RNA expression, while DNA amplification was associated with increased UBE2D1 RNA expression, compared to the copy neutral group (Figure 5).
4. Discussion
In this study, our data mining results showed that although UBE2D1 RNA was significantly upregulated in both LUAD and LUSC tissues compared with normal tissues, its expression was even higher in LUAD tissues than in LUSC tissues. Interestingly, we observed that UBE2D1 RNA upregulation was associated with poor survival outcomes in LUAD patients, but not in LUSC patients. By performing univariate and multivariate analyses, we confirmed that increased UBE2D1 RNA expression was independently associated with shorter OS (HR: 1.359, 95% CI: 1.031–1.791, p = 0.029) and RFS (HR: 1.842, 95% CI: 1.353–2.508, p < 0.001) in LUAD patients. Therefore, we infer that UBE2D1 RNA expression might only serve as an independent prognostic indicator of unfavorable OS and RFS in LUAD, but not in LUSC.
Previous studies showed that UBE2Ds play a critical role in the ubiquitination and degradation of p53 [7, 8]. P53 is a master tumor-suppressive gene, and its degradation has a crucial role in human carcinogenesis, including NSCLC. P53 inactivation is closely associated with lung adenocarcinoma initiation, progression, and metastasis via multiple signaling pathways [16]. In Kras-driven LUAD, Notch1 initiates carcinogenesis by suppressing p53-mediated apoptosis through the regulation of p53 stability [17]. P53 inactivation can lead to DDX3 loss, which subsequently results in Slug-suppressed E-cadherin expression via decreased MDM2-mediated Slug degradation [18]. The NSCLC patients with p53 inactivation also have poor survival outcomes [18]. P53 degradation directly lowers the p53-dependent transcription of the tumor suppressors RAD51 and p21 and the upregulation of the oncogene SOX2 in LUAD [19]. A recent study showed that the UBE2Ds, together with RNF138, accumulate at damaged-DNA sites and promote DNA repair via promoting CtIP ubiquitylation and accrual [20]. In fact, the therapeutic effect of the current chemo- and radiotherapies mainly relies on inducing DNA damage of cancer cells. Therefore, upregulation of UBE2Ds in cancer cells may result in a weakened effect of the DNA-damaging anticancer therapy and rapid recovery after the damage. The key molecules in the DNA damage response (DDR) pathways have also been considered ideal targets for therapeutic intervention, including the E2s [21]. These mechanisms help explain why UBE2D1 upregulation is associated with poor OS and RFS in LUAD patients.
Although we confirmed the potential prognostic value of UBE2D1 RNA expression in LUAD, the mechanisms underlying its dysregulation have not been explored. In this study, we examined the association between UBE2D1 RNA expression and the CNAs of its DNA, and the results showed that DNA amplification was common in LUAD patients (88/551, 16.0%) and was associated with significantly upregulated UBE2D1 RNA expression, compared to the copy neutral patients. These findings suggest that DNA amplification might be an essential cause of upregulated UBE2D1 in LUAD.
5. Conclusion
UBE2D1 RNA expression might only serve as an independent prognostic indicator of unfavorable OS and RFS in LUAD, but not in LUSC. DNA amplification might be an essential cause of upregulated UBE2D1 RNA expression in LUAD.
Conflicts of Interest
The authors have no conflict of interest.
Open Research
Data Availability
All TCGA data used in this study can be obtained via the UCSC Xena browser (https://xenabrowser.net/).


