Impact Assessment of Phosphogypsum Leachate on Groundwater of Sfax-Agareb (Southeast of Tunisia): Using Geochemical and Isotopic Investigation
Abstract
The production of phosphoric acid by the Tunisian Chemical Group, in Sfax, Tunisia, led to the degradation of the groundwater quality of the Sfax-Agareb aquifer mainly by the phosphogypsum leachates infiltration. Spatiotemporal monitoring of the quality of groundwater was carried out by performing bimonthly sampling between October 2013 and October 2014. Samples culled in the current study were subject to physicochemical parameters measurements and analysis of the major elements, orthophosphates, fluorine, trace metals, and stable isotopes (18O, 2H). The obtained results show that the phosphogypsum leachates infiltration has a major effect on the downstream part of the aquifer, where the highest values of conductivity, , Ortho-P, and F−, and the lowest pH were recorded. In addition, these results indicated that phosphogypsum leachates contained much higher amount of Cr, Cd, Zn, Cu, Fe, and Al compared to the groundwater. Spatiotemporal variation of the conductivity and concentrations of major elements is linked to the phosphogypsum leachates infiltration as well as to a wide range of factors such as the natural conditions of feeding and the water residence time. Contents of 18O and 2H showed that the water of the Sfax-Agareb aquifer undergoes a large scale evaporation process originated from recent rainfall.
1. Introduction
Groundwater pollution proves to be potentially threatening as it puts at jeopardy the hygienic integrity of a huge water reserve. The intensification of industrial activities, as well as the diversification of the storage modes of by-products production, makes groundwater resources vulnerable and can be considered as the main factors responsible for groundwater pollution. The groundwater quality is equally important as its quantity to the suitability of water for various purposes [1]. Variation of groundwater quality in different regions is a function of physical and chemical parameters that are greatly influenced by geological formations and anthropogenic activities [2]. Groundwater resources of the Mediterranean coastal plains in the southern bank of the basin (Middle East and North Africa) show a qualitative and quantitative deterioration developing in time [3–5] resulting in natural constraints and anthropological activities.
In Tunisia, climatic constraints, with a moderate rainfall contribution, which are unequally distributed in the space and irregular in time, as well as a strong evaporation power, make water resources limited. Socioeconomic development and the spread of industrialization have led to pressuring the resources and increasing the demand. Thus, the water supply, estimated at 472 m3/inhabitant in 2010, will decrease to 315 m3/inhabitant in 20 years [6]. In addition, water pollution related to the increased water use, urban and industrial areas, and agricultural intensification is increasingly threatening both the quality and the amount of groundwater resources. This phenomenon’s implications are felt in the satisfaction of water demand as well as water cost.
2. Description of the Study Area
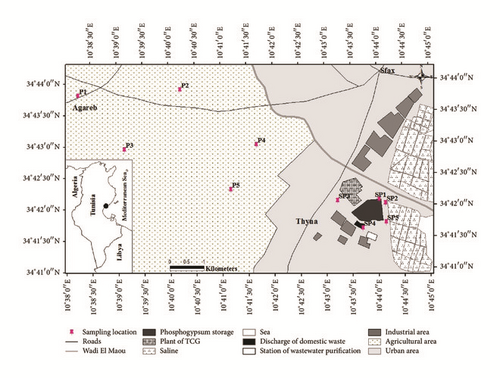
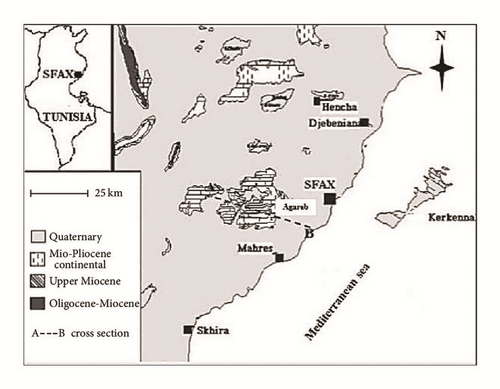
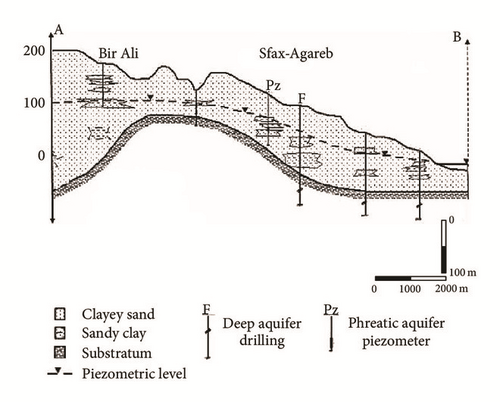
The study area is situated in the coast of Sfax, where the TCG plant, a discharge of domestic waste, and a station of wastewater treatment are located (Figure 1). The study area is under the influence of the Mediterranean climate, relatively humid and temperate, with cold and rainy seasons, between December and March, and dry and hot seasons, between June and October. The average annual precipitation is around 250 mm [15]. The mean annual temperature is 20°C [16]. The outcropping geological formations (Figure 2) are composed of sandy clays rich in gypsum and silty sand [17], of Mio-Pliocene to lower Quaternary age [18]. The TCG site takes place in an area covered by recent alluvium, made up by sand and calcareous gypsum crusts. The Sfax-Agareb aquifer, in this case study, is constituted by two sandy levels, ranging from 2 to 5 m in terms of thickness (Figure 3), separated by clay and sandy layers [19]. This aquifer is recharged by meteoric water. Groundwater flow in the study area is Northwest to Southeast.
3. Materials and Methods
3.1. Groundwater Sampling and Analysis
Groundwater samples were culled bimonthly from ten piezometers in the phreatic aquifer of Sfax-Agareb, between October 2013 and October 2014 (Figure 1). Monitoring piezometers purging was accomplished by using a submersible pump. The purge was achieved when the pH and the electrical conductivity (EC) of the ground water have been stabilized. Samples taken were acidified using 0.1 N HNO3 and kept at 4°C until the analysis was thoroughly carried out aiming to optimize the accuracy of the obtained findings. The samples were analyzed for the following parameters, which include EC, pH, T, dissolved O2, Cl−, , , Na+, K+, Mg2+, Ca2+, F−, and orthophosphates (Ortho-P). EC, pH, and dissolved oxygen were measured in the field using calibrated portable digital meters. Calcium, magnesium, sodium, and potassium were identified using atomic absorption spectrometer. Carbonate, bicarbonate, chloride, and sulfate were determined by standard titration methods [21]. Orthophosphates were analyzed by absorption colorimeter [21] and fluoride ion concentrations were measured by specific electrode [21]. The accuracy of the chemical analysis was determined by calculating the ionic balance error, which was generally less than 5%. The trace elements were analyzed using inductivity coupled plasma-atomic emission spectrophotometer (ICP-AES). A summary of the physicochemical and chemical data of all the investigated groundwater during the period 2013-2014 is presented in Table 1. Stable isotope analysis of δ 2H and δ 18O was performed by cavity ring down spectrometry using a Picarro L2120 [22] at the laboratory of Applied Geology and Geo-Environment, Ibn Zohr University, Morocco.
| Months | Unit | Oct 13 | Jan 14 | Mar 14 | May 14 | Aug 14 | Oct 14 | ||||||
|---|---|---|---|---|---|---|---|---|---|---|---|---|---|
| Parameters | Min | Max | Min | Max | Min | Max | Min | Max | Min | Max | Min | Max | |
| T | °C | 12.1 | 13.9 | 10.1 | 12.8 | 11 | 11.7 | 11.10 | 12.20 | 12.2 | 13.2 | 12.00 | 13.1 |
| pH | mg/L | 5.18 | 7.74 | 5.75 | 8.1 | 5.58 | 7.95 | 5.56 | 7.85 | 5.2 | 7.79 | 5.50 | 7.76 |
| O2dissolved | mg/L | 0.9 | 2.15 | 0.9 | 4.2 | 0.8 | 3.5 | 0.80 | 3.12 | 0.7 | 2.9 | 0.50 | 2.8 |
| EC | µs/cm | 2100 | 33200 | 1590 | 33000 | 1650 | 32600 | 1680 | 34300 | 1800 | 34700 | 1900 | 34900 |
| K+ | mg/L | 2.7 | 22.70 | 2.25 | 19 | 2.15 | 19.6 | 2.60 | 19.50 | 2.5 | 21.2 | 2.7 | 23.68 |
| Na+ | mg/L | 111.5 | 6965 | 139.4 | 6760 | 142 | 6300 | 115.16 | 6124 | 198 | 6600 | 195 | 6515 |
| Ca2+ | mg/L | 59 | 986 | 49 | 904 | 50 | 851 | 54.36 | 1075 | 51 | 1080 | 58 | 1020 |
| Mg2+ | mg/L | 37 | 945 | 22.5 | 920 | 24 | 940 | 29.75 | 1085 | 25 | 1050 | 35 | 1080 |
| Cl- | mg/L | 110.6 | 5480 | 104.3 | 5396 | 101 | 5372.5 | 151 | 5475 | 135.5 | 5810 | 112 | 5632.5 |
|
|
mg/L | 256.4 | 9143.9 | 195.2 | 9661.5 | 271 | 9533.9 | 199.20 | 8533.9 | 245 | 9313.9 | 255 | 9973 |
|
|
mg/L | 215 | 4396.1 | 201.5 | 4295.7 | 204 | 4352.9 | 261.25 | 4543.7 | 210 | 4857.3 | 210 | 4948.5 |
| Ortho-P | mg/L | 2.15 | 67.3 | 2.5 | 81.7 | 2.7 | 71.00 | 1.90 | 136.65 | 1.5 | 92 | 1.25 | 114.95 |
| F− | mg/L | 0.6 | 26 | 0.6 | 27 | 0.50 | 19.00 | 0.50 | 29.00 | 0.5 | 17 | 0.6 | 19 |
| Al | mg/L | 0.02 | 1.8 | 0.03 | 1.57 | 0.03 | 0.90 | 0.06 | 0.98 | 0.02 | 0.96 | 0.03 | 0.97 |
| Zn | mg/L | 0.03 | 1.46 | 0.02 | 1.41 | 0.02 | 1.44 | 0.03 | 1.47 | 0.04 | 1.51 | 0.03 | 1.05 |
3.2. Multivariate Statistical Analysis
The application of multivariate statistical analysis offers a clearer understanding of water quality and enables comparison of the different water samples [23] and making of correlations between chemical parameters and groundwater samples, respectively. The different elements combination (samples and parameters) is used in order to characterize the hydrogeochemical variation of the Sfax-Agareb aquifer, in the site of TCG, in order to predict the future of the PG leachate percolation as well as to assess the spatial variation of the groundwater chemical composition. In this study, only the principal component analysis (PCA) was carried. PCA of the experimental data has been performed using the Xlstat.
4. Results and Discussion
4.1. Characterization of PG Leachate
On global scale, 15% of the PG production is recycled while large quantities are stored in the factories vicinity, which are disposed mostly in big piles. They are located in coastal areas with phosphoric acid plants nearby, both as dry or wet staking and without treatment [24]. Since PG waste is generally transported and disposed as an aqueous slurry, dissolution/leaching of the chemical elements present in the PG can occur. Dissolved elements may be deposited in nearby soils or transferred to groundwater [25]. Thus, it is important to know the characteristics of leachate obtained from the PG waste dump. Table 2 lists the chemical composition of a typical sample of PG leachate sampling from the GCT site of Sfax. The leachate has a very low pH (1.3) and high concentrations of fluoride (3500 mg/L), orthophosphate (6730 mg/L), and toxic elements (Cd, Cr, and Zn). For all the analyzed elements, the levels exceeded the Tunisian standard for liquid discharge (NT 106-002).
| Parameters | Leachate PG | Tunisian standard for liquid discharge (NT 106-002) |
|---|---|---|
| EC | 22700 | |
| pH | 1.3 | 6.5–8.5 |
| F | 3500 | 3 |
|
|
6730 | 0.05 |
| Ca2+ | 1357 | 500 |
|
|
3240 | 600 |
| Mg2+ | 198 | 200 |
| Cl- | 1560 | 600 |
| Na+ | 2000 | 500 |
| K+ | 139 | 50 |
| Cr | 1.2 | 0.5 |
| Cd | 0.8 | 0.005 |
| Zn | 4 | 5 |
| Al | 4 | 5 |
| Cu | 0.5 | 0.5 |
| Fe | 6 | 1 |
- Units in mg/L except pH and EC (µS/cm).
4.2. Groundwater Geochemical Characteristics and Evolution
4.2.1. Physicochemical Parameters
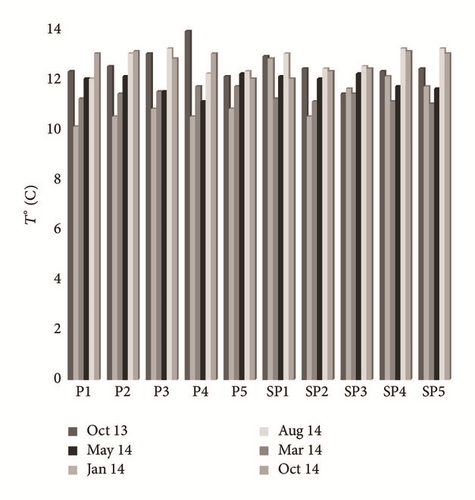
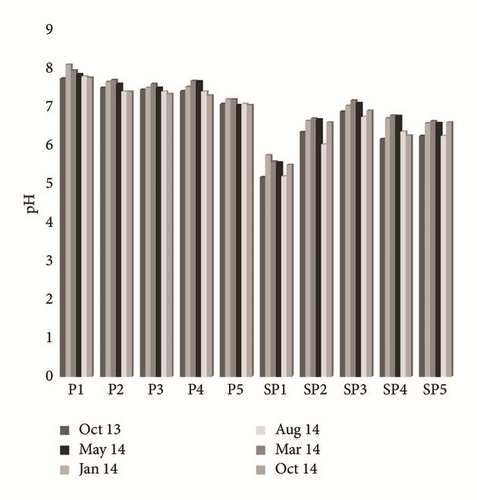
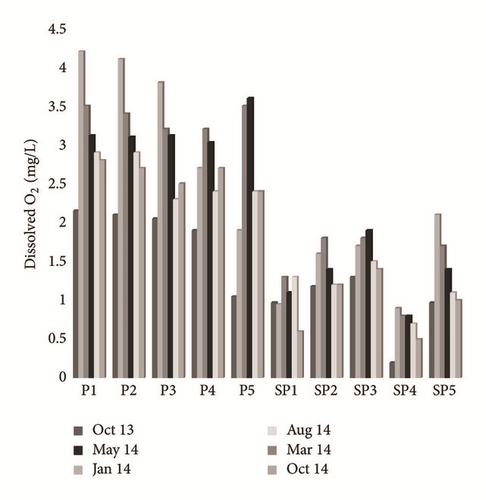
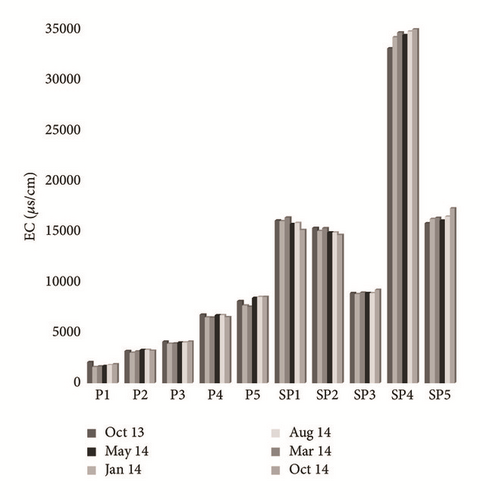
Groundwater temperature tends to vary from 10.1 to 13.9°C. The spatiotemporal variation of this parameter did not show any audible alternation during the whole period of testing (Figure 4(a)). The pH values remain in the range of 5.18–7.95 as detailed. The lowest values were measured near PG storage site (SP1 and SP4), whereas in the upstream part of the study area (P1, P2, P3, P4, P5, and SP1) they were mainly neutral to slightly alkaline (Figure 4(b)). The contents of dissolved O2 fluctuate between 0.5 and 4.2 mg/L. The spatial distribution of these values shows an increase as we move further from the site of PG storage, in the direction of groundwater flow (Figure 4(c)). The temporal variation of this parameter depends on the control of the depth of the water table, the recharge rate, the transfer speed of oxygenated water from the upstream to the downstream, and the temperature. The electrical conductivity (EC) ranged from 1590 μs/cm to 34900 μs/cm at 25°C. The highest value characterizes sampled water in the southwest (SP4) and in the southeast (SP5) of the study area, whereas the lowest EC was the main feature of the P1, P2, and P3 piezometers (Figure 4(d)). This spatial variation in the flow direction of the phreatic aquifer (North-West to Southeast) is related to sea water intrusion and to the infiltration of both PG leachate and saline brines. The highest values are recorded during the dry season (May, August, and October), while the lowest values are recorded during the wet season (January and March). The temporal variation is due to the dilution effect with fresh water in the recharge areas during the wet season and the direct evaporation, during the dry season, in areas with low hydraulic gradient and poor permeability [26].
4.2.2. Origin and Geochemical Behavior of Major Elements
Concentrations of , , and Ca2+ ranged from 201.5 to 4948.5 mg/L, from 195.2 to 9973 mg/L, and from 49 to 1080 mg/L, respectively. During the study period, the higher contents of and Ca2+ were registered in SP4 piezometer, whereas the optimal concentrations of were measured in SP5 piezometer, which is located in the east of the PG storage.
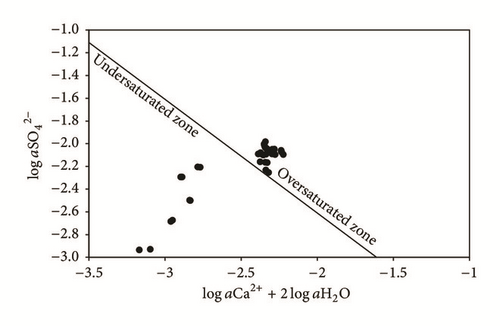
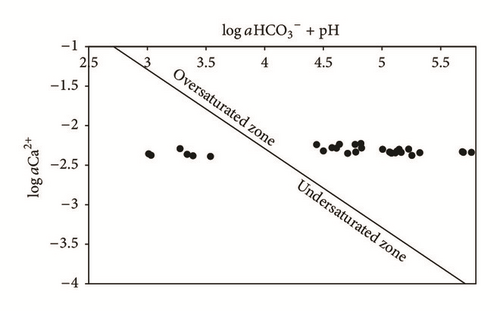
The results show that the groundwater of the upstream zone of the phreatic aquifer (P1, P2, P3, P4, P5, and SP3) is undersaturated compared to gypsum (Figure 5), while, in the downstream zone, water with low pH (SP1, SP2, SP4, and SP5) is oversaturated. Compared to this mineral, the groundwater oversaturation, in the TCG site, is explained by the acid PG leachate infiltration, which promotes the dissolution of gypsum and the complexation of Ca2+ and ions. The equilibrium diagram (Figure 6) shows that groundwater, except for SP1 near the PG dump, is widely oversaturated compared to calcite. SP1 water is highly acidic, which prevents saturation with respect to calcite.
- (i)
Group I: Na+ and Cl− contents are less than 50 mmol/L and 30 mmol/L, respectively. It concerns water of the upstream part of the study area (P1, P2, P3, and P4).
- (ii)
Group II: Na+ and Cl− concentrations range from 50 to 120 mmol/L and from 30 to 100 mmol/L, respectively. This group encompasses water of the downstream zone, near the evaporation ponds (SP1, SP2, SP3, and SP5).
- (iii)
Group III: Na+ and Cl− contents are greater than 250 mmol/L and 150 mmol/L, respectively. It includes water of SP4 piezometer, affected by the wastewater and the infiltration of PG leachate relatively rich in Na+ and Cl− (Table 2).
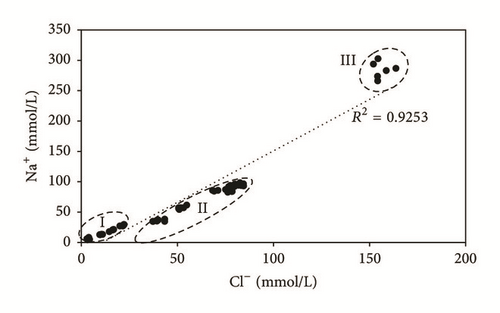
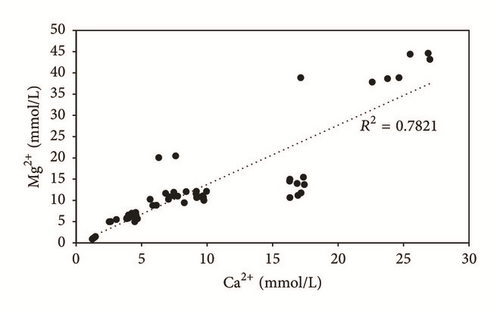
The enrichment in Na+ and Cl−, from the upstream to the downstream, would be related to water-reservoir rock interaction, saline water infiltration from the evaporation ponds, and marine intrusion. During the study period, potassium concentrations are almost homogeneous at the same sampling location, with values ranging from 2.15 to 23.68 mg/L. The concentrations of Mg2+, which fluctuate between 22.5 and 1085 mg/L, are positively correlated to Ca2+ contents, with a determination coefficient of 0.78, suggesting the same origin, which is the magnesian calcite dissolution (Figure 8). The highest values of the different majors elements are recorded during the dry season (October, August, and May), while the lowest values are recorded during the wet season (January and March). The slight variation is due to the dilution effect with fresh water in the recharge areas during the wet season and evaporation, during the dry season.
4.2.3. Orthophosphates and Fluorine Concentrations
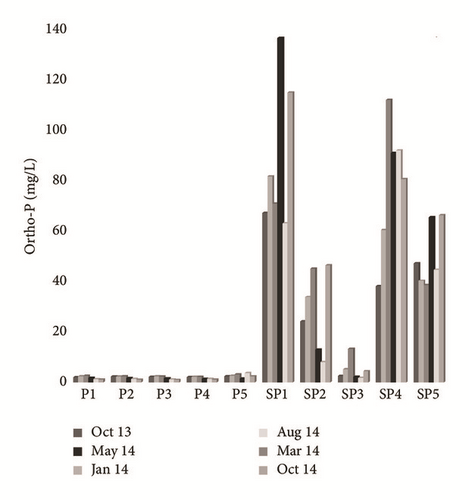
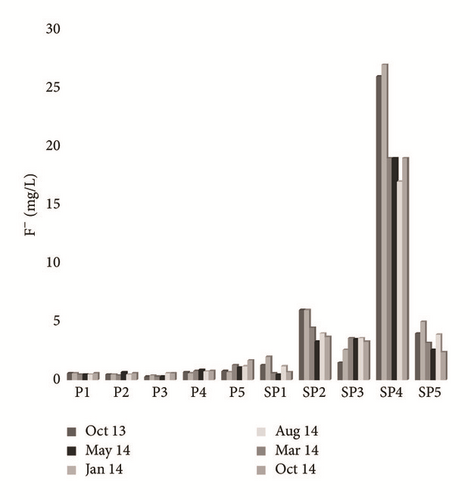
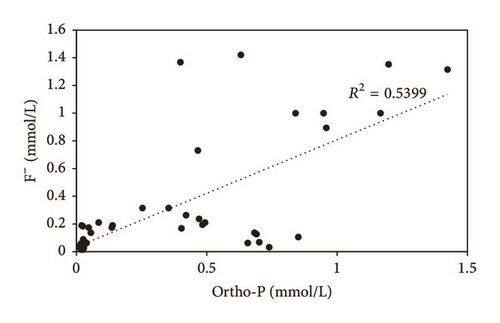
Ortho-P and fluorine concentrations fluctuate between 1.5 and 136.65 mg/L and between 0.5 and 29 mg/L, respectively. Groundwater sampled near the PG discharge site showed high concentration levels of Ortho-P, which are larger in terms of extent and impact than those taken from the upstream part (Figure 9(a)). The highest levels of fluorine were measured in SP4 groundwater (Figure 9(b)). All shallow groundwater samples except P1, P2, and P3 contain F− > 1.5 mg/L, which is the WHO drinking water standard. The spatial distribution of F− and Ortho-P contents is related to the diffusion resulting from the flow direction of the aquifer as well as the chemical transformations of the PG leachates in the unsaturated zone. A significant temporal variation was recorded, due to the dilution during the recharging period. Plot of Ortho-P against fluoride (Figure 10) shows tremendous correlation, around the PG dump, suggesting that these elements originate from PG leachate, which are highly concentrated in Ortho-P and F− (Table 2). On the other hand, groundwater of the upstream part does not show an evident correlation, which confirms the natural origin of these elements in this zone [31].
4.2.4. Trace Elements
The source of trace metals in the groundwater could be geogenic, but high concentrations above the permissible limit of drinking water standards raise the suspicions of industrial contamination sources [32]. The concentrations of Zn and Al in the study area varied from 0.02 to 1.51 mg/L and from 0.02 to 1.8 mg/L, respectively. The higher contents of Zn were registered in SP4 piezometer, whereas the optimal concentrations of Al were measured in SP1 piezometer, which is located near the PG storage. For the majority of the sampled water, the Cr, Cd, and Cu contents do not exceed 0.05 mg/L. Low levels of trace elements noticed in the majority of the analyzed water, despite the gypsum water contamination, are linked to the purifying function of soils. The mechanisms that allow transforming charged surface water with dissolved, mineral, or organic matter into less charged water form the purifying functions of the soil [33].
4.3. Statistical Analysis
To discuss the relationships between the physicochemical parameters, major elements, Ortho-P, and fluorine in groundwater samples, PCA was used to distinguish the contributions of the natural and anthropogenic processes to the Sfax-Agareb aquifer, in the site of TCG.
Two independent factors were extracted, which explain 83.77% of the total variance. The first factor (F1) presents 72.34% of the total inertia. It is defined by EC and the Ca2+, Cl−, Na+, K+, Mg2+, , and contents in a less important measurement by Ortho-P and F−. These elements contribute to the mineralization of the groundwater in TCG site. The second factor (F2) explains 11.43% of the total variance with a strong loading with pH and dissolved O2 (Table 3). The spatial distribution of the variables (chemical parameters) and individuals (samples) in the axe systems F1-F2 shows the presence of two water groups (Figure 11).
| Variables | Axe F1 | Axe F2 |
|---|---|---|
| Na+ | 0.9902 | 0.0400 |
| Cl- | 0.9537 | 0.2568 |
| K+ | 0.9646 | −0.0319 |
| Ca2+ | 0.9162 | 0.2195 |
|
|
0.7810 | −0.3565 |
| Mg2+ | 0.8930 | 0.3142 |
|
|
0.8782 | 0.4375 |
| T° | 0.1665 | −0.3803 |
| pH | −0.7253 | 0.6316 |
|
|
0.8026 | −0.3231 |
| F- | 0.8387 | 0.4741 |
| Dissolved O2 | −0.8304 | 0.3433 |
| EC | 0.9894 | 0.1067 |
| Al | 0.7383 | −0.4214 |
| Zn | 0.9474 | 0.0343 |
| Eigenvalues | 10.8513 | 1.7147 |
| % variance explained | 72.3422 | 11.4312 |
| % cumulative variance | 72.3422 | 83.7734 |
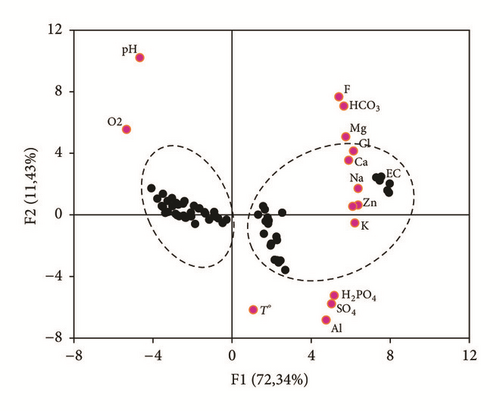
The PCA confirm the different geochemical correlation and classification of the Sfax-Agareb groundwater, in TCG site, into two types: groundwater samples collected from the downstream part, which are influenced by the anthropogenic processes, largely controlled by the PG leachate percolation and the seawater intrusion. Samples collected from the upstream part of the study area were principally controlled by the natural recharge, with no evidence of high anthropogenic impacts.
4.4. Stable Isotopes (18O, 2H)
-
Group I is generated by the most enriched water in isotopes: SP1, SP2, SP4, and SP5 in the downstream part of the water table.
-
Group II involves water characterized by the lowest levels of δ18O and δ2H: P1, P2, P3, P4, and SP3 in the upstream part of the water table.
| δ 18O (‰) | δ 2H(‰) | Cl- (mg/L) | |
|---|---|---|---|
| P1 | −5.97 | −36.01 | 151 |
| P2 | −5.88 | −35.98 | 356 |
| P3 | −5.64 | −35.37 | 581 |
| P4 | −5.61 | −35.22 | 776 |
| P5 | −5.57 | −32.18 | 1739.5 |
| SP1 | −3.58 | −26.80 | 2627 |
| SP2 | −4.12 | −27.20 | 2130 |
| SP3 | −5.50 | −34.47 | 745.5 |
| SP4 | −3.65 | −26.10 | 5475 |
| SP5 | −4.10 | −26.88 | 2094.5 |
| Sfax rainwater | −4.60 | 10 | |
| Seawater | 0.00 | 19000 |
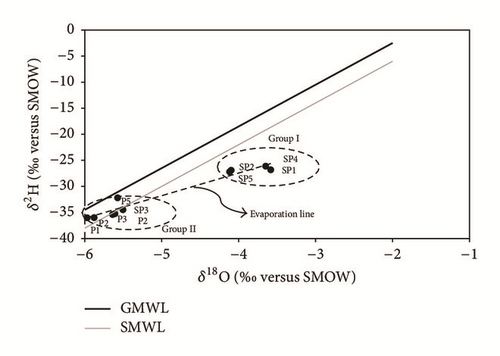
The δ 18O/Cl− diagram [37] confirms the groundwater distribution into two groups (Figure 13), weakly or strongly evaporated, which are distinguished by their chlorides and oxygen-18 contents. Indeed, the representative points of these two groups are located on either side of the rainwater pole, characterized by Cl− and δ 18O contents, respectively, of 10 mg/L and 4, 6‰ V-SMOW.
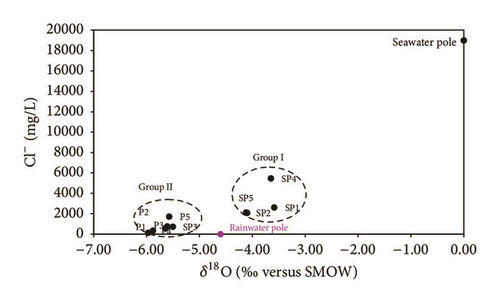
The total dissolved solids of group I water, which are characterized by higher contents of Cl− and δ 18O than those of rainwater, but lower than those of seawater, are related, in part, to evaporation.
5. Conclusion
The geochemical study of the major elements, Ortho-P, F−, trace elements, and stable isotopes, elucidated the influence of PG leachates and laid emphasis upon the natural factors intervening in altering the groundwater chemistry of the Sfax-Agareb aquifer. Temporal variation was recorded due to dilution during the recharging period in winter. The groundwater mineralization is related to water-rock interaction processes, saline water, and PG leachates infiltration coupled with marine intrusion. Groundwater below the PG dump and in the downstream part of the aquifer showed the highest concentrations of Ortho-P, F−, , acidity, and total dissolved solids, which significantly exceed those relevant to the upstream water. Spatial distribution of these contents is presumably related to the diffusion that ensues the flow direction of the aquifer and the water-rock interaction. The groundwater quality is severely deteriorating in the downstream part of the Sfax-Agareb aquifer especially by Zn and Al. The stable isotope data attests that water of the Sfax-Agareb aquifer originated from recent rainwater has evaporated in the unsaturated zone. The result of this study will be helpful for a proper water development and for remediation of strategies to decrease the pollution source.
Conflicts of Interest
The authors declare that they have no conflicts of interest.


