Assessment of Rainfall Intensity Equations Enlisted in the Egyptian Code for Designing Potable Water and Sewage Networks
Abstract
The design of combined sewage system networks is based on the sanitary discharge (domestic, industrial) and the runoff generated by rainfall. The Egyptian code of practice for designing potable water and sewage networks gives two Intensity-Duration-Frequency (IDF) equations to calculate the intensity of rainfall to be applied to all cities of Egypt. The purpose of this research is to study and assess the adequacy of the rainfall intensity equations suggested by the aforementioned Egyptian code. This is carried out taking into consideration the available rainfall ground station measurements and remote sensing Tropical Rainfall Measurement Mission (TRMM) satellite rainfall estimates. This assessment leads to the following results. For the Mediterranean coastal cities, the code of practice equations significantly underestimates the rainfall intensities for all storm durations, which may lead to road networks damage and accidents due to hydroplaning and road flooding. On the contrary, for many other southern cities along the Nile Valley, the code equations significantly overestimate the rainfall intensities, which affects the economical aspect of the sewage network. Consequently, the current research suggests new rainfall intensity equations instead of the code equations.
1. Introduction
Although most of Egypt is considered to be a hyperarid country, rainfall storms often cause serious accumulation of storm water in arterial and main roads, preventing quick drainage and causing major road accidents. This leads occasionally to fatalities as it happened recently in Alexandria and Beheira coastal governorates in 2015 and in Upper Egypt in Assiut in 1994, Hurghada in 1996, and Aswan in 2010 and hence comes the necessity of introducing efficient drainage/flood protection systems capable of preventing/limiting the loss of property and lives.
As commonly assumed in the rational method, the storm duration is taken equal to the time of concentration (Tc); the Egyptian code also states that the rainfall values are to be reduced by 30% in noncoastal cities.
Underestimation of rainfall intensity may lead to road network damage and accidents, while overestimation of this important design parameter can greatly affect the economical aspect of the sewage network increasing the required quantities of manholes, catch basins, pipe sizes, and consequently the construction costs.
2. Literature Review
-
Talbot equation:
(3) -
Bernard (or Montana) equation:
(4) -
Kimijima equation:
(5) -
Sherman equation:
(6) -
where I is the rainfall intensity (mm/hr), d is the storm duration (min), and a, b, and e are parameters related to meteorological conditions.
In Egypt, Fahmi et al. [8] developed generalized depth-duration-frequency equations in Sudr Region, Sinai Peninsula, North East of Egypt. Available short duration rainfall records were analyzed for six stations, all located in Wadi Sudr catchment. Short duration ratios were derived and compared with regionalized USA and other international short duration ratios. Finally, IDF relationships were developed and compared with equations from previously published studies in both humid and arid climates.
El-Sayed [9] constructed IDF curves for the whole Sinai Peninsula, using rainfall frequency analysis techniques. In addition, a regional IDF formula was proposed to estimate rainfall intensity for various return periods and rainfall durations at ungauged sites using the available rainfall data. The Kimijima form of the IDF equation was used to describe the rainfall intensity duration relationship. The parameters of this equation are determined based on the minimum Root Mean Square Error (RMSE).
Additional to the choice of the IDF equation, it is also essential to decide, based on historical records of precipitation events, the temporal distribution of the design storm. Design storms could be represented utilizing diverse distributions. One of the most widely used design hyetographs is the Soil Conservation Services (SCS) hypothetical storms profiles (see Figure 1). The SCS type II storm distribution — suggested by the SCS for use in the relatively arid states of the USA — is the most critical (conservative) design storm, as it has the steepest slope (highest rainfall intensity). That is the reason it is commonly used in the Middle East region codes of practice.
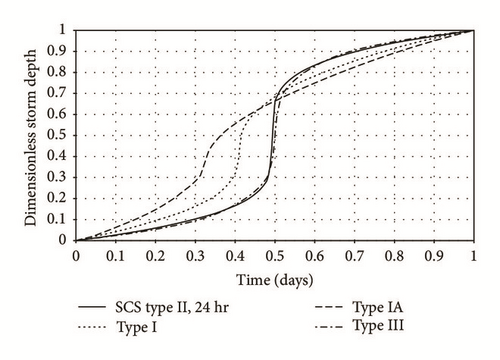
However, some researchers have questioned the adequacy (and safety) of using the SCS type II storm profile in arid regions. Among them, Ahmed [10] analyzed available short duration rainfall data for rainfall stations located in Kingdom of Saudi Arabia and in Sinai (Egypt) in order to suggest design storms representative of the recorded storms. The proposed design storms were compared with published design storms proposed by SCS. The study concluded that most of rainfall stations of short duration rainfall ratios showed more conservative patterns than the SCS type II storm profile.
In the same line of thoughts, a modified SCS dimensionless curve was proposed by Awadallah and Younan [11] to remedy unsafe peak discharge values resulting from utilizing the SCS storm profiles. The rationale of the modification is that if the total storm duration is limited to a certain value, the total SCS dimensionless storm ought to be confined more or less in this storm duration.
In the absence of ground stations subdaily rainfall data, one of the proposed approaches to determine the storm average durations is to make use of the satellite rainfall estimates. One of the free wellsprings of satellite measured precipitation information is the data obtained from the Tropical Rainfall Measurement Mission (TRMM) satellite. TRMM is the first spaceborne precipitation radar intended to give 3D-maps of storm structure. The mission was launched on November 28, 1997. It provides systematic, multiyear estimations of precipitation in the tropics as key inputs to weather and climate research. The satellite observations are supplemented by ground radar and rain gauge measurements to frequently validate the satellite rain estimation techniques. Unfortunately, no ground station in the Arab nations is utilized for the calibration procedure of the satellite TRMM data.
Few papers have investigated the use of TRMM data in IDF development because of the reduced capabilities of TRMM data to reproduce extreme storms. Endreny and Imbeah [12] showed that it was essential to combine ground rainfall measurements and TRMM data for IDF generation in Ghana. Awadallah et al. [13] explored the joint use of limited ground rainfall stations and TRMM data to develop Intensity-Duration-Frequency (IDF) curves. Homogeneity of the means and variances were first checked for both types of data. In this research, TRMM data were also used to develop ratios between 24 hr rainfall depth and shorter duration depths. A. G. Awadallah and N. A. Awadallah [14] presented the use of three separate rainfall datasets: maximum annual daily data, monthly data (both from ground gauging stations), and TRMM data to develop robust IDF in Namibe, south of Angola. TRMM data was used to derive relations between maximum monthly and maximum daily rainfall and between subdaily and daily rainfall depths. Awadallah and Tabet [15] have also successfully mixed the information of TRMM and available ground stations for maximum flood levels estimation at high return periods.
3. Study Area, Data Collection, and Preparation
This current research focusses on Egypt and mainly its major cities located in the Nile Valley and Delta, along the Mediterranean and Red Sea coasts and three major oases in the western desert of Egypt. Available rainfall information in the study area is described in the following subsections.
3.1. Rainfall Ground Stations Data
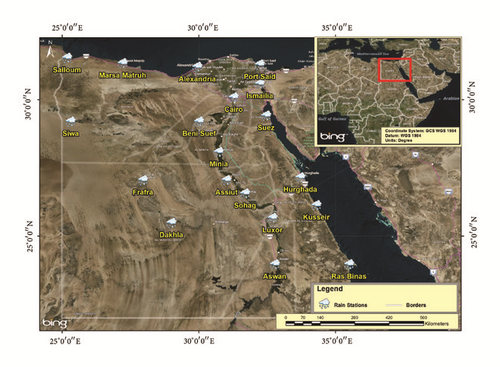
The Egyptian roads code of practice Vol.7 [16] provides some rainfall records of maximum daily precipitation (Pmax_daily) for 19 major Egyptian cities for the period from 1961 to 1990. For some rainfall stations, Pmax_daily data are available for a wider period collected from the Egyptian Meteorological Authority. The location, elevation, and number of years available for all ground rainfall stations used in this study are shown in Figure 2 and Table 1.
| Number | Rainfall station | Latitude | Longitude | Observation period | Number of complete years of record | Elevation ASL (m) | ||
|---|---|---|---|---|---|---|---|---|
| Name | deg (°) | min (′) | deg (°) | min (′) | ||||
| 1 | Salloum | 31 | 32 | 25 | 11 | 1931–1990 | 60 | 4 |
| 2 | Marsa Matruh | 31 | 20 | 27 | 13 | 1905–2015 | 86 | 25 |
| 3 | Alexandria | 31 | 12 | 29 | 57 | 1957–2008 | 52 | 1.78 |
| 4 | Port Said | 31 | 17 | 32 | 14 | 1901–2013 | 78 | 0.8 |
| 5 | Cairo | 30 | 5 | 31 | 17 | 1961–1990 | 30 | 34.4 |
| 6 | Beni Suef | 29 | 12 | 30 | 1 | 1961–1990 | 29 | 32.4 |
| 7 | Minia | 28 | 5 | 30 | 44 | 1961–2015 | 62 | 37.15 |
| 8 | Assiut (Airport) | 27 | 3 | 31 | 1 | 1961–1997 | 37 | 226 |
| 9 | Sohag | 26 | 34 | 31 | 42 | 1961–1998 | 38 | 61.63 |
| 10 | Luxor | 25 | 40 | 32 | 42 | 1961–1990 | 30 | 83.25 |
| 11 | Aswan | 23 | 58 | 32 | 47 | 1961–2001 | 41 | 194.23 |
| 12 | Siwa | 29 | 12 | 25 | 19 | 1920–1990 | 50 | 15 |
| 13 | Frafra | 27 | 3 | 27 | 58 | 1961–1990 | 30 | 82.2 |
| 14 | Dakhla | 25 | 29 | 29 | 0 | 1961–1990 | 30 | 106.21 |
| 15 | Ismailia | 30 | 35 | 32 | 14 | 1961–2001 | 33 | 11.54 |
| 16 | Suez | 29 | 25 | 32 | 28 | 1961–2001 | 41 | 2.48 |
| 17 | Hurghada | 27 | 9 | 33 | 43 | 1957–2010 | 52 | 8.43 |
| 18 | Kusseir | 26 | 8 | 34 | 18 | 1961–2000 | 40 | 8.7 |
| 19 | Ras Binas | 23 | 58 | 35 | 30 | 1961–2001 | 36 | 3.66 |
3.2. Tropical Rainfall Measuring Mission Data (TRMM)
In this study, Version 7 TRMM Multisatellite Precipitation Analysis (TMPA) (3B42) research version, 3-hour 0.25° × 0.25° resolution data is used [17, 18]. Zulkafli et al. [19] showed that version 7 of TRMM data has less bias compared to other TRMM versions. TRMM data are used to get the 3-hourly precipitation depths (P3 hr) (mm) for each station location, to enable us to derive the subdaily rainfall information, namely, the ratio between P3 hr and the 24-hr rainfall depth (P24 hr). P3 hr data available from the TRMM are from 1998 to 2015.
4. Methodology and Results
- (1)
Frequency analysis of the annual maxima rainfall records was undertaken using various statistical distributions to estimate rainfall depths at high return periods. The common statistical distributions tested in this study are the Gamma, 3-parameter lognormal, Gumbel, and Pearson type III distributions. This class of statistical distributions was determined, following the approach described in El Adlouni et al. [20], using log-log and mean excess function plots. The approach is implemented in HYFRAN (Hydrological Frequency Analysis) software package (INRS 2008). The method of moments (MoM) was used for parameter estimation. The MoM is the stipulated method in the Egyptian code of practice for flood protection [21].
- (2)
Akaike Information Criterion (AIC) [22] and Bayesian Information Criterion (BIC) [23] are used to choose the best distributions to fit the data. Both criteria are based on the deviation between the fitted distribution and the empirical probability with a penalization, which is a function of the number of parameters of the distribution and the sample size. The distribution having the smallest BIC and AIC is the one that best fits the data. Table 2 recapitulates the selected statistical distribution for each station and the obtained daily precipitation for various return periods (PRT_daily) (mm) usually needed for designing stormwater networks. To get the 24-hr estimate (PRT_24 Hr), the daily estimate is multiplied by 1.13 [24]
- (3)
Starting from the 3-hourly TRMM precipitation depth (P3 hr) for each station location, the 6 hr precipitation (P6 hr) is obtained by summing up two consecutive P3 hr. Precipitation depths at 9 hr (P9 hr), 12 hr (P12 hr), and 24 hr (P24 hr) are similarly obtained. For each year the maximum precipitation depths, Pmax_3 hr, Pmax_6 hr, Pmax_9 hr, Pmax_12 hr, and Pmax_24 hr, are extracted.
- (4)
Frequency analysis is then performed on the annual maxima for all durations to obtain rainfall depth values for return periods of 2, 3, 5, 10, and 20 years. Ratios are derived between the subdaily rainfall values and the maximum 24-hr rainfall, that is, Px hr/P24 hr at all previously mentioned return periods and all previously mentioned x-hr durations. The ratios averaged across all return periods are obtained for each duration. These average ratios are compared with those embedded in the well-known temporal distribution of SCS type II.
-
Table 3 shows the average TRMM ratios at 3 hrs, 6 hrs, 12 hrs, and 24 hrs for each rainfall station as well as the percentage difference of Px hr/P24 hr ratios compared with the SCS type II ratios: that is, . The rationale behind this is that the TRMM rainfall values are not considered in their absolute values but relative to themselves (i.e., only ratios of Px hr/P24 hr are used). This approach is more appropriate as the TRMM rainfall values are not calibrated for Egypt and it was reported in many studies that TRMM data tend to underestimate the extreme rainfall values.
- (5)
Stations are grouped according to (a) the similarity of the TRMM P3 hr/P24 hr ratio with the SCS type II P3 hr/P24 hr ratio and (b) their geographic location. To apply the first grouping criterion, the absolute value of Perctratio could be used to classify the rainfall stations into three classes as follows:
- (i)
Class A1: 0 < |Perctratio| < 10
- (ii)
Class A2: 10 ≤ |Perctratio| < 20
- (iii)
Class A3: |Perctratio| ≥ 20
- (i)
-
Based on the geographic location and the known rainfall patterns in Egypt, rainfall stations could be classified as follows:
- (i)
Group B1 includes all stations lying north of Egypt along the coast of the Mediterranean Sea.
- (ii)
Group B2 includes all stations lying east of Egypt along the coast of the Red Sea and along the Suez Canal.
- (iii)
Group B3 includes all stations lying along the Nile Valley and in the Western Desert.
- (i)
- (6)
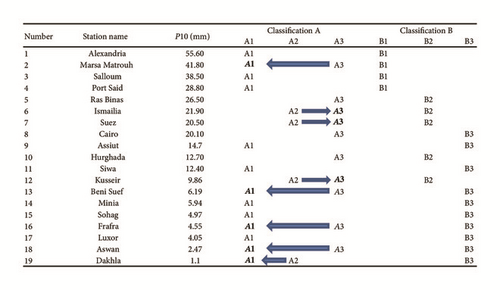
To further merge the two grouping criteria, the following is undertaken (Figure 3):
- (i)
Marsa Matrouh station would be better classified as part of class A1 instead of class A3 to be with the stations lying along the coast of the Mediterranean Sea.
- (ii)
Ismailia, Suez, and Kusseir stations would be classified with class A3 instead of class A2 because the max. 24 hr precipitations (P) (mm) of Ismaelia, Suez, and Cairo stations are almost the same.
- (iii)
Farafra, Beni Suef, and Aswan stations could be classified with class A1 instead of class A3 because the max. 24 hr precipitations (P) (mm) of Farafra, Beni Suef, Minia, Luxor, and Sohag stations are almost the same.
- (iv)
Dakhla Station could be classified with class A1 instead of class A2 with the stations lying in the Western Desert.
- (v)
As such group A2 is emptied and only two groups are left, A1 and A3, which are now termed Group X and Group Y to avoid ambiguity.
- (i)
- (7)
Short duration ratios (less than 3 hr) are obtained via (7). It is well known that ratios for durations from 2 hours to 5 minutes are quasi-constant in different climates because of the similarity of convective storms patterns. This was first identified by Bell [2] and confirmed for arid regions by FAO [25] and Awadallah and Younan [11] and references therein.
(7) - (8)
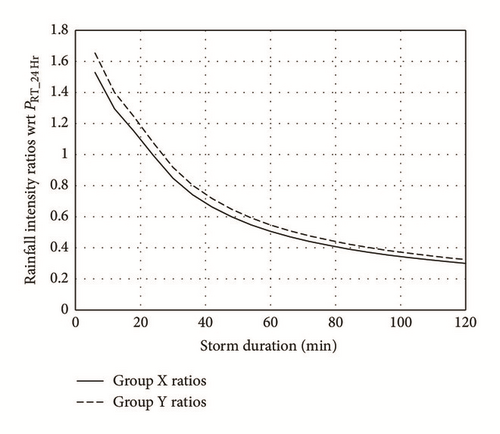
First the intensity duration relationships are established in a ratio form, relative to the 24 hr value. The IDF ratio equations are developed for two groups only (X and Y). This is carried out similar to the Egyptian code of practice equations, that is, one relationship for storm durations from 10 min till 20 min and another from 20 min to 120 min, as shown in Table 4 and Figure 4.
-
To transform the IDF ratio relationships to the IDF absolute values relationships the ratio relationships are multiplied by PRT_24 Hr at the required return period. In fact, PRT_24 Hr is obtained by multiplying a 1.13 adjustment factor by PRT_daily of Table 2. The IDF relationships are summarized by (8) and (9).
-
For Group X (which contains Salloum, Marsa Matrouh, Alexandria, Port Said, Siwa, Dakhla, Frafra, Beni Suef, Minia, Assiut, Sohag, Luxor, and Aswan),
(8) -
For Group Y (which contains Cairo, Suez, Ismailia, Hurghada, Kusseir, and Ras Binas),
(9) -
where I is rainfall intensity (mm/hr), PRT_24 Hr is the 24-hr rainfall at the required return period (mm).
-
The proposed equations are used similar to any IDF equations in the rational method: that is, first PRT_24 Hr is determined based on the available 24-hr rainfall and the storm duration could be assumed equal to the time of concentration Tc (min), as per the rational method assumption, and consequently the rainfall intensity is determined as per (8) or (9) depending on the city. For the cities not mentioned or where no available rainfall gauges are present, it is recommended to use the results of the nearest station (max. 24 hrs rainfall at the required return period and the corresponding proposed equation).
- (9)
For the 10-year return period, the rainfall intensity values from the Egyptian code are compared to those of the proposed equations and the ratio (Icode/Iproposed) is calculated. The results are presented in Table 5.
| Station name | Selected frequency distribution | Daily precipitation PRT_daily at various return periods (mm) | ||||
|---|---|---|---|---|---|---|
| 2 yr | 3 yr | 5 yr | 10 yr | 20 yr | ||
| Alexandria | 3-parameter lognormal | 26.20 | 33.60 | 42.80 | 55.60 | 69.00 |
| Salloum | Gamma | 18.90 | 27.30 | 36.60 | 49.00 | 61.00 |
| Port Said | Gamma | 14.3 | 20.6 | 27.5 | 36.7 | 45.60 |
| Siwa | Gamma | 3.69 | 6.24 | 9.24 | 13.60 | 17.90 |
| Minia | Gamma | 1.32 | 2.46 | 3.85 | 5.94 | 8.10 |
| Assiut | Gamma | 0.622 | 2.7 | 6.55 | 14.7 | 24.7 |
| Sohag | Gamma | 0.21 | 0.90 | 2.20 | 4.97 | 8.41 |
| Luxor | Gamma | 0.15 | 0.62 | 1.64 | 4.05 | 7.20 |
| Marsa Matrouh | Gamma | 24.70 | 33.20 | 42.20 | 53.80 | 64.80 |
| Cairo | Gamma | 7.36 | 10.90 | 14.80 | 20.10 | 26.90 |
| Hurghada | Gamma | 0.81 | 2.88 | 6.26 | 12.70 | 20.30 |
| Ras Binas | Gamma | 1.82 | 6.22 | 13.30 | 26.50 | 42.00 |
| Frafra | Gamma | 0.25 | 0.97 | 2.18 | 4.55 | 7.38 |
| Beni Suef | Gamma | 2.16 | 3.26 | 4.50 | 6.19 | 7.85 |
| Aswan | Gamma | 0.09 | 0.42 | 1.06 | 2.47 | 4.24 |
| Suez | Gamma | 4.69 | 8.59 | 13.40 | 20.50 | 27.80 |
| Ismailia | Gamma | 8.51 | 12.30 | 16.40 | 21.90 | 27.20 |
| Kusseir | Gamma | 1.47 | 3.33 | 5.82 | 9.86 | 14.20 |
| Dakhla | Pearson type III | 0 | 0.0794 | 0.39 | 1.1 | 2.01 |
| Station name | TRMM ratios | SCS ratios | Percentage difference% | ||||||
|---|---|---|---|---|---|---|---|---|---|
| Max. 3 hr | Max. 6 hr | Max. 12 hr | Max. 3 hr | Max. 6 hr | Max. 12 hr | Max. 3 hr | Max. 6 hr | Max. 12 hr | |
| Alexandria | 0.61 | 0.76 | 0.94 | 0.60 | 0.71 | 0.84 | 1.67 | 7.04 | 11.90 |
| Marsa Matrouh | 0.74 | 0.89 | 0.97 | 23.33 | 25.35 | 15.48 | |||
| Salloum | 0.56 | 0.71 | 0.92 | −6.67 | 0.00 | 9.52 | |||
| Port Said | 0.63 | 0.77 | 0.91 | 5.00 | 8.45 | 8.33 | |||
| Cairo | 0.75 | 0.79 | 0.91 | 25.00 | 11.27 | 8.33 | |||
| Suez | 0.70 | 0.80 | 0.90 | 16.67 | 12.68 | 7.14 | |||
| Ismailia | 0.71 | 0.83 | 0.94 | 18.33 | 16.90 | 11.90 | |||
| Hurghada | 0.73 | 0.85 | 0.91 | 21.67 | 19.72 | 8.33 | |||
| Ras Binas | 0.91 | 0.94 | 0.95 | 51.67 | 32.39 | 13.10 | |||
| Kusseir | 0.51 | 0.70 | 0.90 | −15.00 | −1.41 | 7.14 | |||
| Siwa | 0.64 | 0.77 | 0.90 | 6.67 | 8.45 | 7.14 | |||
| Farafra | 0.85 | 0.93 | 0.93 | 41.67 | 30.99 | 10.71 | |||
| Dakhla | 0.69 | 0.73 | 0.91 | 15.00 | 2.82 | 8.33 | |||
| Beni Suef | 0.76 | 0.85 | 0.91 | 26.67 | 19.72 | 8.33 | |||
| Minia | 0.65 | 0.78 | 0.85 | 8.33 | 9.86 | 1.19 | |||
| Assiut | 0.57 | 0.75 | 0.92 | −5.00 | 5.63 | 9.52 | |||
| Sohag | 0.65 | 0.75 | 0.90 | 8.33 | 5.63 | 7.14 | |||
| Luxor | 0.56 | 0.70 | 0.84 | −6.67 | −1.41 | 0.00 | |||
| Aswan | 0.72 | 0.85 | 0.97 | 20.00 | 19.72 | 15.48 | |||
| Time (min) | Duration (min) | Rainfall intensity ratio | |
|---|---|---|---|
| Group X | Group Y | ||
| (10 min < duration < 20 min) | 6 | 1.529 | 1.654 |
| 12 | 1.295 | 1.401 | |
| 18 | 1.150 | 1.244 | |
| (20 min < duration < 120 min) | 24 | 0.993 | 1.075 |
| 30 | 0.848 | 0.918 | |
| 36 | 0.742 | 0.803 | |
| 42 | 0.663 | 0.718 | |
| 48 | 0.600 | 0.649 | |
| 54 | 0.548 | 0.593 | |
| 60 | 0.506 | 0.547 | |
| 66 | 0.471 | 0.509 | |
| 72 | 0.441 | 0.477 | |
| 78 | 0.416 | 0.450 | |
| 84 | 0.392 | 0.424 | |
| 90 | 0.372 | 0.403 | |
| 96 | 0.354 | 0.383 | |
| 102 | 0.339 | 0.367 | |
| 108 | 0.325 | 0.352 | |
| 114 | 0.312 | 0.337 | |
| 120 | 0.300 | 0.325 | |
| Number | Station | (10 min < duration < 20 min) | (20 min < duration < 120 min) |
|---|---|---|---|
| 1 | Alexandria | 42.64% | 38.58% |
| 2 | Salloum | 61.58 | 55.72% |
| 3 | Port Said | 64.6% | 58.5% |
| 4 | Siwa | 133.84% | 121.10% |
| 5 | Minia | 279.39% | 252.80% |
| 6 | Assiut | 112.90% | 102.15% |
| 7 | Sohag | 333.92% | 302.14% |
| 8 | Luxor | 409.78% | 370.77% |
| 9 | Frafra | 364.75% | 330.03% |
| 10 | Beni Suef | 268.11% | 242.59% |
| 11 | Aswan | 671.90% | 607.94% |
| 12 | Marsa Matrouh | 56.72% | 51.32% |
| 13 | Dakhla | 1508.73% | 1365.11% |
| 14 | Cairo | 89.66% | 84.83% |
| 15 | Hurghada | 165.06% | 156.15% |
| 16 | Ras Binas | 82.70% | 74.83% |
| 17 | Suez | 85.52% | 77.39% |
| 18 | Ismailia | 80.06% | 72.44% |
| 19 | Kusseir | 222.27% | 201.12% |
5. Verification of the Proposed Equations
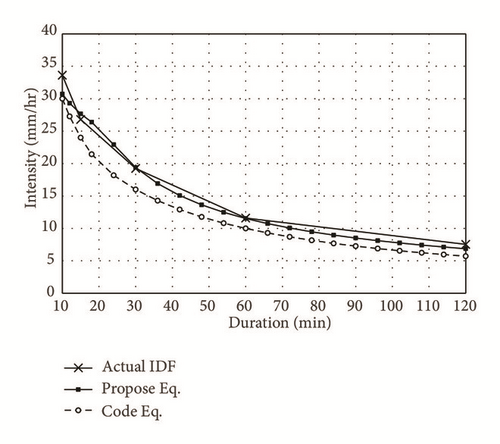
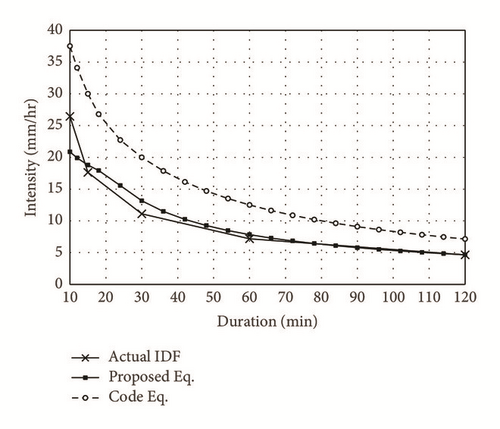
Comparisons were carried out between the two code equations, the proposed equations, and the actual IDF curves — prepared by independent sources and used in actual projects in Cairo, Alexandria, and Hurghada — as shown in Table 6 and Figures 5, 6–7. The comparison shows that the equations developed by the current research are quasi identical to the IDF curves developed by independent sources.
| Duration (min) | Cairo 10 yr (mm/hr) | Alexandria 10 yr (mm/hr) | Hurghada 10 yr (mm/hr) | ||||||
|---|---|---|---|---|---|---|---|---|---|
| Actual IDF | Proposed Eq. | Code Eq. | Actual IDF | Proposed Eq. | Code Eq. | Actual IDF | Proposed Eq. | Code Eq. | |
| 10 | 33.62 | 30.72 | 30.00 | 98.30 | 84.42 | 37.50 | 26.45 | 20.86 | 37.50 |
| 12 | 29.30 | 27.27 | 80.54 | 34.09 | 19.90 | 34.09 | |||
| 15 | 26.796 | 27.66 | 24.00 | 83.01 | 76.03 | 30.00 | 17.63 | 18.79 | 30.00 |
| 18 | 26.39 | 21.43 | 72.54 | 26.79 | 17.92 | 26.79 | |||
| 24 | 22.92 | 18.18 | 63.00 | 22.73 | 15.57 | 22.73 | |||
| 30 | 19.24 | 19.39 | 16.00 | 57.53 | 53.30 | 20.00 | 11.1 | 13.17 | 20.00 |
| 36 | 16.92 | 14.29 | 46.50 | 17.86 | 11.49 | 17.86 | |||
| 42 | 15.07 | 12.9 | 41.43 | 16.13 | 10.24 | 16.13 | |||
| 48 | 13.64 | 11.76 | 37.48 | 14.71 | 9.26 | 14.71 | |||
| 54 | 12.49 | 10.81 | 34.32 | 13.51 | 8.48 | 13.51 | |||
| 60 | 11.60 | 11.54 | 10.00 | 36.41 | 31.72 | 12.5 | 7.18 | 7.84 | 12.50 |
| 66 | 10.74 | 9.30 | 29.53 | 11.63 | 7.30 | 11.63 | |||
| 72 | 10.07 | 8.70 | 27.67 | 10.87 | 6.84 | 10.87 | |||
| 78 | 9.48 | 8.16 | 26.06 | 10.2 | 6.44 | 10.20 | |||
| 84 | 8.97 | 7.69 | 24.65 | 9.62 | 6.09 | 9.62 | |||
| 90 | 8.52 | 7.27 | 23.41 | 9.09 | 5.78 | 9.09 | |||
| 96 | 8.11 | 6.90 | 22.30 | 8.62 | 5.51 | 8.62 | |||
| 102 | 7.75 | 6.56 | 21.31 | 8.20 | 5.27 | 8.20 | |||
| 108 | 7.43 | 6.25 | 20.42 | 7.81 | 5.05 | 7.81 | |||
| 114 | 7.13 | 5.97 | 19.61 | 7.46 | 4.85 | 7.46 | |||
| 120 | 7.54 | 6.87 | 5.71 | 21.19 | 18.87 | 7.14 | 4.65 | 4.66 | 7.14 |

6. Conclusions and Recommendations
Two Intensity-Duration-Frequency (IDF) equations are given in the Egyptian code of practice for designing potable water and sewage networks to be applied in all cities of Egypt for the purpose of design of combined sewage networks. The objective of this current research is to evaluate the suitability and safety of application of these rainfall IDF equations based on the actual rainfall ground station measurements collected from different cities in Egypt and remote sensing Tropical Rainfall Measurement Mission (TRMM) satellite rainfall estimates. Results indicated that the rainfall intensity equations suggested by the Egyptian code are not applicable in most cities. Some rainfall stations produce records that indicate higher values than the ones calculated by the aforementioned equations and this may lead indirectly to road networks damage and accidents due to underestimation of the generated peak discharges. Records from other rainfall stations yield values significantly less than the corresponding calculated values by the same equations, which can greatly affect the economical aspect of the sewage network as it may increase the capital cost of the project. The current study proposes new general equations to be used. Further studies should check the short duration ratios obtained from TRMM against ground stations short duration ratios, if made available.
Competing Interests
The authors declare that they have no competing interests.


